Gaia Mission Passes Vital Tests

Caption: Fully integrated Gaia payload module with nearly all of the multilayer insulation fabric installed. Credit: Astrium SAS

Earlier this month ESA’s Gaia mission passed vital tests to ensure it can withstand the extreme temperatures of space. This week in the Astrium cleanroom at Intespace in Toulouse, France, had it’s payload module integrated, ready for further testing before it finally launches next year. This is a good opportunity to get to know the nuts and bolts of this exciting mission that will survey a billion stars in the Milky Way and create a 3D map to reveal its composition, formation and evolution.

Gaia will be operating at a distance of 1.5 million km from Earth (at L2 Lagrangian point, which keeps pace with Earth as we orbit the Sun) and at a temperature of -110°C. It will monitor each of its target stars about 70 times over a five-year period, repeatedly measuring the positions, to an accuracy of 24 microarcseconds, of all objects down to magnitude 20 (about 400,000 times fainter than can be seen with the naked eye) This will provide detailed maps of each star’s motion, to reveal their origins and evolution, as well as the physical properties of each star, including luminosity, temperature, gravity and composition.

The service module houses the electronics for the science instruments and the spacecraft resources, such as thermal control, propulsion, communication, and attitude and orbit control. During the 19-day tests earlier this month, Gaia endured the thermal balance and thermal-vacuum cycle tests, held under vacuum conditions and subjected to a range of temperatures. Temperatures inside Gaia during the test period were recorded between -20°C and +70°C.

“The thermal tests went very well; all measurements were close to predictions and the spacecraft proved to be robust with stable behavior,” reports Gaia Project Manager Giuseppe Sarri.

For the next two months the same thermal tests will be carried out on Gaia’s payload module, which contains the scientific instruments. The module is covered in multilayer insulation fabric to protect the spacecraft’s optics and mirrors from the cold of space, called the ‘thermal tent.’

Gaia contains two optical telescopes that can precisely determine the location of stars and analyze their spectra. The largest mirror in each telescope is 1.45 m by 0.5 m. The Focal Plane Assembly features three different zones associated with the science instruments: Astro, the astrometric instrument that detects and pinpoints celestial objects; the Blue and Red Photometers (BP/RP), that determines stellar properties like temperature, mass, age, elemental composition; and the Radial-Velocity Spectrometer (RVS),that measures the velocity of celestial objects along the line of sight.

The focal plane array will also carry the largest digital camera ever built with, the most sensitive set of light detectors ever assembled for a space mission, using 106 CCDs with nearly 1 billion pixels covering an area of 2.8 square metres

After launch, Gaia will always point away from the Sun. L2 offers a stable thermal environment, a clear view of the Universe as the Sun, Earth and Moon are always outside the instruments’ fields of view, and a moderate radiation environment. However Gaia must still be shielded from the heat of the Sun by a giant shade to keep its instruments in permanent shadow. A ‘skirt’ will unfold consisting of a dozen separate panels. These will deploy to form a circular disc about 10 m across. This acts as both a sunshade, to keep the telescopes stable at below –100°C, and its surface will be partially covered with solar panels to generate electricity.

Once testing is completed the payload module will be mated to the service module at the beginning of next year and Gaia will be launched from Europe’s Spaceport in French Guiana at the end of 2013.

Find out more about the mission here

Effects of Einstein’s Elusive Gravitational Waves Observed

Chandra data (above, graph) on J0806 show that its X-rays vary with a period of 321.5 seconds, or slightly more than five minutes. This implies that the X-ray source is a binary star system where two white dwarf stars are orbiting each other (above, illustration) only 50,000 miles apart, making it one of the smallest known binary orbits in the Galaxy. According to Einstein's General Theory of Relativity, such a system should produce gravitational waves - ripples in space-time - that carry energy away from the system and cause the stars to move closer together. X-ray and optical observations indicate that the orbital period of this system is decreasing by 1.2 milliseconds every year, which means that the stars are moving closer at a rate of 2 feet per year.
Potential stellar collision. Credit: Chandra

Two white dwarfs similar to those in the system SDSS J065133.338+284423.37 spiral together in this illustration from NASA. Credit: D. Berry/NASA GSFC

Locked in a spiraling orbital embrace, the super-dense remains of two dead stars are giving astronomers the evidence needed to confirm one of Einstein’s predictions about the Universe.

A binary system located about 3,000 light-years away, SDSS J065133.338+284423.37 (J0651 for short) contains two white dwarfs orbiting each other rapidly — once every 12.75 minutes. The system was discovered in April 2011, and since then astronomers have had their eyes — and four separate telescopes in locations around the world — on it to see if gravitational effects first predicted by Einstein could be seen.

According to Einstein, space-time is a structure in itself, in which all cosmic objects — planets, stars, galaxies — reside. Every object with mass puts a “dent” in this structure in all dimensions; the more massive an object, the “deeper” the dent. Light energy travels in a straight line, but when it encounters these dents it can dip in and veer off-course, an effect we see from Earth as gravitational lensing.

Einstein also predicted that exceptionally massive, rapidly rotating objects — such as a white dwarf binary pair — would create outwardly-expanding ripples in space-time that would ultimately “steal” kinetic energy from the objects themselves. These gravitational waves would be very subtle, yet in theory, observable.

Read: Astronomy Without a Telescope: Gravitational Waves

What researchers led by a team at The University of Texas at Austin have found is optical evidence of gravitational waves slowing down the stars in J0651. Originally observed in 2011 eclipsing each other (as seen from Earth) once every six minutes, the stars now eclipse six seconds sooner. This equates to a predicted orbital period reduction of about 0.25 milliseconds each year.*

“These compact stars are orbiting each other so closely that we have been able to observe the usually negligible influence of gravitational waves using a relatively simple camera on a 75-year-old telescope in just 13 months,” said study lead author J.J. Hermes, a graduate student at The University of Texas at Austin.

Based on these measurements, by April 2013 the stars will be eclipsing each other 20 seconds sooner than first observed. Eventually they will merge together entirely.

Although this isn’t “direct” observation of gravitational waves, it is evidence inferred by their predicted effects… akin to watching a floating lantern in a dark pond at night moving up and down and deducing that there are waves present.

“It’s exciting to confirm predictions Einstein made nearly a century ago by watching two stars bobbing in the wake caused by their sheer mass,” said Hermes.

As of early last year NASA and ESA had a proposed mission called LISA (Laser Interferometer Space Antenna) that would have put a series of 3 detectors into space 5 million km apart, connected by lasers. This arrangement of precision-positioned spacecraft could have detected any passing gravitational waves in the local space-time neighborhood, making direct observation possible. Sadly this mission was canceled due to FY2012 budget cuts for NASA, but ESA is moving ahead with developments for its own gravitational wave mission, called eLISA/NGO — the first “pathfinder” portion of which is slated to launch in 2014.

The study was submitted to Astrophysical Journal Letters on August 24. Read more on the McDonald Observatory news release here.

Inset image: simulation of binary black holes causing gravitational waves – C. Reisswig, L. Rezzolla (AEI); Scientific visualization – M. Koppitz (AEI & Zuse Institute Berlin)

*The difference in the eclipse time is noted as six seconds even though the orbital period decay of the two stars is only .25 milliseconds/year because of a pile-up effect of all the eclipses observed since April 2011. The measurements made by the research team takes into consideration the phase change in the J0651 system, which experiences a piling effect — similar to an out-of-sync watch — that increases relative to time^2 and is therefore a larger and easier number to detect and work with. Once that was measured, the actual orbital period decay could be figured out.

A Star’s Dying Scream May Be a Beacon for Physics

When a star suffered an untimely demise at the hands of a hidden black hole, astronomers detected its doleful, ululating wail — in the key of D-sharp, no less — from 3.9 billion light-years away. The resulting ultraluminous X-ray blast revealed the supermassive black hole’s presence at the center of a distant galaxy in March of 2011, and now that information could be used to study the real-life workings of black holes, general relativity, and a concept first proposed by Einstein in 1915.

Within the centers of many spiral galaxies (including our own) lie the undisputed monsters of the Universe: incredibly dense supermassive black holes, containing the equivalent masses of millions of Suns packed into areas smaller than the diameter of Mercury’s orbit. While some supermassive black holes (SMBHs) surround themselves with enormous orbiting disks of superheated material that will eventually spiral inwards to feed their insatiable appetites — all the while emitting ostentatious amounts of high-energy radiation in the process — others lurk in the darkness, perfectly camouflaged against the blackness of space and lacking such brilliant banquet spreads. If any object should find itself too close to one of these so-called “inactive” stellar corpses, it would be ripped to shreds by the intense tidal forces created by the black hole’s gravity, its material becoming an X-ray-bright accretion disk and particle jet for a brief time.

Such an event occurred in March 2011, when scientists using NASA’s Swift telescope detected a sudden flare of X-rays from a source located nearly 4 billion light-years away in the constellation Draco. The flare, called Swift J1644+57, showed the likely location of a supermassive black hole in a distant galaxy, a black hole that had until then remained hidden until a star ventured too close and became an easy meal.

See an animation of the event below:

The resulting particle jet, created by material from the star that got caught up in the black hole’s intense magnetic field lines and was blown out into space in our direction (at 80-90% the speed of light!) is what initially attracted astronomers’ attention. But further research on Swift J1644+57 with other telescopes has revealed new information about the black hole and what happens when a star meets its end.

(Read: The Black Hole that Swallowed a Screaming Star)

In particular, researchers have identified what’s called a quasi-periodic oscillation (QPO) embedded inside the accretion disk of Swift J1644+57. Warbling at 5 mhz, in effect it’s the low-frequency cry of a murdered star. Created by fluctuations in the frequencies of X-ray emissions, such a source near the event horizon of a supermassive black hole can provide clues to what’s happening in that poorly-understood region close to a black hole’s point-of-no-return.

Einstein’s theory of general relativity proposes that space itself around a massive rotating object — like a planet, star, or, in an extreme instance, a supermassive black hole — is dragged along for the ride (the Lense-Thirring effect.) While this is difficult to detect around less massive bodies a rapidly-rotating black hole would create a much more pronounced effect… and with a QPO as a benchmark within the SMBH’s disk the resulting precession of the Lense-Thirring effect could, theoretically, be measured.

If anything, further investigations of Swift J1644+57 could provide insight to the mechanics of general relativity in distant parts of the Universe, as well as billions of years in the past.

See the team’s original paper here, lead authored by R.C. Reis of the University of Michigan.

Thanks to Justin Vasel for his article on Astrobites.

Image: NASA. Video: NASA/GSFC

Dark Galaxies Found from the Early Universe

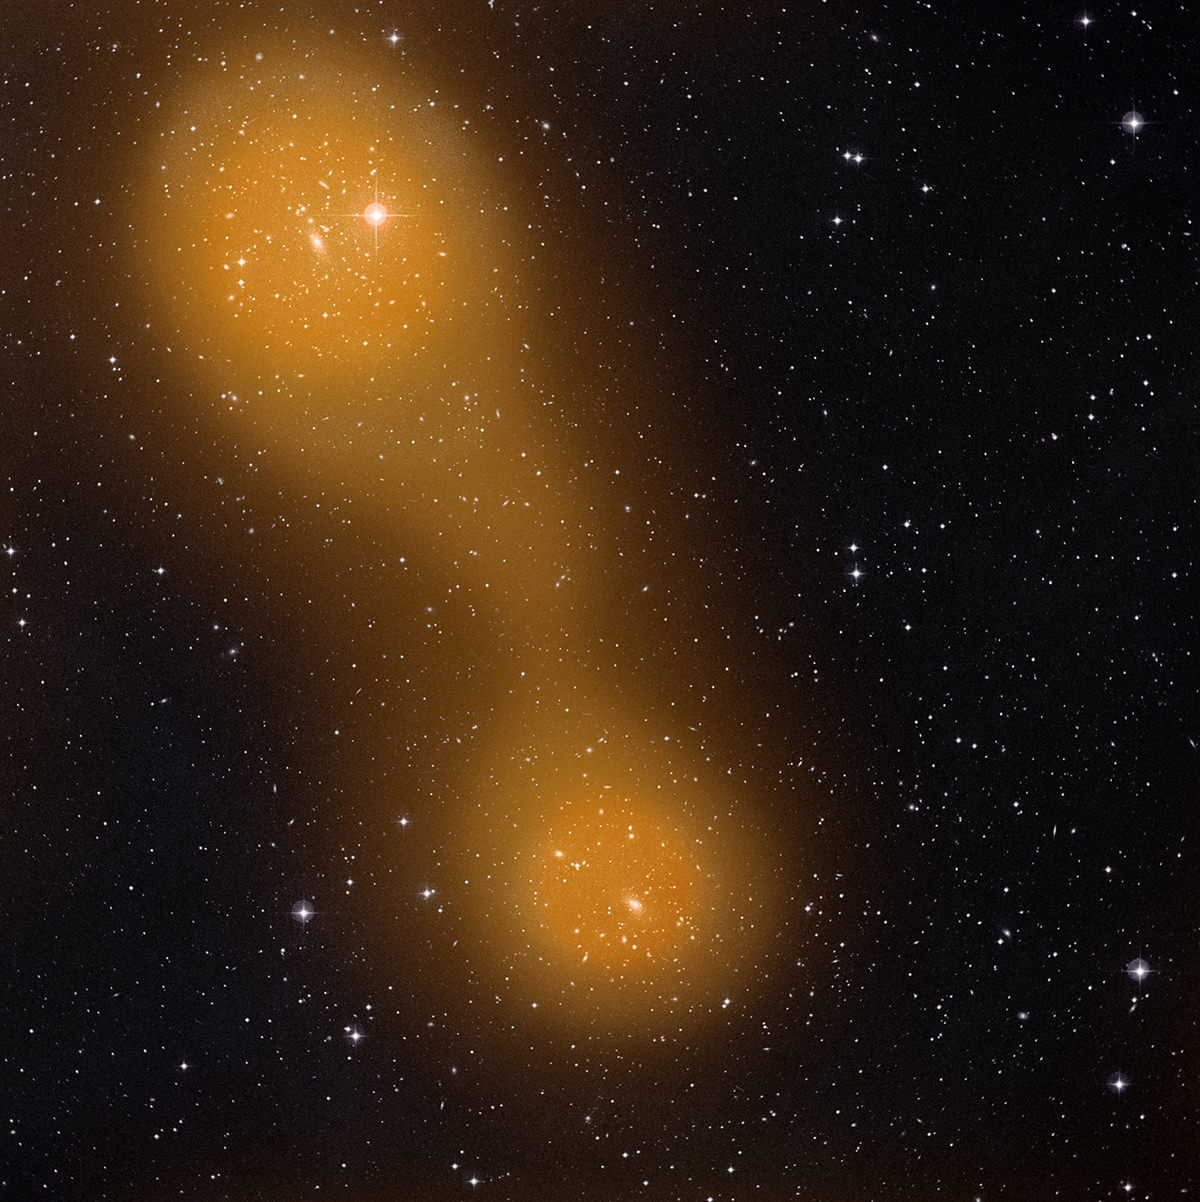
Caption: This deep image shows the region of the sky around the quasar HE0109-3518, near the center of the image. The energetic radiation of the quasar makes dark galaxies glow, helping astronomers to understand the obscure early stages of galaxy formation. Credit:ESO, Digitized Sky Survey 2 and S. Cantalupo (UCSC)


How do you find a dark galaxy? Shine some light on the subject. Dark galaxies — ancient galaxies that contain little to no stars — have been theorized to exist but have not been observed, until now. An international team of astronomers think they have detected these elusive objects by observing them glowing as they are illuminated by a quasar.

Dark galaxies are small, gas-rich galaxies in the early Universe that are very inefficient at forming stars. They are predicted by theories of galaxy formation and are thought to be the building blocks of today’s bright, star-filled galaxies. Astronomers think that they may have fed large galaxies with much of the gas that later formed into the stars that exist today.

Being essentially devoid of stars, these dark galaxies don’t emit much light, making them very hard to detect. For years astronomers have been trying to develop new techniques that could confirm the existence of these galaxies. Small absorption dips in the spectra of background sources of light have hinted at their existence. However, this new study marks the first time that such objects have been seen directly.

“Our approach to the problem of detecting a dark galaxy was simply to shine a bright light on it,” said Simon Lilly, from the Institute for Astronomy at ETH Zurich, Switzerland) co-author of a new paper published in the Monthly Notices of the Royal Astronomical Society. “We searched for the fluorescent glow of the gas in dark galaxies when they are illuminated by the ultraviolet light from a nearby and very bright quasar. The light from the quasar makes the dark galaxies light up in a process similar to how white clothes are illuminated by ultraviolet lamps in a night club.”

Fluorescence is the emission of light by a substance illuminated by a light source. Quasars are very bright, distant galaxies, and their brightness makes them powerful beacons that can help to illuminate the surrounding area, probing the era when the first stars and galaxies were forming out of primordial gas.

This video zooms into the region around the quasar, HE 0109-3518:

In order to detect the extremely faint fluorescent glow of these dark galaxies, the team used the Very Large Telescope (VLT), and took a series of very long exposures, mapping a region of the sky around the bright quasar HE 0109-3518. They looked for the ultraviolet light that is emitted by hydrogen gas when it is subjected to intense radiation.

The team detected almost 100 gaseous objects lying within a few million light-years of the quasar, and narrowed the possible dark galaxies down to 12 objects. The team says these are the most convincing identifications of dark galaxies in the early Universe to date.

“Our observations with the VLT have provided evidence for the existence of compact and isolated dark clouds,” said Sebastiano Cantalupo from the University of California, Santa Cruz, lead author of the paper. “With this study, we’ve made a crucial step towards revealing and understanding the obscure early stages of galaxy formation and how galaxies acquired their gas.”

The astronomers were also able to determine some of the properties of the dark galaxies, and estimate that the mass of the gas in them is about 1 billion times that of the Sun, typical for gas-rich, low-mass galaxies in the early Universe. They were also able to estimate that the star formation efficiency is suppressed by a factor of more than 100 relative to typical star-forming galaxies found at similar stage in cosmic history.

Read the team’s paper.

Source: ESO

Dark Matter Makes a Comeback

The Milky Way an moonrise over ESO's Paranal observatory (ESO/H.H. Heyer)

[/caption]

Recent reports of dark matter’s demise may be greatly exaggerated, according to a new paper from researchers at the Institute for Advanced Study.

Astronomers with the European Southern Observatory announced in April a surprising lack of dark matter in the galaxy within the vicinity of our solar system.

The ESO team, led by Christian Moni Bidin of the Universidad de Concepción in Chile, mapped over 400 stars near our Sun, spanning a region approximately 13,000 light-years in radius. Their report identified a quantity of material that matched what could be directly observed: stars, gas, and dust… but no dark matter.

“Our calculations show that it should have shown up very clearly in our measurements,” Bidin had stated, “but it was just not there!”

But other scientists were not so sure about some assumptions the ESO team had based their calculations upon.

Researchers Jo Bovy and Scott Tremaine from the Institute for Advanced Study in Princeton, NJ, have submitted a paper claiming that the results reported by Moni Biden et al are “incorrect”, and based on an “invalid assumption” of the motions of stars within — and above — the plane of the galaxy.

(Read: Astronomers Witness a Web of Dark Matter)

“The main error is that they assume that the mean azimuthal (or rotational) velocity of their tracer population is independent of Galactocentric cylindrical radius at all heights,” Bovy and Tremaine state in their paper. “This assumption is not supported by the data, which instead imply only that the circular speed is independent of radius in the mid-plane.”

The researchers point out the stars within the local neighborhood move slower than the average velocity assumed by the ESO team, in a behavior called asymmetric drift. This lag varies with a cluster’s position within the galaxy, but, according to Bovy and Tremaine, “this variation cannot be measured for the sample [used by Moni Biden’s team] as the data do not span a large enough range.”

When the IAS researchers took Moni Biden’s observations but replaced the ESO team’s “invalid” assumptions on star movement within and above the galactic plane with their own “data-driven” ones, the dark matter reappeared.

Artist's impression of dark matter surrounding the Milky Way. (ESO/L. Calçada)

“Our analysis shows that the locally measured density of dark matter is consistent with that extrapolated from halo models constrained at Galactocentric distances,” Bovy and Tremaine report.

As such, the dark matter that was thought to be there, is there. (According to the math, that is.)

And, the two researchers add, it’s not only there but it’s there in denser amounts than average — at least in the area around our Sun.

“The halo density at the Sun, which is the relevant quantity for direct dark matter detection experiments, is likely to be larger because of gravitational focusing by the disk,” Bovy and Tremaine note.

When they factored in their data-driven calculations on stellar velocities and the movement of the halo of non-baryonic material that is thought to envelop the Milky Way, they found that “the dark matter density in the mid-plane is enhanced… by about 20%.”

So rather than a “serious blow” to the existence of dark matter, the findings by Bovy and Tremaine — as well as Moni Biden and his team — may have not only found dark matter, but given us 20% more!

Now that’s a good value.

Read the IAS team’s full paper here.

(Tip of the non-baryonic hat to Christopher Savage, post-doctorate researcher at the Oskar Klein Centre for Cosmoparticle Physics at Stockholm University for the heads up on the paper.)

Polar Telescope Casts New Light On Dark Energy And Neutrino Mass

The 10-meter South Pole Telescope in Antarctica at the Amundsen-Scott Station. (Daniel Luong-Van, National Science Foundation)

[/caption]

Located at the southermost point on Earth, the 280-ton, 10-meter-wide South Pole Telescope has helped astronomers unravel the nature of dark energy and zero in on the actual mass of neutrinos — elusive subatomic particles that pervade the Universe and, until very recently, were thought to be entirely without measureable mass.

The NSF-funded South Pole Telescope (SPT) is specifically designed to study the secrets of dark energy, the force that purportedly drives the incessant (and apparently still accelerating) expansion of the Universe. Its millimeter-wave observation abilities allow scientists to study the Cosmic Microwave Background (CMB) which pervades the night sky with the 14-billion-year-old echo of the Big Bang.

Overlaid upon the imprint of the CMB are the silhouettes of distant galaxy clusters — some of the most massive structures to form within the Universe. By locating these clusters and mapping their movements with the SPT, researchers can see how dark energy — and neutrinos — interact with them.

“Neutrinos are amongst the most abundant particles in the universe,” said Bradford Benson, an experimental cosmologist at the University of Chicago’s Kavli Institute for Cosmological Physics. “About one trillion neutrinos pass through us each second, though you would hardly notice them because they rarely interact with ‘normal’ matter.”

If neutrinos were particularly massive, they would have an effect on the large-scale galaxy clusters observed with the SPT. If they had no mass, there would be no effect.

The SPT collaboration team’s results, however, fall somewhere in between.

Even though only 100 of the 500 clusters identified so far have been surveyed, the team has been able to place a reasonably reliable preliminary upper limit on the mass of neutrinos — again, particles that had once been assumed to have no mass.

Previous tests have also assigned a lower limit to the mass of neutrinos, thus narrowing the anticipated mass of the subatomic particles to between 0.05 – 0.28 eV (electron volts). Once the SPT survey is completed, the team expects to have an even more confident result of the particles’ masses.

“With the full SPT data set we will be able to place extremely tight constraints on dark energy and possibly determine the mass of the neutrinos,” said Benson.

“We should be very close to the level of accuracy needed to detect the neutrino masses,” he noted later in an email to Universe Today.

The South Pole Telescope's unique position allows it to watch the night sky for months on end. (NSF)

Such precise measurements would not have been possible without the South Pole Telescope, which has the ability due to its unique location to observe a dark sky for very long periods of time. Antarctica also offers SPT a stable atmosphere, as well as very low levels of water vapor that might otherwise absorb faint millimeter-wavelength signals.

“The South Pole Telescope has proven to be a crown jewel of astrophysical research carried out by NSF in the Antarctic,” said Vladimir Papitashvili, Antarctic Astrophysics and Geospace Sciences program director at NSF’s Office of Polar Programs. “It has produced about two dozen peer-reviewed science publications since the telescope received its ‘first light’ on Feb. 17, 2007. SPT is a very focused, well-managed and amazing project.”

The team’s findings were presented by Bradford Benson at the American Physical Society meeting in Atlanta on April 1.

Read more on the NSF press release here.

Can “Warp Speed” Planets Zoom Through Interstellar Space?

Artist’s conception of a runaway planet zooming through interstellar space. A glowing volcano on the planet’s surface hints at active plate tectonics that may keep the planet warm. Image Credit: David A. Aguilar (CfA)

[/caption]Nearly ten years ago, astronomers were stunned to discover a star that had been apparently flung from its own system and travelling at over a million kilometers per hour. Over the years, a question was brought up: If stars can be ejected at a high velocity, what about planets?

Avi Loeb (Harvard-Smithsonian Center for Astrophysics) states, “These warp-speed planets would be some of the fastest objects in our Galaxy. If you lived on one of them, you’d be in for a wild ride from the center of the galaxy to the Universe at large.”

Idan Ginsburg (Dartmouth College) adds, “Other than subatomic particles, I don’t know of anything leaving our galaxy as fast as these runaway planets.”

The mechanics responsible for the super-fast planets are similar to those responsible for “hypervelocity” stars. With stars, if a binary system drifts too closely to a supermassive black hole (such as the ones in the center of galaxies), the gravitational forces can separate the stars – sending one outward at incredible speeds, and the other in orbit around the black hole. Interestingly enough, “Warp Speed” planets can theoretically travel at a few percent of the speed of light – not quite as fast as Star Trek’s Enterprise, but you get the point.

The team, which includes Loeb and Ginsburg, created computer models to simulate the outcome if each star had planets orbiting it. The outcome of the model showed that the star shot into interstellar space would keep its planets, but the star “captured” into orbit around the black hole would have its planets stripped and sent outward at incredible speeds. Typical speeds for the planets range from 11-16 million kilometers per hour, but given the proper conditions could approach even higher velocities.

As of now, it’s impossible for astronomers to detect a wandering planet due to their small size, distance, and rarity. By detecting the dimming of light levels from a hypervelocity star as an orbiting planet crosses its face, astronomers could detect planets that orbit said star.

Ginsburg added, “With one-in-two odds of seeing a transit, if a hypervelocity star had a planet, it makes a lot of sense to watch for them.”

Loeb concluded with, “Travel agencies advertising journeys on hypervelocity planets might appeal to particularly adventurous individuals.”

If you’d like to learn more about hypervelocity planets, you can access a draft version of the upcoming paper at: http://arxiv.org/abs/1201.1446

Source(s): Harvard-Smithsonian Center for Astrophysics , Hypervelocity Planets and Transits Around Hypervelocity Stars

Astronomers Witness a Web of Dark Matter

Dark matter in the Universe is distributed as a network of gigantic dense (white) and empty (dark) regions, where the largest white regions are about the size of several Earth moons on the sky. Credit: Van Waerbeke, Heymans, and CFHTLens collaboration.

[/caption]

We can’t see it, we can’t feel it, we can’t even interact with it… but dark matter may very well be one of the most fundamental physical components of our Universe. The sheer quantity of the stuff – whatever it is – is what physicists have suspected helps gives galaxies their mass, structure, and motion, and provides the “glue” that connects clusters of galaxies together in vast networks of cosmic webs.

Now, for the first time, this dark matter web has been directly observed.

An international team of astronomers, led by Dr. Catherine Heymans of the University of Edinburgh, Scotland, and Associate Professor Ludovic Van Waerbeke of the University of British Columbia, Vancouver, Canada, used data from the Canada-France-Hawaii Telescope Legacy Survey to map images of about 10 million galaxies and study how their light was bent by gravitational lensing caused by intervening dark matter.

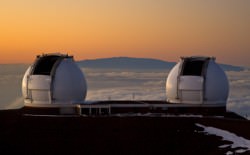
Inside the dome of the Canada-France-Hawaii Telescope. (CFHT)

The images were gathered over a period of five years using CFHT’s 1×1-degree-field, 340-megapixel MegaCam. The galaxies observed in the survey are up to 6 billion light-years away… meaning their observed light was emitted when the Universe was only a little over half its present age.

The amount of distortion of the galaxies’ light provided the team with a visual map of a dark matter “web” spanning a billion light-years across.

“It is fascinating to be able to ‘see’ the dark matter using space-time distortion,” said Van Waerbeke. “It gives us privileged access to this mysterious mass in the Universe which cannot be observed otherwise. Knowing how dark matter is distributed is the very first step towards understanding its nature and how it fits within our current knowledge of physics.”

This is one giant leap toward unraveling the mystery of this massive-yet-invisible substance that pervades the Universe.

The densest regions of the dark matter cosmic web host massive clusters of galaxies. Credit: Van Waerbeke, Heymans, and CFHTLens collaboration.

“We hope that by mapping more dark matter than has been studied before, we are a step closer to understanding this material and its relationship with the galaxies in our Universe,” Dr. Heymans said.

The results were presented today at the American Astronomical Society meeting in Austin, Texas. Read the release here.

Guest Post: The Cosmic Energy Inventory

The Cosmic Energy Inventory chart by Markus Pössel. Click for larger version.

[/caption]

Now that the old year has drawn to a close, it’s traditional to take stock. And why not think big and take stock of everything there is?

Let’s base our inventory on energy. And as Einstein taught us that energy and mass are equivalent, that means automatically taking stock of all the mass that’s in the universe, as well – including all the different forms of matter we might be interested in.

Of course, since the universe might well be infinite in size, we can’t simply add up all the energy. What we’ll do instead is look at fractions: How much of the energy in the universe is in the form of planets? How much is in the form of stars? How much is plasma, or dark matter, or dark energy?


The chart above is a fairly detailed inventory of our universe. The numbers I’ve used are from the article The Cosmic Energy Inventory by Masataka Fukugita and Jim Peebles, published in 2004 in the Astrophysical Journal (vol. 616, p. 643ff.). The chart style is borrowed from Randall Munroe’s Radiation Dose Chart over at xkcd.

These fractions will have changed a lot over time, of course. Around 13.7 billion years ago, in the Big Bang phase, there would have been no stars at all. And the number of, say, neutron stars or stellar black holes will have grown continuously as more and more massive stars have ended their lives, producing these kinds of stellar remnants. For this chart, following Fukugita and Peebles, we’ll look at the present era. What is the current distribution of energy in the universe? Unsurprisingly, the values given in that article come with different uncertainties – after all, the authors are extrapolating to a pretty grand scale! The details can be found in Fukugita & Peebles’ article; for us, their most important conclusion is that the observational data and their theoretical bases are now indeed firm enough for an approximate, but differentiated and consistent picture of the cosmic inventory to emerge.

Let’s start with what’s closest to our own home. How much of the energy (equivalently, mass) is in the form of planets? As it turns out: not a lot. Based on extrapolations from what data we have about exoplanets (that is, planets orbiting stars other than the sun), just one part-per-million (1 ppm) of all energy is in the form of planets; in scientific notation: 10-6. Let’s take “1 ppm” as the basic unit for our first chart, and represent it by a small light-green square. (Fractions of 1 ppm will be represented by partially filled such squares.) Here is the first box (of three), listing planets and other contributions of about the same order of magnitude:

So what else is in that box? Other forms of condensed matter, mainly cosmic dust, account for 2.5 ppm, according to rough extrapolations based on observations within our home galaxy, the Milky Way. Among other things, this is the raw material for future planets!

For the next contribution, a jump in scale. To the best of our knowledge, pretty much every galaxy contains a supermassive black hole (SMBH) in its central region. Masses for these SMBHs vary between a hundred thousand times the mass of our Sun and several billion solar masses. Matter falling into such a black hole (and getting caught up, intermittently, in super-hot accretion disks swirling around the SMBHs) is responsible for some of the brightest phenomena in the universe: active galaxies, including ultra high-powered quasars. The contribution of matter caught up in SMBHs to our energy inventory is rather modest, though: about 4 ppm; possibly a bit more.

Who else is playing in the same league? The sum total of all electromagnetic radiation produced by stars and by active galaxies (to name the two most important sources) over the course of the last billions of years, to name one: 2 ppm. Also, neutrinos produced during supernova explosions (at the end of the life of massive stars), or in the formation of white dwarfs (remnants of lower-mass stars like our Sun), or simply as part of the ordinary fusion processes that power ordinary stars: 3.2 ppm all in all.

Then, there’s binding energy: If two components are bound together, you will need to invest energy in order to separate them. That’s why binding energy is negative – it’s an energy deficit you will need to overcome to pry the system’s components apart. Nuclear binding energy, from stars fusing together light elements to form heavier ones, accounts for -6.3 ppm in the present universe – and the total gravitational binding energy accumulated as stars, galaxies, galaxy clusters, other gravitationally bound objects and the large-scale structure of the universe have formed over the past 14 or so billion years, for an even larger -13.4 ppm. All in all, the negative contributions from binding energy more than cancel out all the positive contributions by planets, radiation, neutrinos etc. we’ve listed so far.

Which brings us to the next level. In order to visualize larger contributions, we need a change scale. In box 2, one square will represent a fraction of 1/20,000 or 0.00005. Put differently: Fifty of the little squares in the first box correspond to a single square in the second box:

So here, without further ado, is box 2 (including, in the upper right corner, a scale model of the first box):

Now we are in the realm of stars and related objects. By measuring the luminosity of galaxies, and using standard relations between the masses and luminosity of stars (“mass-to-light-ratio”), you can get a first estimate for the total mass (equivalently: energy) contained in stars. You’ll also need to use the empirical relation (“initial mass function”) for how this mass is distributed, though: How many massive stars should there be? How many lower-mass stars? Since different stars have different lifetimes (live massively, die young), this gives estimates for how many stars out there are still in the prime of life (“main sequence stars”) and how many have already died, leaving white dwarfs (from low-mass stars), neutron stars (from more massive stars) or stellar black holes (from even more massive stars) behind. The mass distribution also provides you with an estimate of how much mass there is in substellar objects such as brown dwarfs – objects which never had sufficient mass to make it to stardom in the first place.

Let’s start small with the neutron stars at 0.00005 (1 square, at our current scale) and the stellar black holes (0.00007). Interestingly, those are outweighed by brown dwarfs which, individually, have much less mass, but of which there are, apparently, really a lot (0.00014; this is typical of stellar mass distribution – lots of low-mass stars, much fewer massive ones.) Next come white dwarfs as the remnants of lower-mass stars like our Sun (0.00036). And then, much more than all the remnants or substellar objects combined, ordinary, main sequence stars like our Sun and its higher-mass and (mostly) lower-mass brethren (0.00205).

Interestingly enough, in this box, stars and related objects contribute about as much mass (or energy) as more undifferentiated types of matter: molecular gas (mostly hydrogen molecules, at 0.00016), hydrogen and helium atoms (HI and HeI, 0.00062) and, most notably, the plasma that fills the void between galaxies in large clusters (0.0018) add up to a whopping 0.00258. Stars, brown dwarfs and remnants add up to 0.00267.

Further contributions with about the same order of magnitude are survivors from our universe’s most distant past: The cosmic background radiation (CMB), remnant of the extremely hot radiation interacting with equally hot plasma in the big bang phase, contributes 0.00005; the lesser-known cosmic neutrino background, another remnant of that early equilibrium, contributes a remarkable 0.0013. The binding energy from the first primordial fusion events (formation of light elements within those famous “first three minutes”) gives another contribution in this range: -0.00008.

While, in the previous box, the matter we love, know and need was not dominant, it at least made a dent. This changes when we move on to box 3. In this box, one square corresponds to 0.005. In other words: 100 squares from box 2 add up to a single square in box 3:

Box 3 is the last box of our chart. Again, a scale model of box 2 is added for comparison: All that’s in box 2 corresponds to one-square-and-a-bit in box 3.

The first new contribution: warm intergalactic plasma. Its presence is deduced from the overall amount of ordinary matter (which follows from measurements of the cosmic background radiation, combined with data from surveys and measurements of the abundances of light elements) as compared with the ordinary matter that has actually been detected (as plasma, stars, e.g.). From models of large-scale structure formation, it follows that this missing matter should come in the shape (non-shape?) of a diffuse plasma, which isn’t dense (or hot) enough to allow for direct detection. This cosmic filler substance amounts to 0.04, or 85% of ordinary matter, showing just how much of a fringe phenomena those astronomical objects we usually hear and read about really are.

The final two (dominant) contributions come as no surprise for anyone keeping up with basic cosmology: dark matter at 23% is, according to simulations, the backbone of cosmic large-scale structure, with ordinary matter no more than icing on the cake. Last but not least, there’s dark energy with its contribution of 72%, responsible both for the cosmos’ accelerated expansion and for the 2011 physics Nobel Prize.

Minority inhabitants of a part-per-million type of object made of non-standard cosmic matter – that’s us. But at the same time, we are a species, that, its cosmic fringe position notwithstanding, has made remarkable strides in unravelling the big picture – including the cosmic inventory represented in this chart.

__________________________________________

Here is the full chart for you to download: the PNG version (1200×900 px, 233 kB) or the lovingly hand-crafted SVG version (29 kB).

The chart “The Cosmic Energy Inventory” is licensed under Creative Commons BY-NC-SA 3.0. In short: You’re free to use it non-commercially; you must add the proper credit line “Markus Pössel [www.haus-der-astronomie.de]”; if you adapt the work, the result must be available under this or a similar license.

Technical notes: As is common in astrophysics, Fukugita and Peebles give densities as fractions of the so-called critical density; in the usual cosmological models, that density, evaluated at any given time (in this case: the present), is critical for determining the geometry of the universe. Using very precise measurements of the cosmic background radiation, we know that the average density of the universe is indistinguishable from the critical density. For simplicity’s sake, I’m skipping this detour in the main text and quoting all of F & P’s numbers as “fractions of the universe’s total energy (density)”.

For the supermassive black hole contributions, I’ve neglected the fraction ?n in F & P’s article; that’s why I’m quoting a lower limit only. The real number could theoretically be twice the quoted value; it’s apparently more likely to be close to the value given here, though. For my gravitational binding energy, I’ve added F & P’s primeval gravitational binding energy (no. 4 in their list) and their binding energy from dissipative gravitational settling (no. 5).

The fact that the content of box 3 adds up not quite to 1, but to 0.997, is an artefact of rounding not quite consistently when going from box 2 to box 3. I wanted to keep the sum of all that’s in box 2 at the precision level of that box.

Quadruply Lensed Dwarf Galaxy 12.8 Billion Light Years Away

Galaxy Cluster MACS J0329.6-0211 lenses several background galaxies including a distant dwarf galaxy. CREDIT: A. Zitrin, et al.

[/caption]

Gravitational lensing is a powerful tool for astronomers that allows them to explore distant galaxies in far more detail than would otherwise be allowed. Without this technique, galaxies at the edge of the visible universe are little more than tiny blobs of light, but when magnified dozens of times by foreground clusters, astronomers are able to explore the internal structural properties more directly.

Recently, astronomers at the University of Heidelberg discovered a gravitational lensed galaxy that ranked among the most distant ever seen. Although there’s a few that beat this one out in distance, this one is remarkable for being a rare quadruple lens.

The images for this remarkable discovery were taken using the Hubble Space Telescope in August and October of this year, using a total of 16 different colored filters as well as additional data from the Spitzer infrared telescope. The foreground cluster, MACS J0329.6-0211, is some 4.6 billion light years distant. In the above image, the background galaxy has been split into four images, labelled by the red ovals and marked as 1.1 – 1.4. They are enlarged in the upper right.

Assuming that the mass of the foreground cluster is concentrated around the galaxies that were visible, the team attempted to reverse the effects the cluster would have on the distant galaxy, which would reverse the distortions. The restored image, also corrected for redshift, is shown in the lower box in the upper right corner.

After correcting for these distortions, the team estimated that the total mass of the distant galaxy is only a few billion times the mass of the Sun. In comparison, the Large Magellanic Cloud, a dwarf satellite to our own galaxy, is roughly ten billion solar masses. The overall size of the galaxy was determined to be small as well. These conclusions fit well with expectations of galaxies in the early universe which predict that the large galaxies in today’s universe were built from the combination of many smaller galaxies like this one in the distant past.

The galaxy also conforms to expectations regarding the amount of heavy elements which is significantly lower than stars like the Sun. This lack of heavy elements means that there should be little in the way of dust grains. Such dust tends to be a strong block of shorter wavelengths of light such as ultraviolet and blue. Its absence helps give the galaxy its blue tint.

Star formation is also high in the galaxy. The rate at which they predict new stars are being born is somewhat higher than in other galaxies discovered around the same distance, but the presence of brighter clumps in the restored image suggest the galaxy may be undergoing some interactions, driving the formation of new stars.