Polar Telescope Casts New Light On Dark Energy And Neutrino Mass

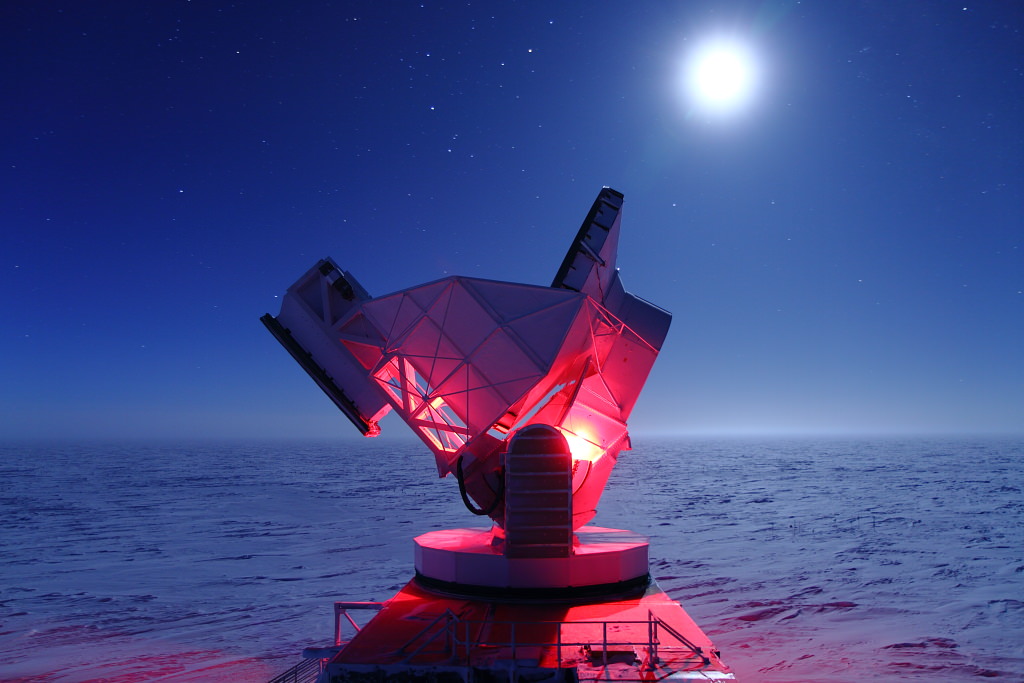
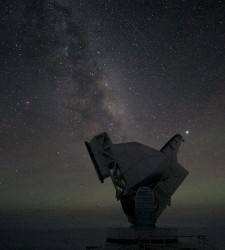
The 10-meter South Pole Telescope in Antarctica at the Amundsen-Scott Station. (Daniel Luong-Van, National Science Foundation)

[/caption]

Located at the southermost point on Earth, the 280-ton, 10-meter-wide South Pole Telescope has helped astronomers unravel the nature of dark energy and zero in on the actual mass of neutrinos — elusive subatomic particles that pervade the Universe and, until very recently, were thought to be entirely without measureable mass.

The NSF-funded South Pole Telescope (SPT) is specifically designed to study the secrets of dark energy, the force that purportedly drives the incessant (and apparently still accelerating) expansion of the Universe. Its millimeter-wave observation abilities allow scientists to study the Cosmic Microwave Background (CMB) which pervades the night sky with the 14-billion-year-old echo of the Big Bang.

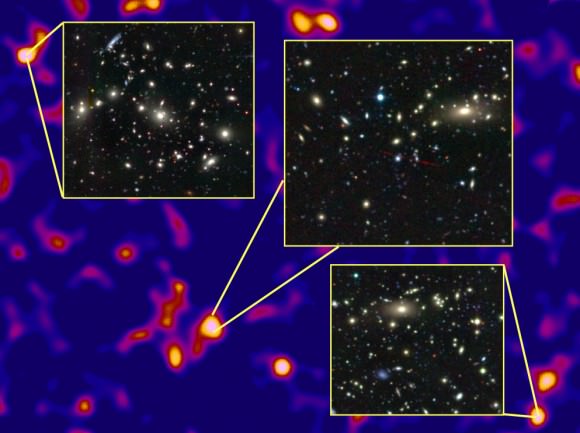
Overlaid upon the imprint of the CMB are the silhouettes of distant galaxy clusters — some of the most massive structures to form within the Universe. By locating these clusters and mapping their movements with the SPT, researchers can see how dark energy — and neutrinos — interact with them.

“Neutrinos are amongst the most abundant particles in the universe,” said Bradford Benson, an experimental cosmologist at the University of Chicago’s Kavli Institute for Cosmological Physics. “About one trillion neutrinos pass through us each second, though you would hardly notice them because they rarely interact with ‘normal’ matter.”

If neutrinos were particularly massive, they would have an effect on the large-scale galaxy clusters observed with the SPT. If they had no mass, there would be no effect.

The SPT collaboration team’s results, however, fall somewhere in between.

Even though only 100 of the 500 clusters identified so far have been surveyed, the team has been able to place a reasonably reliable preliminary upper limit on the mass of neutrinos — again, particles that had once been assumed to have no mass.

Previous tests have also assigned a lower limit to the mass of neutrinos, thus narrowing the anticipated mass of the subatomic particles to between 0.05 – 0.28 eV (electron volts). Once the SPT survey is completed, the team expects to have an even more confident result of the particles’ masses.

“With the full SPT data set we will be able to place extremely tight constraints on dark energy and possibly determine the mass of the neutrinos,” said Benson.

“We should be very close to the level of accuracy needed to detect the neutrino masses,” he noted later in an email to Universe Today.

The South Pole Telescope's unique position allows it to watch the night sky for months on end. (NSF)

Such precise measurements would not have been possible without the South Pole Telescope, which has the ability due to its unique location to observe a dark sky for very long periods of time. Antarctica also offers SPT a stable atmosphere, as well as very low levels of water vapor that might otherwise absorb faint millimeter-wavelength signals.

“The South Pole Telescope has proven to be a crown jewel of astrophysical research carried out by NSF in the Antarctic,” said Vladimir Papitashvili, Antarctic Astrophysics and Geospace Sciences program director at NSF’s Office of Polar Programs. “It has produced about two dozen peer-reviewed science publications since the telescope received its ‘first light’ on Feb. 17, 2007. SPT is a very focused, well-managed and amazing project.”

The team’s findings were presented by Bradford Benson at the American Physical Society meeting in Atlanta on April 1.

Read more on the NSF press release here.

Can “Warp Speed” Planets Zoom Through Interstellar Space?

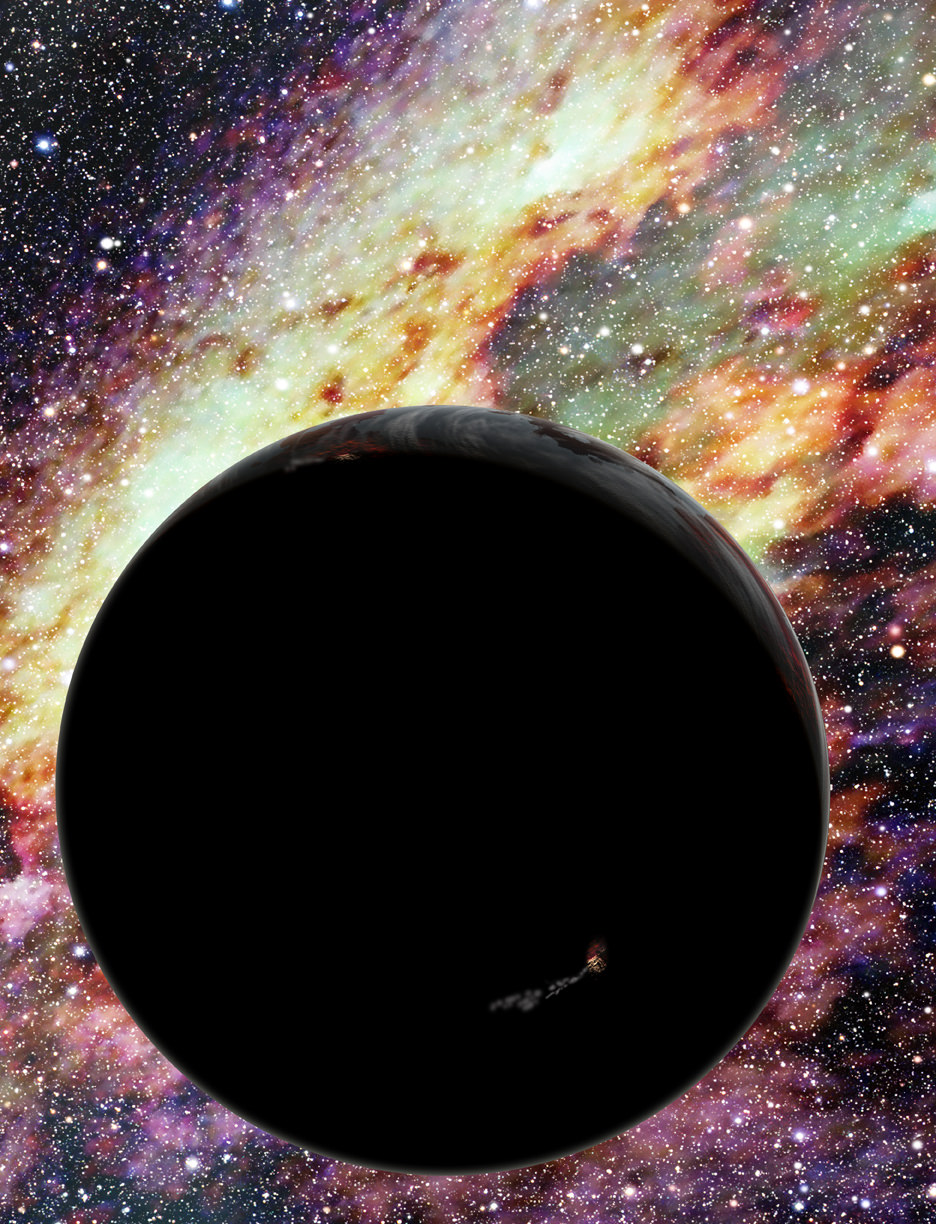
Artist’s conception of a runaway planet zooming through interstellar space. A glowing volcano on the planet’s surface hints at active plate tectonics that may keep the planet warm. Image Credit: David A. Aguilar (CfA)

[/caption]Nearly ten years ago, astronomers were stunned to discover a star that had been apparently flung from its own system and travelling at over a million kilometers per hour. Over the years, a question was brought up: If stars can be ejected at a high velocity, what about planets?

Avi Loeb (Harvard-Smithsonian Center for Astrophysics) states, “These warp-speed planets would be some of the fastest objects in our Galaxy. If you lived on one of them, you’d be in for a wild ride from the center of the galaxy to the Universe at large.”

Idan Ginsburg (Dartmouth College) adds, “Other than subatomic particles, I don’t know of anything leaving our galaxy as fast as these runaway planets.”

The mechanics responsible for the super-fast planets are similar to those responsible for “hypervelocity” stars. With stars, if a binary system drifts too closely to a supermassive black hole (such as the ones in the center of galaxies), the gravitational forces can separate the stars – sending one outward at incredible speeds, and the other in orbit around the black hole. Interestingly enough, “Warp Speed” planets can theoretically travel at a few percent of the speed of light – not quite as fast as Star Trek’s Enterprise, but you get the point.

The team, which includes Loeb and Ginsburg, created computer models to simulate the outcome if each star had planets orbiting it. The outcome of the model showed that the star shot into interstellar space would keep its planets, but the star “captured” into orbit around the black hole would have its planets stripped and sent outward at incredible speeds. Typical speeds for the planets range from 11-16 million kilometers per hour, but given the proper conditions could approach even higher velocities.

As of now, it’s impossible for astronomers to detect a wandering planet due to their small size, distance, and rarity. By detecting the dimming of light levels from a hypervelocity star as an orbiting planet crosses its face, astronomers could detect planets that orbit said star.

Ginsburg added, “With one-in-two odds of seeing a transit, if a hypervelocity star had a planet, it makes a lot of sense to watch for them.”

Loeb concluded with, “Travel agencies advertising journeys on hypervelocity planets might appeal to particularly adventurous individuals.”

If you’d like to learn more about hypervelocity planets, you can access a draft version of the upcoming paper at: http://arxiv.org/abs/1201.1446

Source(s): Harvard-Smithsonian Center for Astrophysics , Hypervelocity Planets and Transits Around Hypervelocity Stars

Astronomers Witness a Web of Dark Matter

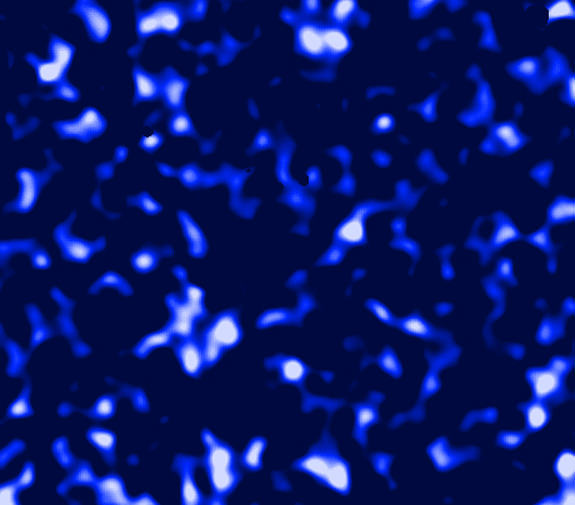
Dark matter in the Universe is distributed as a network of gigantic dense (white) and empty (dark) regions, where the largest white regions are about the size of several Earth moons on the sky. Credit: Van Waerbeke, Heymans, and CFHTLens collaboration.

[/caption]

We can’t see it, we can’t feel it, we can’t even interact with it… but dark matter may very well be one of the most fundamental physical components of our Universe. The sheer quantity of the stuff – whatever it is – is what physicists have suspected helps gives galaxies their mass, structure, and motion, and provides the “glue” that connects clusters of galaxies together in vast networks of cosmic webs.

Now, for the first time, this dark matter web has been directly observed.

An international team of astronomers, led by Dr. Catherine Heymans of the University of Edinburgh, Scotland, and Associate Professor Ludovic Van Waerbeke of the University of British Columbia, Vancouver, Canada, used data from the Canada-France-Hawaii Telescope Legacy Survey to map images of about 10 million galaxies and study how their light was bent by gravitational lensing caused by intervening dark matter.

Inside the dome of the Canada-France-Hawaii Telescope. (CFHT)

The images were gathered over a period of five years using CFHT’s 1×1-degree-field, 340-megapixel MegaCam. The galaxies observed in the survey are up to 6 billion light-years away… meaning their observed light was emitted when the Universe was only a little over half its present age.

The amount of distortion of the galaxies’ light provided the team with a visual map of a dark matter “web” spanning a billion light-years across.

“It is fascinating to be able to ‘see’ the dark matter using space-time distortion,” said Van Waerbeke. “It gives us privileged access to this mysterious mass in the Universe which cannot be observed otherwise. Knowing how dark matter is distributed is the very first step towards understanding its nature and how it fits within our current knowledge of physics.”

This is one giant leap toward unraveling the mystery of this massive-yet-invisible substance that pervades the Universe.

The densest regions of the dark matter cosmic web host massive clusters of galaxies. Credit: Van Waerbeke, Heymans, and CFHTLens collaboration.

“We hope that by mapping more dark matter than has been studied before, we are a step closer to understanding this material and its relationship with the galaxies in our Universe,” Dr. Heymans said.

The results were presented today at the American Astronomical Society meeting in Austin, Texas. Read the release here.

Guest Post: The Cosmic Energy Inventory

The Cosmic Energy Inventory chart by Markus Pössel. Click for larger version.

[/caption]

Now that the old year has drawn to a close, it’s traditional to take stock. And why not think big and take stock of everything there is?

Let’s base our inventory on energy. And as Einstein taught us that energy and mass are equivalent, that means automatically taking stock of all the mass that’s in the universe, as well – including all the different forms of matter we might be interested in.

Of course, since the universe might well be infinite in size, we can’t simply add up all the energy. What we’ll do instead is look at fractions: How much of the energy in the universe is in the form of planets? How much is in the form of stars? How much is plasma, or dark matter, or dark energy?


The chart above is a fairly detailed inventory of our universe. The numbers I’ve used are from the article The Cosmic Energy Inventory by Masataka Fukugita and Jim Peebles, published in 2004 in the Astrophysical Journal (vol. 616, p. 643ff.). The chart style is borrowed from Randall Munroe’s Radiation Dose Chart over at xkcd.

These fractions will have changed a lot over time, of course. Around 13.7 billion years ago, in the Big Bang phase, there would have been no stars at all. And the number of, say, neutron stars or stellar black holes will have grown continuously as more and more massive stars have ended their lives, producing these kinds of stellar remnants. For this chart, following Fukugita and Peebles, we’ll look at the present era. What is the current distribution of energy in the universe? Unsurprisingly, the values given in that article come with different uncertainties – after all, the authors are extrapolating to a pretty grand scale! The details can be found in Fukugita & Peebles’ article; for us, their most important conclusion is that the observational data and their theoretical bases are now indeed firm enough for an approximate, but differentiated and consistent picture of the cosmic inventory to emerge.

Let’s start with what’s closest to our own home. How much of the energy (equivalently, mass) is in the form of planets? As it turns out: not a lot. Based on extrapolations from what data we have about exoplanets (that is, planets orbiting stars other than the sun), just one part-per-million (1 ppm) of all energy is in the form of planets; in scientific notation: 10-6. Let’s take “1 ppm” as the basic unit for our first chart, and represent it by a small light-green square. (Fractions of 1 ppm will be represented by partially filled such squares.) Here is the first box (of three), listing planets and other contributions of about the same order of magnitude:

So what else is in that box? Other forms of condensed matter, mainly cosmic dust, account for 2.5 ppm, according to rough extrapolations based on observations within our home galaxy, the Milky Way. Among other things, this is the raw material for future planets!

For the next contribution, a jump in scale. To the best of our knowledge, pretty much every galaxy contains a supermassive black hole (SMBH) in its central region. Masses for these SMBHs vary between a hundred thousand times the mass of our Sun and several billion solar masses. Matter falling into such a black hole (and getting caught up, intermittently, in super-hot accretion disks swirling around the SMBHs) is responsible for some of the brightest phenomena in the universe: active galaxies, including ultra high-powered quasars. The contribution of matter caught up in SMBHs to our energy inventory is rather modest, though: about 4 ppm; possibly a bit more.

Who else is playing in the same league? The sum total of all electromagnetic radiation produced by stars and by active galaxies (to name the two most important sources) over the course of the last billions of years, to name one: 2 ppm. Also, neutrinos produced during supernova explosions (at the end of the life of massive stars), or in the formation of white dwarfs (remnants of lower-mass stars like our Sun), or simply as part of the ordinary fusion processes that power ordinary stars: 3.2 ppm all in all.

Then, there’s binding energy: If two components are bound together, you will need to invest energy in order to separate them. That’s why binding energy is negative – it’s an energy deficit you will need to overcome to pry the system’s components apart. Nuclear binding energy, from stars fusing together light elements to form heavier ones, accounts for -6.3 ppm in the present universe – and the total gravitational binding energy accumulated as stars, galaxies, galaxy clusters, other gravitationally bound objects and the large-scale structure of the universe have formed over the past 14 or so billion years, for an even larger -13.4 ppm. All in all, the negative contributions from binding energy more than cancel out all the positive contributions by planets, radiation, neutrinos etc. we’ve listed so far.

Which brings us to the next level. In order to visualize larger contributions, we need a change scale. In box 2, one square will represent a fraction of 1/20,000 or 0.00005. Put differently: Fifty of the little squares in the first box correspond to a single square in the second box:

So here, without further ado, is box 2 (including, in the upper right corner, a scale model of the first box):

Now we are in the realm of stars and related objects. By measuring the luminosity of galaxies, and using standard relations between the masses and luminosity of stars (“mass-to-light-ratio”), you can get a first estimate for the total mass (equivalently: energy) contained in stars. You’ll also need to use the empirical relation (“initial mass function”) for how this mass is distributed, though: How many massive stars should there be? How many lower-mass stars? Since different stars have different lifetimes (live massively, die young), this gives estimates for how many stars out there are still in the prime of life (“main sequence stars”) and how many have already died, leaving white dwarfs (from low-mass stars), neutron stars (from more massive stars) or stellar black holes (from even more massive stars) behind. The mass distribution also provides you with an estimate of how much mass there is in substellar objects such as brown dwarfs – objects which never had sufficient mass to make it to stardom in the first place.

Let’s start small with the neutron stars at 0.00005 (1 square, at our current scale) and the stellar black holes (0.00007). Interestingly, those are outweighed by brown dwarfs which, individually, have much less mass, but of which there are, apparently, really a lot (0.00014; this is typical of stellar mass distribution – lots of low-mass stars, much fewer massive ones.) Next come white dwarfs as the remnants of lower-mass stars like our Sun (0.00036). And then, much more than all the remnants or substellar objects combined, ordinary, main sequence stars like our Sun and its higher-mass and (mostly) lower-mass brethren (0.00205).

Interestingly enough, in this box, stars and related objects contribute about as much mass (or energy) as more undifferentiated types of matter: molecular gas (mostly hydrogen molecules, at 0.00016), hydrogen and helium atoms (HI and HeI, 0.00062) and, most notably, the plasma that fills the void between galaxies in large clusters (0.0018) add up to a whopping 0.00258. Stars, brown dwarfs and remnants add up to 0.00267.

Further contributions with about the same order of magnitude are survivors from our universe’s most distant past: The cosmic background radiation (CMB), remnant of the extremely hot radiation interacting with equally hot plasma in the big bang phase, contributes 0.00005; the lesser-known cosmic neutrino background, another remnant of that early equilibrium, contributes a remarkable 0.0013. The binding energy from the first primordial fusion events (formation of light elements within those famous “first three minutes”) gives another contribution in this range: -0.00008.

While, in the previous box, the matter we love, know and need was not dominant, it at least made a dent. This changes when we move on to box 3. In this box, one square corresponds to 0.005. In other words: 100 squares from box 2 add up to a single square in box 3:

Box 3 is the last box of our chart. Again, a scale model of box 2 is added for comparison: All that’s in box 2 corresponds to one-square-and-a-bit in box 3.
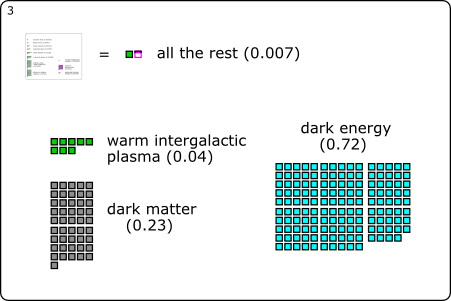
The first new contribution: warm intergalactic plasma. Its presence is deduced from the overall amount of ordinary matter (which follows from measurements of the cosmic background radiation, combined with data from surveys and measurements of the abundances of light elements) as compared with the ordinary matter that has actually been detected (as plasma, stars, e.g.). From models of large-scale structure formation, it follows that this missing matter should come in the shape (non-shape?) of a diffuse plasma, which isn’t dense (or hot) enough to allow for direct detection. This cosmic filler substance amounts to 0.04, or 85% of ordinary matter, showing just how much of a fringe phenomena those astronomical objects we usually hear and read about really are.

The final two (dominant) contributions come as no surprise for anyone keeping up with basic cosmology: dark matter at 23% is, according to simulations, the backbone of cosmic large-scale structure, with ordinary matter no more than icing on the cake. Last but not least, there’s dark energy with its contribution of 72%, responsible both for the cosmos’ accelerated expansion and for the 2011 physics Nobel Prize.

Minority inhabitants of a part-per-million type of object made of non-standard cosmic matter – that’s us. But at the same time, we are a species, that, its cosmic fringe position notwithstanding, has made remarkable strides in unravelling the big picture – including the cosmic inventory represented in this chart.

__________________________________________

Here is the full chart for you to download: the PNG version (1200×900 px, 233 kB) or the lovingly hand-crafted SVG version (29 kB).

The chart “The Cosmic Energy Inventory” is licensed under Creative Commons BY-NC-SA 3.0. In short: You’re free to use it non-commercially; you must add the proper credit line “Markus Pössel [www.haus-der-astronomie.de]”; if you adapt the work, the result must be available under this or a similar license.

Technical notes: As is common in astrophysics, Fukugita and Peebles give densities as fractions of the so-called critical density; in the usual cosmological models, that density, evaluated at any given time (in this case: the present), is critical for determining the geometry of the universe. Using very precise measurements of the cosmic background radiation, we know that the average density of the universe is indistinguishable from the critical density. For simplicity’s sake, I’m skipping this detour in the main text and quoting all of F & P’s numbers as “fractions of the universe’s total energy (density)”.

For the supermassive black hole contributions, I’ve neglected the fraction ?n in F & P’s article; that’s why I’m quoting a lower limit only. The real number could theoretically be twice the quoted value; it’s apparently more likely to be close to the value given here, though. For my gravitational binding energy, I’ve added F & P’s primeval gravitational binding energy (no. 4 in their list) and their binding energy from dissipative gravitational settling (no. 5).

The fact that the content of box 3 adds up not quite to 1, but to 0.997, is an artefact of rounding not quite consistently when going from box 2 to box 3. I wanted to keep the sum of all that’s in box 2 at the precision level of that box.
Quadruply Lensed Dwarf Galaxy 12.8 Billion Light Years Away

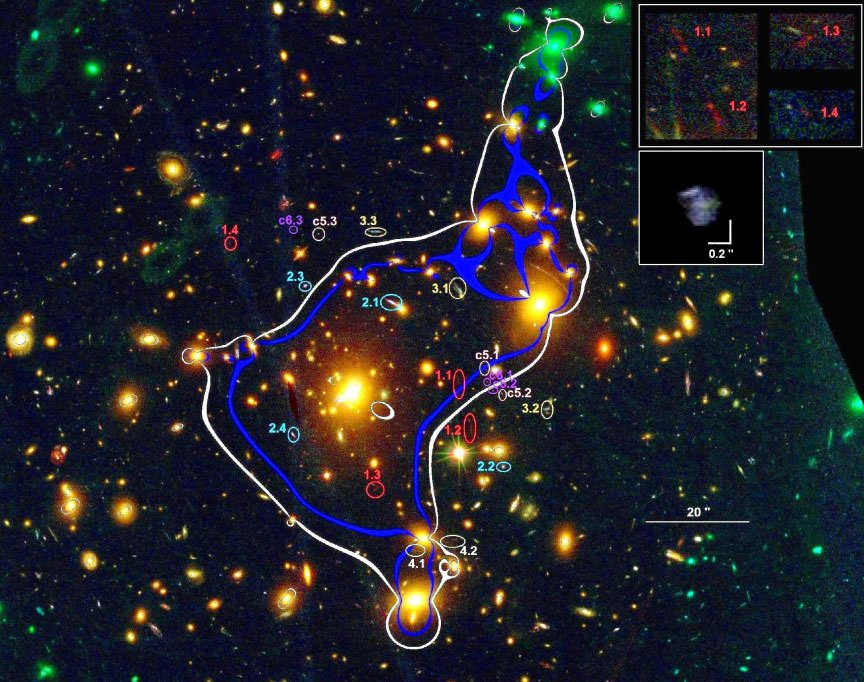
Galaxy Cluster MACS J0329.6-0211 lenses several background galaxies including a distant dwarf galaxy. CREDIT: A. Zitrin, et al.

[/caption]

Gravitational lensing is a powerful tool for astronomers that allows them to explore distant galaxies in far more detail than would otherwise be allowed. Without this technique, galaxies at the edge of the visible universe are little more than tiny blobs of light, but when magnified dozens of times by foreground clusters, astronomers are able to explore the internal structural properties more directly.

Recently, astronomers at the University of Heidelberg discovered a gravitational lensed galaxy that ranked among the most distant ever seen. Although there’s a few that beat this one out in distance, this one is remarkable for being a rare quadruple lens.

The images for this remarkable discovery were taken using the Hubble Space Telescope in August and October of this year, using a total of 16 different colored filters as well as additional data from the Spitzer infrared telescope. The foreground cluster, MACS J0329.6-0211, is some 4.6 billion light years distant. In the above image, the background galaxy has been split into four images, labelled by the red ovals and marked as 1.1 – 1.4. They are enlarged in the upper right.

Assuming that the mass of the foreground cluster is concentrated around the galaxies that were visible, the team attempted to reverse the effects the cluster would have on the distant galaxy, which would reverse the distortions. The restored image, also corrected for redshift, is shown in the lower box in the upper right corner.

After correcting for these distortions, the team estimated that the total mass of the distant galaxy is only a few billion times the mass of the Sun. In comparison, the Large Magellanic Cloud, a dwarf satellite to our own galaxy, is roughly ten billion solar masses. The overall size of the galaxy was determined to be small as well. These conclusions fit well with expectations of galaxies in the early universe which predict that the large galaxies in today’s universe were built from the combination of many smaller galaxies like this one in the distant past.

The galaxy also conforms to expectations regarding the amount of heavy elements which is significantly lower than stars like the Sun. This lack of heavy elements means that there should be little in the way of dust grains. Such dust tends to be a strong block of shorter wavelengths of light such as ultraviolet and blue. Its absence helps give the galaxy its blue tint.

Star formation is also high in the galaxy. The rate at which they predict new stars are being born is somewhat higher than in other galaxies discovered around the same distance, but the presence of brighter clumps in the restored image suggest the galaxy may be undergoing some interactions, driving the formation of new stars.

TV Viewing Alert: New Mini-Series: Fabric of the Cosmos

A new 4-part mini-series debuts tonight on PBS station in the US, featuring theoretical physicist Brian Greene. The series is called “Fabric of the Cosmos” and is based on Greene’s 2004 book of the same name. It premieres tonight (Nov. 2, 2011) on NOVA, with subsequent episodes airing November 9, 16 and 23. The series will probe the most extreme realms of the cosmos, from black holes to dark matter, to time bending and parallel realities.

Check your local listings for time.

Guest Post by Author Peter Shaver: Cosmic Time Scales

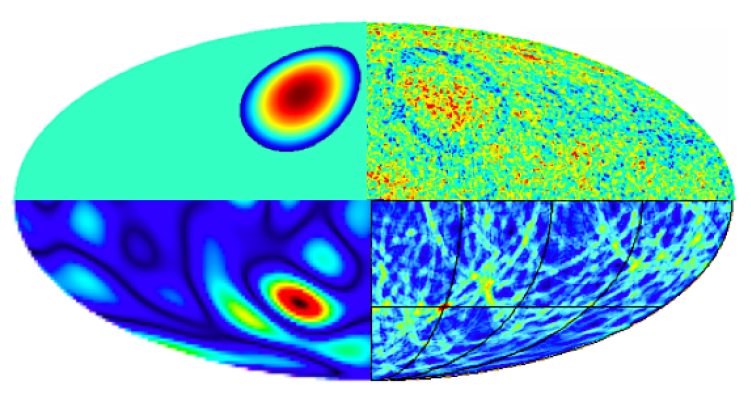
This single all-sky image, captured by the Planck telescope, simultaneously captured two snapshots that straddle virtually the entire 13.7 billion year history of the universe. Credit: ESA

[/caption]

Editor’s note: Peter Shaver is the author of the new book “Cosmic Heritage – Evolution from the Big Bang to Conscious Life.” Find out here how you can win a copy!

The universe has gone through a number of distinct phases. The first part of the first second is speculative, but the physics of the latter part is well know to us. In the first several minutes the lightest elements (hydrogen and helium) were formed.

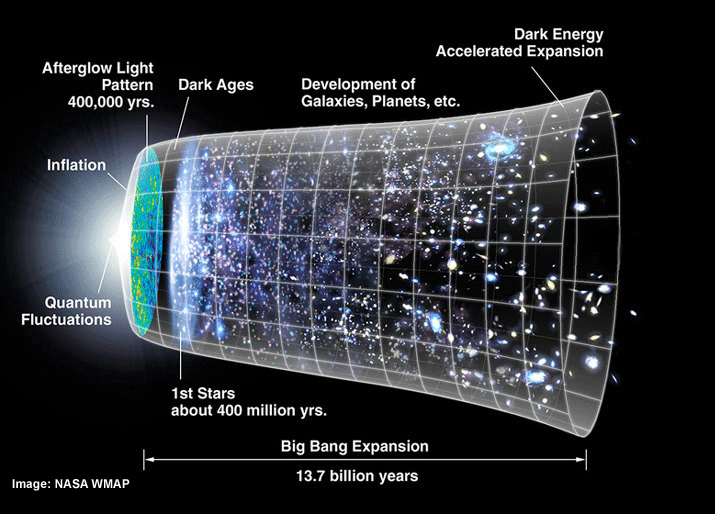
Over the next 380,000 years the universe was a hot (but always cooling) plasma of electrons, nuclei and photons. At 380,000 years it was cool enough for electrons and nuclei to combine into atoms, in a process called recombination. The photons were freed from the plasma, and the universe became transparent for the first time. As the universe was opaque before recombination and transparent after, we see this epoch as a ‘wall’, and it is known as the cosmic microwave background.

What followed was a period known as the ‘cosmic dark ages’. The only light was that of the fading afterglow of the Big Bang, and the matter was comprised of the primordial elements and the exotic ‘dark matter’. During this time gravitational accretion slowly but surely produced larger and larger concentrations of matter, and when these became sufficiently dense, nuclear reactions could form and the first stars and galaxies were born. These lit up and ionized the universe again, some 400-500 million years after the Big Bang, in what is known as the ‘reionization epoch’.

The activity increased exponentially, culminating in the ‘quasar epoch’ 2-4 billion years after the Big Bang, a frenetic period of chaotic star and galaxy formation, galaxy interactions, monster quasars and radio galaxies. This activity eventually began to drop off, although it still continues today; the incidence of quasars today is a thousand times less than it was at the peak of the quasar epoch. At 13.7 billion years, the universe has now reached a ‘dignified middle age’.

The ‘heavy elements’ such as carbon and oxygen, essential for life as we know it, are all produced in stars, and this process has been going on ever since the first stars formed. Each generation of stars ejects more heavy elements into the intergalactic medium, so the abundances of the heavy elements have been built up over time.

By the time the Sun and Earth were formed 4.6 billion years ago, over 8.4 billion years of star and planet formation had already taken place in the universe. Star formation still takes place today, so in total there have been over 13 billion years of star and planet formation.

Zooming in now to our planet, life started not long after the Earth itself formed, sometime between 3.8 and 3.5 billion years ago (bya). But for almost half the age of the Earth, the only forms of life were microorganisms such as bacteria. More complex life forms started to appear about 1-2 bya. Invertebrates, which appeared some 600 million years ago (mya), were the earliest multicellular life forms, and vertebrates appeared about 500 mya. Life invaded the land about 400 mya. The dinosaurs dominated from 240 mya until their extinction 66 mya, and then mammals gradually took over. Many species came and went. Our closest living relatives are the chimpanzees, which split off from our ancestral line 5-6 mya; our more recent relatives have all become extinct.

It is amazing to think how recently humans appeared on the cosmic scene. Our species only appeared about 200,000 years ago, our ancestors emerged out of Africa just 50,000 years ago, agriculture started 10,000 years ago, and we have had modern technology for only the last 100 years or so! We are newcomers to the universe.

We now know that there are planets orbiting other stars like our Sun, probably billions of them in our galaxy alone, and billions more in the billions of other galaxies. Given the huge timescale of the universe, any life on those planets is bound to be millions or billions of years more or less advanced than life on Earth. If it is less advanced, it would certainly not be able to communicate with us. If it is more advanced, its technology would probably be totally unrecognisable to us. Nevertheless, we are probably not alone in the universe.

Of course the timescales discussed above only cover the ‘conventional’ universe from the Big Bang to now. If there was a ‘preexisting’ multiverse, we have no idea how far back any ‘before’ may extend. And as the expansion of the universe is accelerating, the future of the universe may be very long indeed: trillions upon trillions of years.

Peter Shaver obtained a PhD in astrophysics at the University of Sydney in Australia, and spent most of his career as a senior scientist at the European Southern Observatory (ESO), based in Munich. He has authored or co-authored over 250 scientific papers, and edited six books on astronomy and astrophysics.

Abuse From Other Universes – A Second Opinion

Concentric circles interpreted as bruises from collisions with alternate universes. Image Credit: Feeney et al.

[/caption]

At the end of last year, there was a flurry of activity from astronomers Gurzadyan and Penrose that considered the evidence of alternate universes or the existence of a universe prior to the Big Bang and suggested that such evidence may be imprinted on the cosmic microwave background as bruises of concentric circles. Quickly, this was followed by an announcement claiming to find just such circles. Of course, with an announcement this big, the statistical significance would need to be confirmed. A recent paper in the October issue of the Astrophysical Journal provides a second opinion.

The review was conducted by Amir Hajian at the Canadian Institute for Theoretical Astrophysics. To conduct the study, Hajian selected a large number of circles, similar to the ones reported in the previous studies and asked what the probability was that, randomly, the “edge” of the circles would contain hot-spots, similar to the ones predicted. These were then compared to the bruises reported by the other teams by examining their “variance” which is how much the points on the perimeter were spread around the average temperature.

Hajian notes that, with the resolution considered it would be possible to consider some 5 million circles. The results of his comparison demonstrated that it would be expected that some 0.3% of those should have features similar to the ones reported previously. With so many possibilities, this would imply that some 15,000 potential circles could be flagged as candidates for these cosmic bruises. Even the “best” candidate proposed in the Gurzadyan and Penrose study should still exist statistically.

As such, Hajian concludes that the features Gurzadyan and Penrose reported were not statistically anomalous. Hajian does not comment directly on Feeney et al.’s detection, but given theirs were constructed in a similar manner, it should be expected that they are similarly statistically insignificant. It would appear that if the fingerprints of other universes are embedded in the sky, they have been lost in the noise.

Accelerating Expansion of Universe Discovery Wins 2011 Nobel Prize in Physics

The accelerating, expanding Universe. Credit: NASA/WMAP

[/caption]

Three scientists shared the 2011 Nobel Prize for physics for the discovery that the expansion of the universe is speeding up, the Nobel prize committee announced today. Half of the $1.5 million prize went to American Saul Perlmutter and the rest to two members of a second team which conducted similar work: American Adam Riess and U.S.-born Brian Schmidt, who is based in Australia. All three made the discovery through observations of distant supernovae.

Perlmutter is from the Lawrence Berkeley National Laboratory and University of California, Berkeley, and worked on the Supernova Cosmology Project. Schmidt is from the Australian National University and Riess is from the Johns Hopkins University and Space Telescope Science Institute, Baltimore. They worked together on the High-z Supernova Search Team.

In response to the announcement, Professor Sir Peter Knight, President of the Institute of Physics, said, “The recipients of today’s award are at the frontier of modern astrophysics and have triggered an enormous amount of research on dark energy.

“These researchers have opened our eyes to the true nature of our Universe. They are very well-deserved recipients.”

Source: IOP

New Simulation Shows How the Universe Evolved

Bolshoi Simulation

How has the universe evolved over time? A new supercomputer simulation has provided what scientists say is the most accurate and detailed large cosmological model of the evolution of the large-scale structure of the universe. Called the Bolshoi simulation, and it gives physicists and astronomers a powerful new tool for understanding cosmic mysteries such as galaxy formation, dark matter, and dark energy.

If the simulation is right, it is showing that the standard cosmological model is fairly spot-on.
Continue reading “New Simulation Shows How the Universe Evolved”