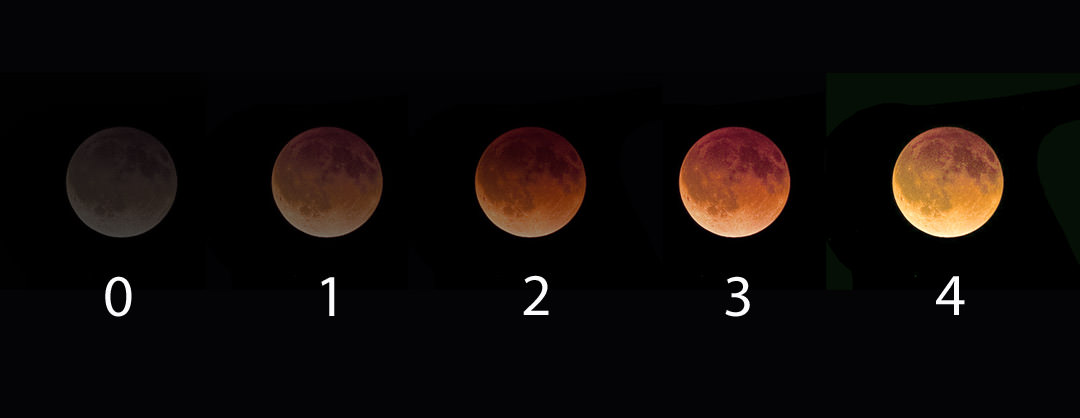
There are many ways to enjoy tomorrow night’s total lunar eclipse. First and foremost is to sit back and take in the slow splendor of the Moon entering and exiting Earth’s colorful shadow. You can also make pictures, observe it in a telescope or participate in a fun science project by eyeballing the Moon’s brightness and color. French astronomer Andre Danjon came up with a five-point scale back in the 1920s to characterize the appearance of the Moon during totality. The Danjon Scale couldn’t be simpler with just five “L values” from 0 to 4:
L=0: Very dark eclipse. Moon almost invisible, especially at mid-totality.
L=1: Dark Eclipse, gray or brownish in coloration. Details distinguishable only with difficulty.
L=2: Deep red or rust-colored eclipse. Very dark central shadow, while outer edge of umbra is relatively bright.
L=3: Brick-red eclipse. Umbral shadow usually has a bright or yellow rim.
L=4: Very bright copper-red or orange eclipse. Umbral shadow has a bluish, very bright rim.
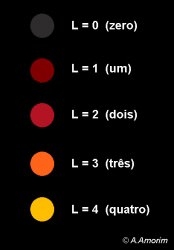
The last few lunar eclipses have been bright with L values of 2 and 3. We won’t know how bright totality will be during the September 27-28 eclipse until we get there, but chances are it will be on the bright side. That’s where you come in. Brazilian amateur astronomers Alexandre Amorim and Helio Carvalho have worked together to create a downloadable Danjonmeter to make your own estimate. Just click the link with your cellphone or other device and it will instantly pop up on your screen.
On the night of the eclipse, hold the phone right up next to the moon during mid-eclipse and estimate its “L” value with your naked eye. Send that number and time of observation to Dr. Richard Keen at [email protected]. For the sake of consistency with Danjon estimates made before mobile phones took over the planet, also compare the moon’s color with the written descriptions above before sending your final estimate.
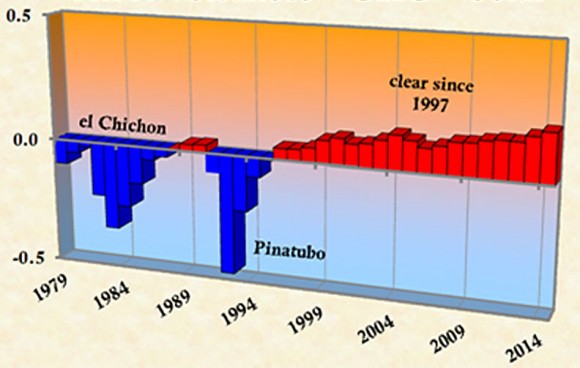
Keen, an emeritus professor at the University of Colorado-Boulder Department of Atmospheric and Oceanic Sciences, has long studied how volcanic eruptions affect both the color of the eclipsed moon and the rate of global warming. Every eclipse presents another opportunity to gauge the current state of the atmosphere and in particular the dustiness of the stratosphere, the layer of air immediately above the ground-hugging troposphere. Much of the sunlight bent into Earth’s shadow cone (umbra) gets filtered through the stratosphere.

Volcanoes pump sulfur compounds and ash high into the atmosphere and sully the otherwise clean stratosphere with volcanic aerosols. These absorb both light and solar energy, a major reason why eclipses occurring after a major volcanic eruption can be exceptionally dark with L values of “0” and “1”.
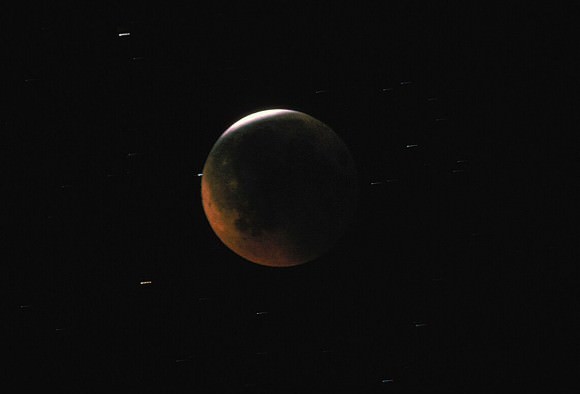
One of the darkest in recent times occurred on December 30, 1982 after the spectacular spring eruption of Mexico’s El Chichon that hurled some 7 to 10 million tons of ash into the atmosphere. Sulfurous soot circulated the globe for weeks, absorbing sunlight and warming the stratosphere by 7°F (4°C).

Meanwhile, less sunlight reaching the Earth’s surface caused the northern hemisphere to cool by 0.4-0.6°C. The moon grew so ashen-black during totality that if you didn’t know where to look, you’d miss it.
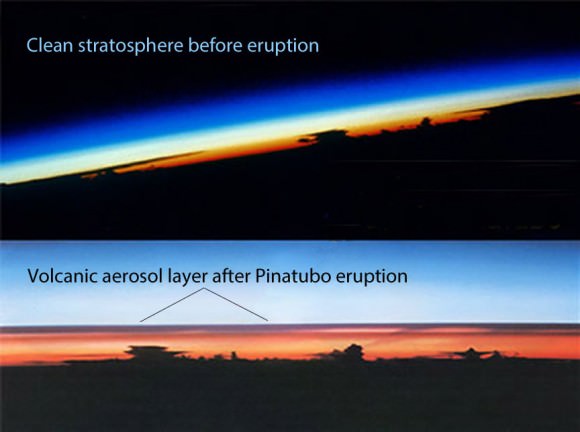
Keen’s research focuses on how the clean, relatively dust-free stratosphere of recent years may be related to a rise in the rate of global warming compared to volcano-induced declines prior to 1996. Your simple observation will provide one more data point toward a better understanding of atmospheric processes and how they relate to climate change.
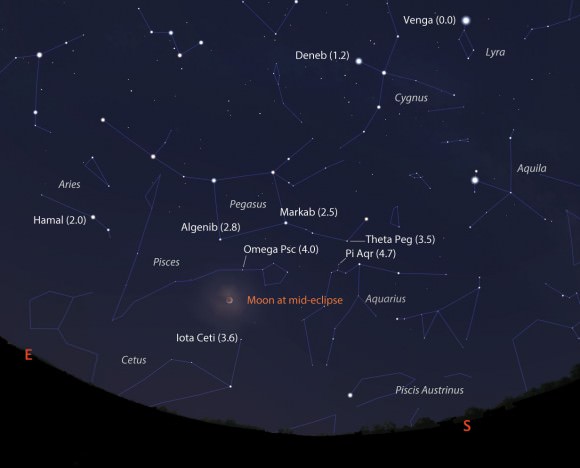
If you’d like to do a little more science during the eclipse, Keen suggests examining the moon’s color just after the beginning and before the end of totality to determine an ‘L’ value for the outer umbra. You can also determine the moon’s overall brightness or magnitude at mid-eclipse by comparing it to stars of known magnitude. The best way to do that is to reduce the moon down to approximately star-size by looking at it through the wrong end of a pair of 7-10x binoculars and compare it to the unreduced naked eye stars. Use this link for details on how it’s done along with the map I’ve created that has key stars and their magnitudes.
The table below includes eclipse events for four different time zones with emphasis on mid-eclipse, the time to make your observation. Good luck on Sunday’s science project and thanks for your participation!
| Eclipse Events | Eastern Daylight Time (EDT) | Central Daylight Time (CDT) | Mountain Daylight Time (MDT) | Pacific Daylight Time (PDT) |
| Penumbra first visible | 8:45 p.m. | 7:45 p.m. | 6:45 p.m. | 5:45 p.m. |
| Partial eclipse begins | 9:07 p.m. | 8:07 p.m. | 7:07 p.m. | 6:07 p.m. |
| Total eclipse begins | 10:11 p.m. | 9:11 p.m. | 8:11 p.m. | 7:11 p.m. |
| Mid-eclipse | 10:48 p.m. | 9:48 p.m. | 8:48 p.m. | 7:48 p.m. |
| Total eclipse ends | 11:23 p.m. | 10:23 p.m. | 9:23 p.m. | 8:23 p.m. |
| Partial eclipse ends | 12:27 a.m. | 11:27 p.m. | 10:27 p.m. | 9:27 p.m. |
| Penumbra last visible | 12:45 a.m. | 11:45 p.m. | 10:45 p.m. | 9:45 p.m. |

