Euclid and the Geometry of the Dark Universe

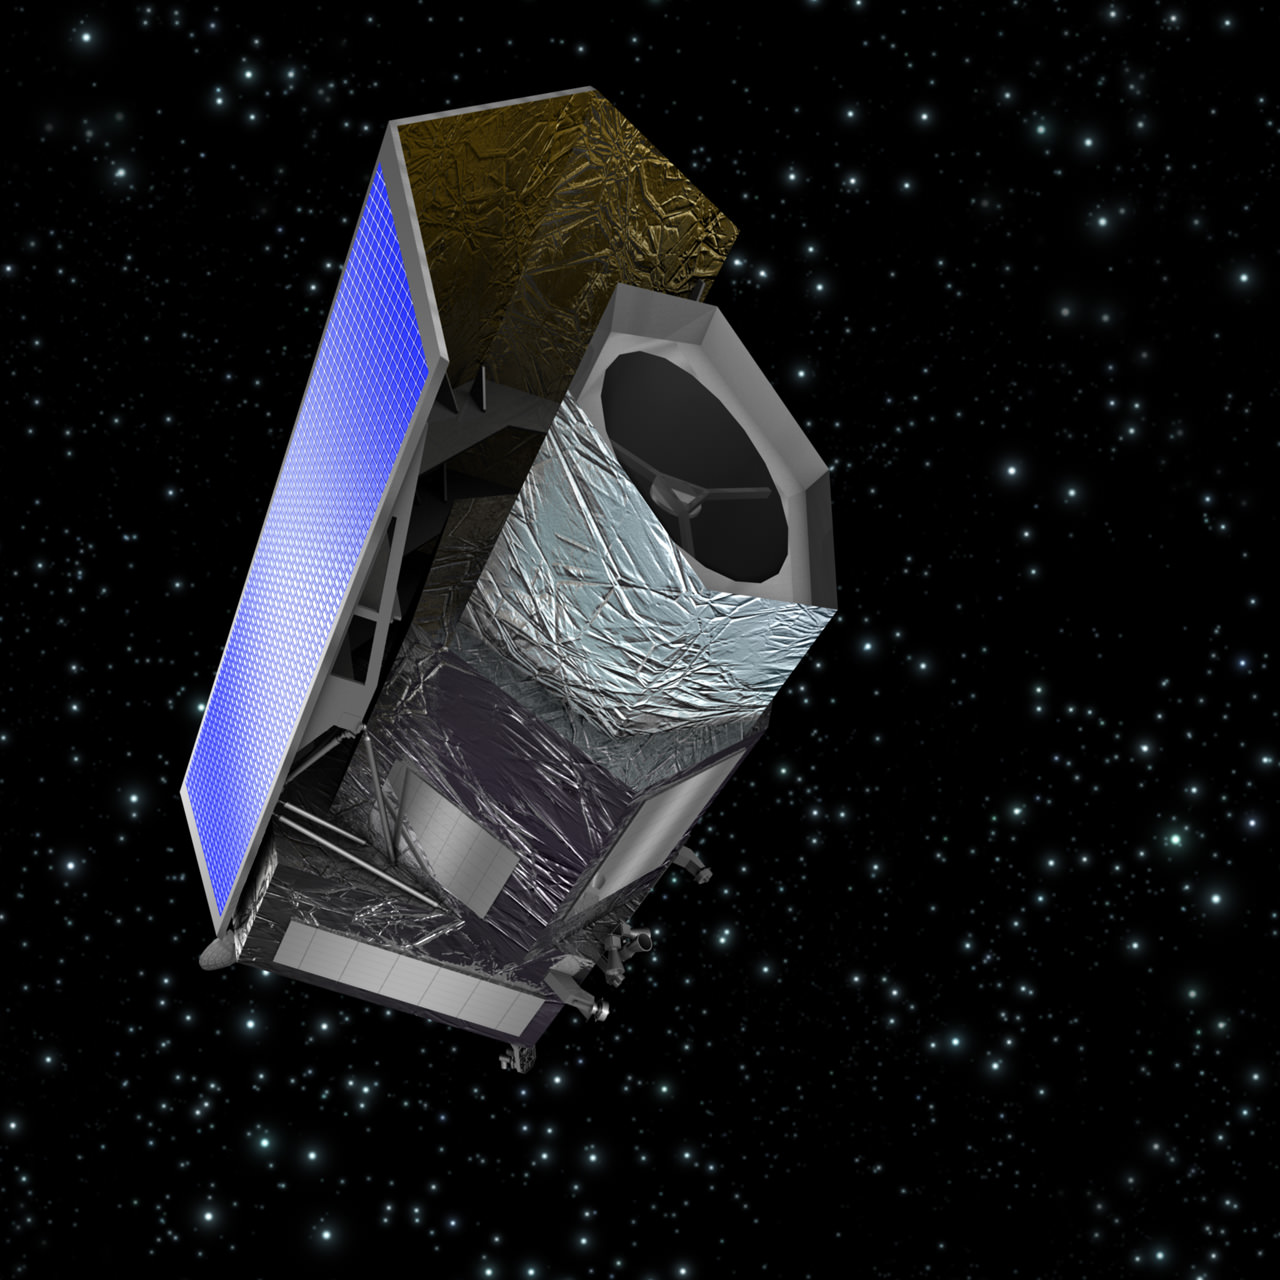
Artist’s impression of Euclid Credit: ESA/C. Carreau

Euclid, an exciting new mission to map the geometry, distribution and evolution of dark energy and dark matter has just been formally adopted by ESA as part of their Cosmic Vision 2015-2025 progamme. Named after Euclid of Alexandria, the “Father of Geometry”, it will accurately measure the accelerated expansion of the Universe, bringing together one of the largest collaborations of astronomers, engineers and scientists in an attempt to answer one of the most important questions in cosmology: why is the expansion of the Universe accelerating, instead of slowing down due to the gravitational attraction of all the matter it contains?

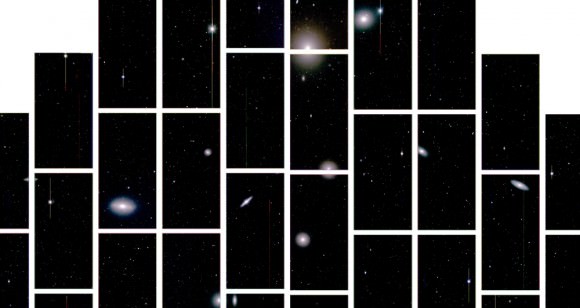
In 2007 the Hubble Space Telescope produced a 3D map of dark matter that covered just over 2 square degrees of sky, while in March this year the Baryon Oscillation Spectroscopic Survey (BOSS) measured the precise distance to just over a quarter of a million galaxies. Working in the visible and near-infrared wavelengths, Euclid will precisely measure around two billion galaxies and galaxy clusters in 3 dimensions in a wide extragalactic survey covering 15,000 square degrees (over a third of the sky) plus a deep survey out to redshifts of ~2, covering an area of 40 square degrees, the 3-D galaxy maps produced will trace dark energy’s influence over 10 billion years of cosmic history, covering the period when dark energy accelerated the expansion of the Universe.

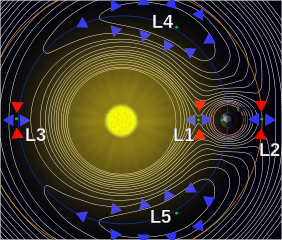
The mission was selected last October but now that it has been formally adopted by ESA, invitations to tender will be released, with Astrium and Thales Alenia Space, Europe’s two main space companies expected to bid. Hoping to launch in 2020, Euclid will involve contributions from 11 European space agencies as well as NASA while nearly 1,000 scientists from 100 institutes form the Euclid Consortium building the instruments and participating in the scientific harvest of the mission. It is expected to cost around 800m euros ($1,000m £640m) to build, equip, launch and operate over its nominal 6 year mission lifetime, where it will orbit the second Sun-Earth Lagrange point (L2 in the image below) It will have a mass of around 2100 kg, and measure about 4.5 metres tall by 3.1 metres. It will carry a 1.2 m Korsch telescope, a near infrared camera/spectrometer and one of the largest optical digital cameras ever flown in space.

Sun Earth Lagrange Points Credit: Xander89 via Wikimedia Commons

Dark matter represents 20% of the universe and dark energy 76%. Euclid will use two techniques to map the dark matter and measure dark energy. Weak gravitational lensing measures the distortions of light from distant galaxies due to the mass of dark matter, this requires extremely high image quality to suppress or calibrate-out image distortions in order to measure the true distortions by gravity. Euclid’s camera will produce images 100 times larger than those produced by Hubble, minimizing the need to stitch images together. Baryonic acoustic oscillations, wiggle patterns, imprinted in the clustering of galaxies, will provide a standard ruler to measure dark energy and the expansion in the Universe. This involves the determination of the redshifts of galaxies to better than 0.1%. It is also hoped that later in the mission, supernovas may be used as markers to measure the expansion rate of the Universe.

Find out more about Euclid and other Cosmic Vision missions at ESA Science

Lead image caption: Artist’s-impression-of-Euclid-Credit-ESA-C.-Carreau

Second image caption: Sun Earth Lagrange Points Credit: Xander89 via Wikimedia Commons

Polar Telescope Casts New Light On Dark Energy And Neutrino Mass

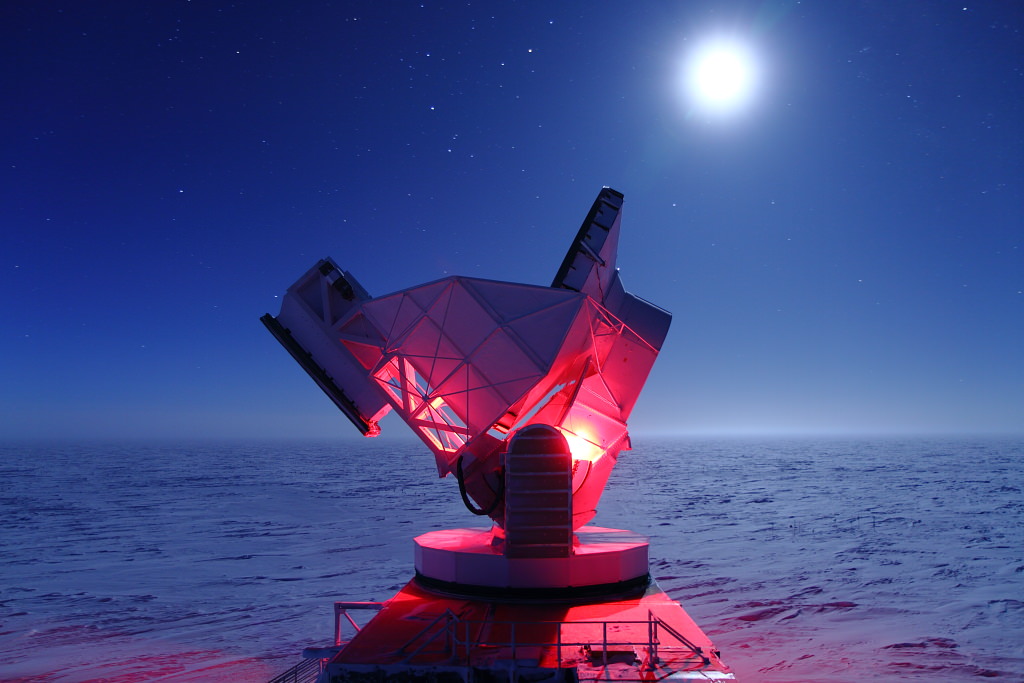
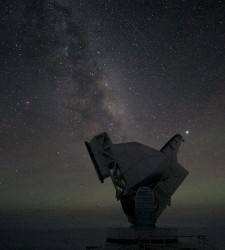
The 10-meter South Pole Telescope in Antarctica at the Amundsen-Scott Station. (Daniel Luong-Van, National Science Foundation)

[/caption]

Located at the southermost point on Earth, the 280-ton, 10-meter-wide South Pole Telescope has helped astronomers unravel the nature of dark energy and zero in on the actual mass of neutrinos — elusive subatomic particles that pervade the Universe and, until very recently, were thought to be entirely without measureable mass.

The NSF-funded South Pole Telescope (SPT) is specifically designed to study the secrets of dark energy, the force that purportedly drives the incessant (and apparently still accelerating) expansion of the Universe. Its millimeter-wave observation abilities allow scientists to study the Cosmic Microwave Background (CMB) which pervades the night sky with the 14-billion-year-old echo of the Big Bang.

Overlaid upon the imprint of the CMB are the silhouettes of distant galaxy clusters — some of the most massive structures to form within the Universe. By locating these clusters and mapping their movements with the SPT, researchers can see how dark energy — and neutrinos — interact with them.

“Neutrinos are amongst the most abundant particles in the universe,” said Bradford Benson, an experimental cosmologist at the University of Chicago’s Kavli Institute for Cosmological Physics. “About one trillion neutrinos pass through us each second, though you would hardly notice them because they rarely interact with ‘normal’ matter.”

If neutrinos were particularly massive, they would have an effect on the large-scale galaxy clusters observed with the SPT. If they had no mass, there would be no effect.

The SPT collaboration team’s results, however, fall somewhere in between.

Even though only 100 of the 500 clusters identified so far have been surveyed, the team has been able to place a reasonably reliable preliminary upper limit on the mass of neutrinos — again, particles that had once been assumed to have no mass.

Previous tests have also assigned a lower limit to the mass of neutrinos, thus narrowing the anticipated mass of the subatomic particles to between 0.05 – 0.28 eV (electron volts). Once the SPT survey is completed, the team expects to have an even more confident result of the particles’ masses.

“With the full SPT data set we will be able to place extremely tight constraints on dark energy and possibly determine the mass of the neutrinos,” said Benson.

“We should be very close to the level of accuracy needed to detect the neutrino masses,” he noted later in an email to Universe Today.

The South Pole Telescope's unique position allows it to watch the night sky for months on end. (NSF)

Such precise measurements would not have been possible without the South Pole Telescope, which has the ability due to its unique location to observe a dark sky for very long periods of time. Antarctica also offers SPT a stable atmosphere, as well as very low levels of water vapor that might otherwise absorb faint millimeter-wavelength signals.

“The South Pole Telescope has proven to be a crown jewel of astrophysical research carried out by NSF in the Antarctic,” said Vladimir Papitashvili, Antarctic Astrophysics and Geospace Sciences program director at NSF’s Office of Polar Programs. “It has produced about two dozen peer-reviewed science publications since the telescope received its ‘first light’ on Feb. 17, 2007. SPT is a very focused, well-managed and amazing project.”

The team’s findings were presented by Bradford Benson at the American Physical Society meeting in Atlanta on April 1.

Read more on the NSF press release here.

GALEX Mission Comes to an End

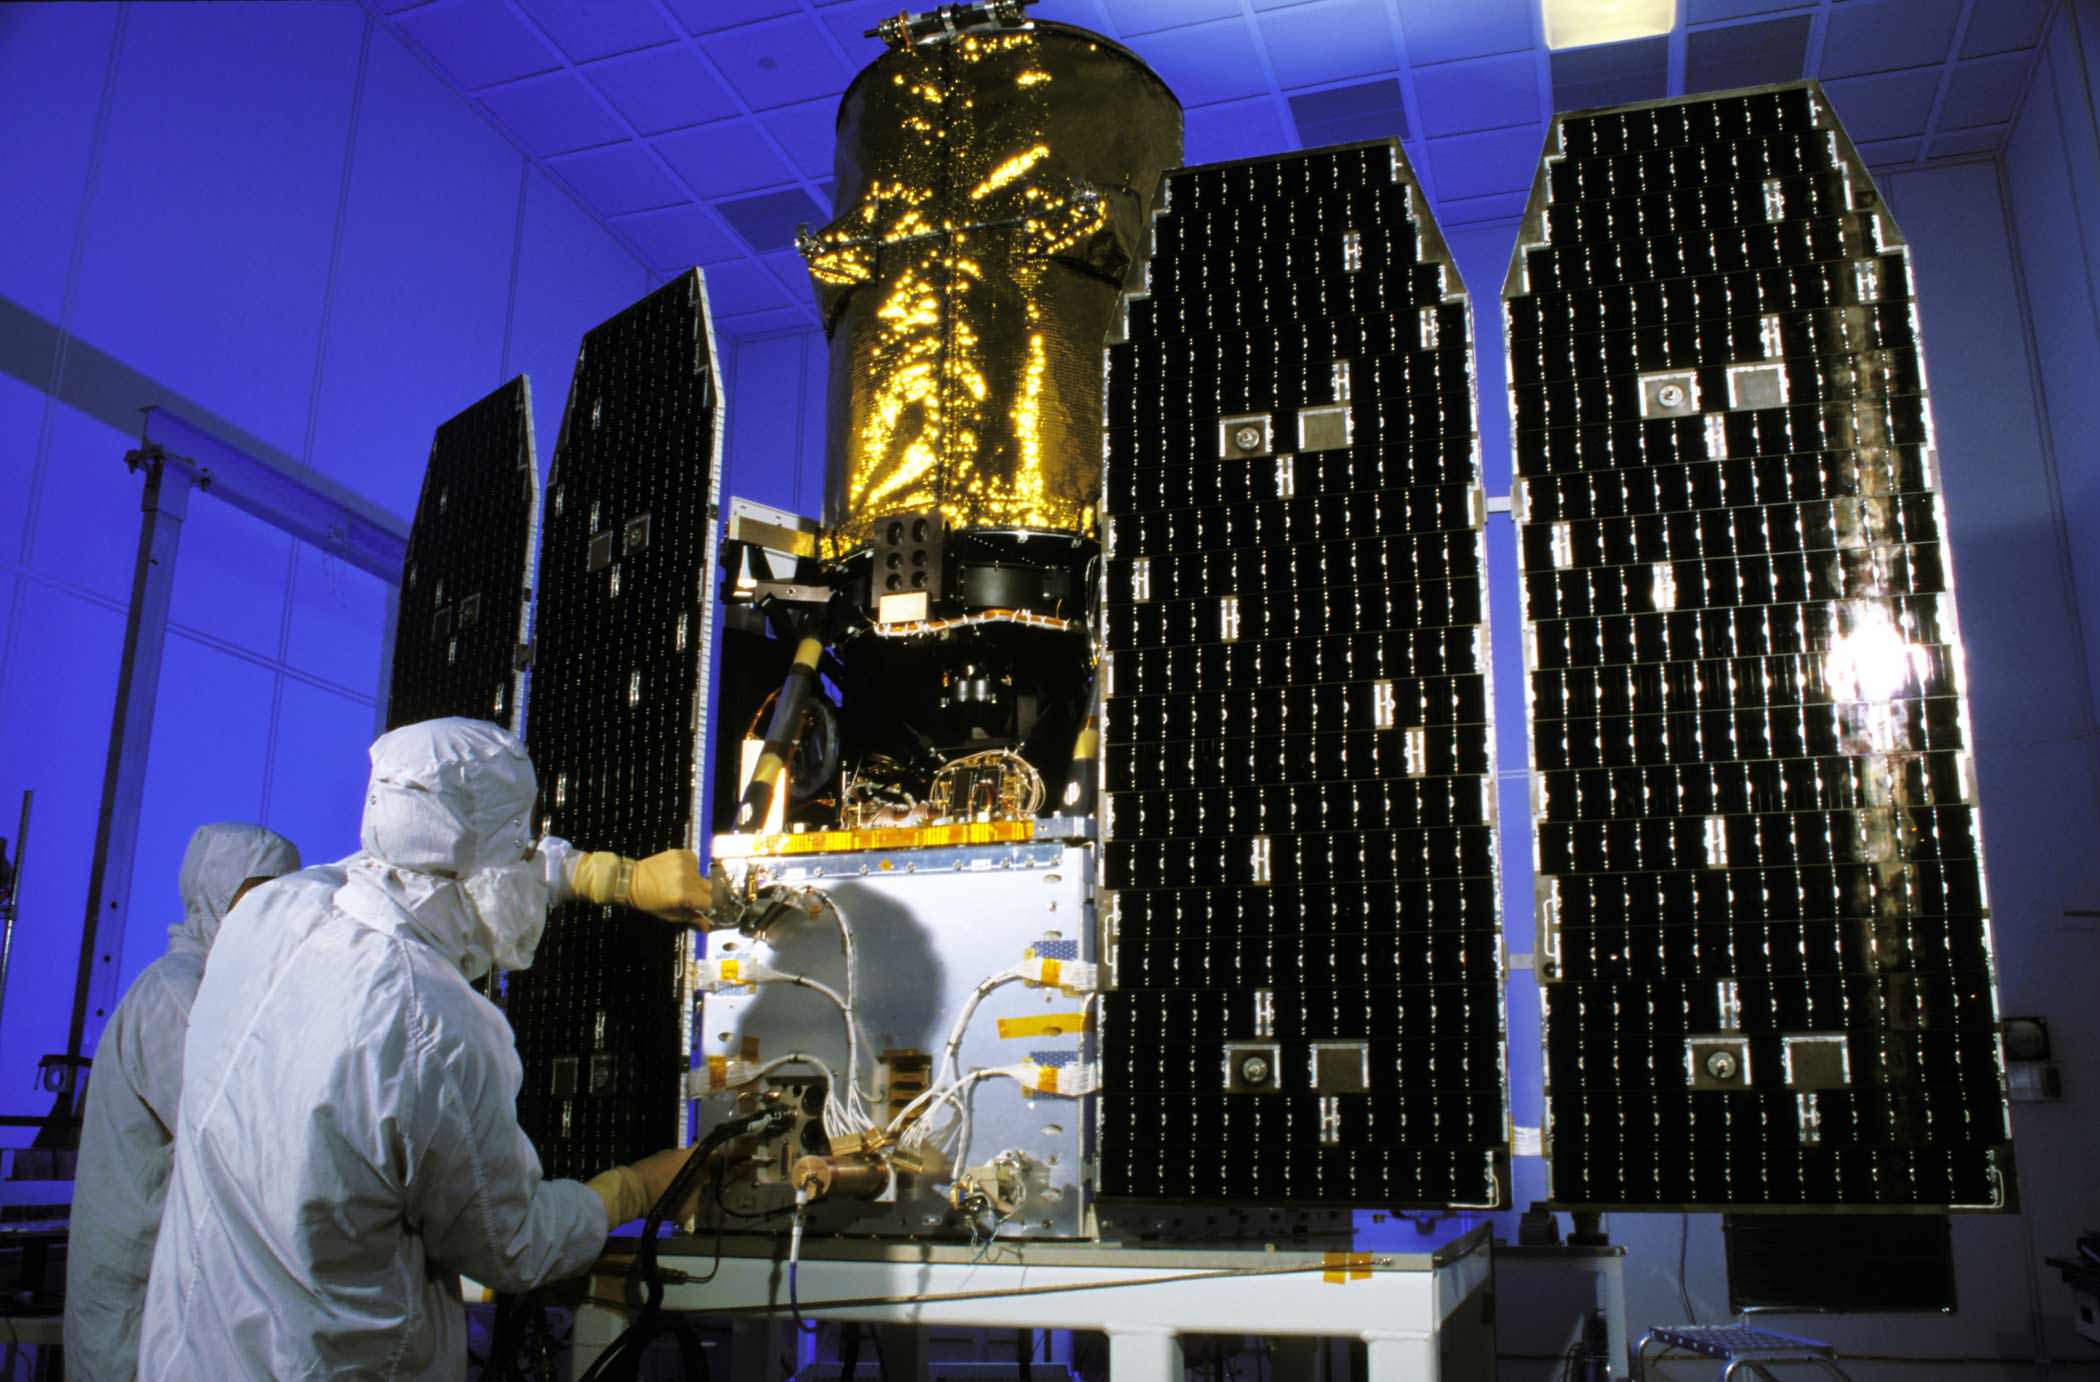
The GALEX spacecraft before its launch in 2003. Credit: JPL

[/caption]

A mission which helped map the ultraviolet sky and worked to confirm the nature of dark energy is coming to an end. Galaxy Evolution Explorer, or GALEX, was placed in standby mode today after nearly nine years of service and will be decommissioned later this year. With data from the mission, scientists were able to catalog millions of galaxies spanning 10 billion years of cosmic time.

The Galaxy Evolution Explorer launched in April of 2003 on board a Pegasus XL rocket. It completed its prime mission in the fall of 2007, but the mission was extended to continue its census of stars and galaxies.

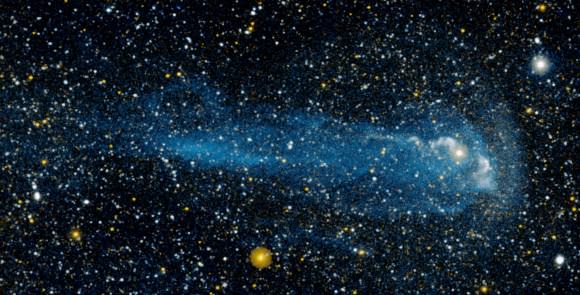
The variable star Mira. Image credit: Galex

Other mission highlights include the discovery of a gigantic comet-like tail behind a speeding star, finding rings of new stars around old galaxies, exploring “teenager” galaxies, which help to explain how galaxies evolve, and catching a black hole devouring a star.
The mission was part of NASA’s Explorer’s program and was built and managed by the Jet Propulsion Laboratory. Scientists from around the world participated in GALEX studies.

For a complete list of discoveries by GALEX, see this JPL webpage.

Supernova Primo – Out To Far Frontiers

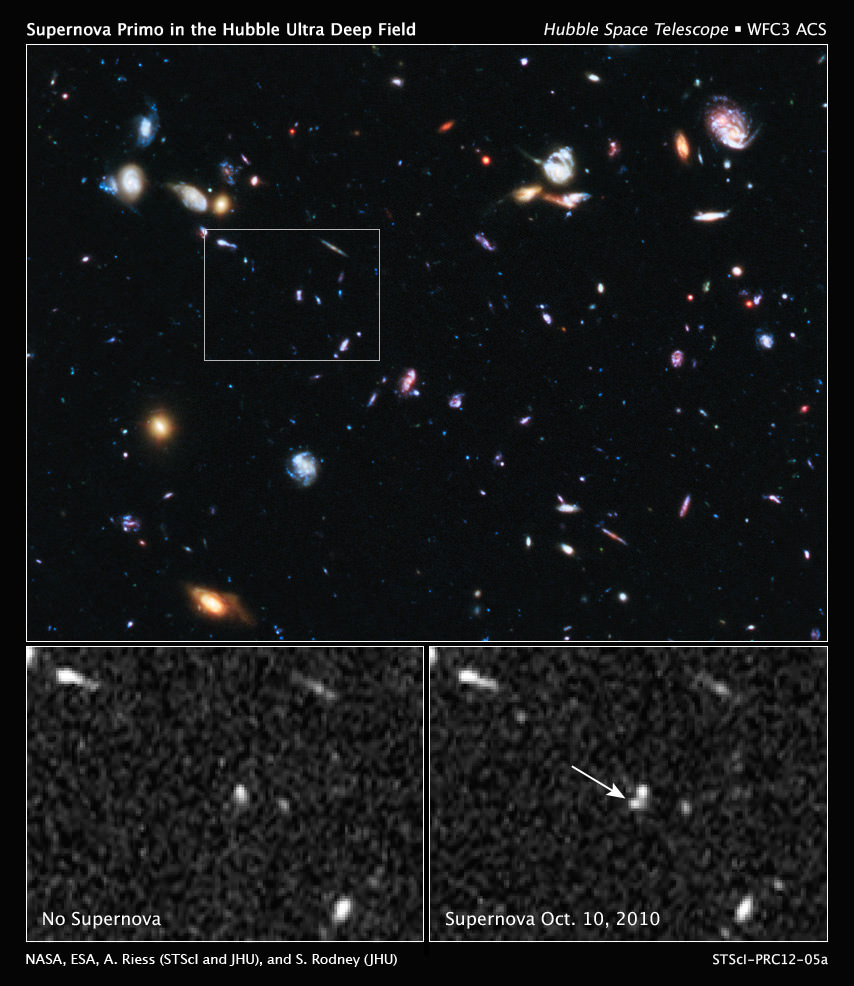
The top image shows part of the Hubble Ultra Deep Field, the region where astronomers were looking for a supernova blast. The white box pinpoints the area where the supernova is later seen. The image combines observations taken in visible and near-infrared light with the Advanced Camera for Surveys and the Wide Field Camera 3. The image at bottom left, taken by the Wide Field Camera 3, is a close-up of the field without the supernova. A new bright object, identified as the supernova, appears in the Wide Field Camera 3 image at bottom right. Credit: NASA, ESA, A. Riess (Space Telescope Science Institute and The Johns Hopkins University), and S. Rodney (The Johns Hopkins University)

[/caption]

Its nickname is SN Primo and it’s the farthest Type Ia supernova to have its distance spectroscopically confirmed. When the progenitor star exploded some 9 billion years ago, Primo sent its brilliant beacon of light across time and space to be captured by the Hubble Space Telescope. It’s all part and parcel of a three-year project dealing specifically with Type Ia supernovae. By splitting its light into constituent colors, researchers can verify its distance by redshift and help astronomers better understand not only the expanding Universe, but the constraints of dark energy.

“For decades, astronomers have harnessed the power of Hubble to unravel the mysteries of the Universe,” said John Grunsfeld, associate administrator for NASA’s Science Mission Directorate in Washington. “This new observation builds upon the revolutionary research using Hubble that won astronomers the 2011 Nobel Prize in Physics, while bringing us a step closer to understanding the nature of dark energy which drives the cosmic acceleration.”

Type Ia supernovae are theorized to have originated from white dwarf stars which have collected an excess of material from their companions and exploded. Because of their remote nature, they have been used to measure great distances with acceptable accuracy. Enter the CANDELS+CLASH Supernova Project… a type of census which utilizes the sharpness and versatility of Hubble’s Wide Field Camera 3 (WFC3) to aid astronomers in the search for supernovae in near- infrared light and verify their distance with spectroscopy. CANDELS is the Cosmic Assembly Near-infrared Deep Extragalactic Legacy Survey and CLASH is the Cluster Lensing and Supernova Survey with Hubble.

“In our search for supernovae, we had gone as far as we could go in optical light,” said Adam Riess, the project’s lead investigator, at the Space Telescope Science Institute and The Johns Hopkins University in Baltimore, Md. “But it’s only the beginning of what we can do in infrared light. This discovery demonstrates that we can use the Wide Field Camera 3 to search for supernovae in the distant Universe.”

However, discovering a supernova like Primo just doesn’t happen overnight. It took the research team several months of work and a huge amount of near-infrared images to locate the faint signature. After capturing the elusive target in October 2010, it was time to employ the WFC3’s spectrometer to validate SN Primo’s distance and analyze the spectra for confirmation of a Type Ia supernova event. Once verified, the team continued to image SN Primo for the next eight months – collecting data as it faded away. By engaging the Hubble in this type of census, astronomers hope to further their understanding of how such events are created. If they should discover that Type Ia supernova don’t always appear the same, it may lead to a way of categorizing those changes and aid in measuring dark energy. Riess and two other astronomers shared the 2011 Nobel Prize in Physics for discovering dark energy 13 years ago, using Type Ia supernova to plot the Universe’s expansion rate.

“If we look into the early Universe and measure a drop in the number of supernovae, then it could be that it takes a long time to make a Type Ia supernova,” said team member Steve Rodney of The Johns Hopkins University. “Like corn kernels in a pan waiting for the oil to heat up, the stars haven’t had enough time at that epoch to evolve to the point of explosion. However, if supernovae form very quickly, like microwave popcorn, then they will be immediately visible, and we’ll find many of them, even when the Universe was very young. Each supernova is unique, so it’s possible that there are multiple ways to make a supernova.”

Original Story Source: Hubble Site News Release.

Guest Post: The Cosmic Energy Inventory

The Cosmic Energy Inventory chart by Markus Pössel. Click for larger version.

[/caption]

Now that the old year has drawn to a close, it’s traditional to take stock. And why not think big and take stock of everything there is?

Let’s base our inventory on energy. And as Einstein taught us that energy and mass are equivalent, that means automatically taking stock of all the mass that’s in the universe, as well – including all the different forms of matter we might be interested in.

Of course, since the universe might well be infinite in size, we can’t simply add up all the energy. What we’ll do instead is look at fractions: How much of the energy in the universe is in the form of planets? How much is in the form of stars? How much is plasma, or dark matter, or dark energy?


The chart above is a fairly detailed inventory of our universe. The numbers I’ve used are from the article The Cosmic Energy Inventory by Masataka Fukugita and Jim Peebles, published in 2004 in the Astrophysical Journal (vol. 616, p. 643ff.). The chart style is borrowed from Randall Munroe’s Radiation Dose Chart over at xkcd.

These fractions will have changed a lot over time, of course. Around 13.7 billion years ago, in the Big Bang phase, there would have been no stars at all. And the number of, say, neutron stars or stellar black holes will have grown continuously as more and more massive stars have ended their lives, producing these kinds of stellar remnants. For this chart, following Fukugita and Peebles, we’ll look at the present era. What is the current distribution of energy in the universe? Unsurprisingly, the values given in that article come with different uncertainties – after all, the authors are extrapolating to a pretty grand scale! The details can be found in Fukugita & Peebles’ article; for us, their most important conclusion is that the observational data and their theoretical bases are now indeed firm enough for an approximate, but differentiated and consistent picture of the cosmic inventory to emerge.

Let’s start with what’s closest to our own home. How much of the energy (equivalently, mass) is in the form of planets? As it turns out: not a lot. Based on extrapolations from what data we have about exoplanets (that is, planets orbiting stars other than the sun), just one part-per-million (1 ppm) of all energy is in the form of planets; in scientific notation: 10-6. Let’s take “1 ppm” as the basic unit for our first chart, and represent it by a small light-green square. (Fractions of 1 ppm will be represented by partially filled such squares.) Here is the first box (of three), listing planets and other contributions of about the same order of magnitude:

So what else is in that box? Other forms of condensed matter, mainly cosmic dust, account for 2.5 ppm, according to rough extrapolations based on observations within our home galaxy, the Milky Way. Among other things, this is the raw material for future planets!

For the next contribution, a jump in scale. To the best of our knowledge, pretty much every galaxy contains a supermassive black hole (SMBH) in its central region. Masses for these SMBHs vary between a hundred thousand times the mass of our Sun and several billion solar masses. Matter falling into such a black hole (and getting caught up, intermittently, in super-hot accretion disks swirling around the SMBHs) is responsible for some of the brightest phenomena in the universe: active galaxies, including ultra high-powered quasars. The contribution of matter caught up in SMBHs to our energy inventory is rather modest, though: about 4 ppm; possibly a bit more.

Who else is playing in the same league? The sum total of all electromagnetic radiation produced by stars and by active galaxies (to name the two most important sources) over the course of the last billions of years, to name one: 2 ppm. Also, neutrinos produced during supernova explosions (at the end of the life of massive stars), or in the formation of white dwarfs (remnants of lower-mass stars like our Sun), or simply as part of the ordinary fusion processes that power ordinary stars: 3.2 ppm all in all.

Then, there’s binding energy: If two components are bound together, you will need to invest energy in order to separate them. That’s why binding energy is negative – it’s an energy deficit you will need to overcome to pry the system’s components apart. Nuclear binding energy, from stars fusing together light elements to form heavier ones, accounts for -6.3 ppm in the present universe – and the total gravitational binding energy accumulated as stars, galaxies, galaxy clusters, other gravitationally bound objects and the large-scale structure of the universe have formed over the past 14 or so billion years, for an even larger -13.4 ppm. All in all, the negative contributions from binding energy more than cancel out all the positive contributions by planets, radiation, neutrinos etc. we’ve listed so far.

Which brings us to the next level. In order to visualize larger contributions, we need a change scale. In box 2, one square will represent a fraction of 1/20,000 or 0.00005. Put differently: Fifty of the little squares in the first box correspond to a single square in the second box:

So here, without further ado, is box 2 (including, in the upper right corner, a scale model of the first box):

Now we are in the realm of stars and related objects. By measuring the luminosity of galaxies, and using standard relations between the masses and luminosity of stars (“mass-to-light-ratio”), you can get a first estimate for the total mass (equivalently: energy) contained in stars. You’ll also need to use the empirical relation (“initial mass function”) for how this mass is distributed, though: How many massive stars should there be? How many lower-mass stars? Since different stars have different lifetimes (live massively, die young), this gives estimates for how many stars out there are still in the prime of life (“main sequence stars”) and how many have already died, leaving white dwarfs (from low-mass stars), neutron stars (from more massive stars) or stellar black holes (from even more massive stars) behind. The mass distribution also provides you with an estimate of how much mass there is in substellar objects such as brown dwarfs – objects which never had sufficient mass to make it to stardom in the first place.

Let’s start small with the neutron stars at 0.00005 (1 square, at our current scale) and the stellar black holes (0.00007). Interestingly, those are outweighed by brown dwarfs which, individually, have much less mass, but of which there are, apparently, really a lot (0.00014; this is typical of stellar mass distribution – lots of low-mass stars, much fewer massive ones.) Next come white dwarfs as the remnants of lower-mass stars like our Sun (0.00036). And then, much more than all the remnants or substellar objects combined, ordinary, main sequence stars like our Sun and its higher-mass and (mostly) lower-mass brethren (0.00205).

Interestingly enough, in this box, stars and related objects contribute about as much mass (or energy) as more undifferentiated types of matter: molecular gas (mostly hydrogen molecules, at 0.00016), hydrogen and helium atoms (HI and HeI, 0.00062) and, most notably, the plasma that fills the void between galaxies in large clusters (0.0018) add up to a whopping 0.00258. Stars, brown dwarfs and remnants add up to 0.00267.

Further contributions with about the same order of magnitude are survivors from our universe’s most distant past: The cosmic background radiation (CMB), remnant of the extremely hot radiation interacting with equally hot plasma in the big bang phase, contributes 0.00005; the lesser-known cosmic neutrino background, another remnant of that early equilibrium, contributes a remarkable 0.0013. The binding energy from the first primordial fusion events (formation of light elements within those famous “first three minutes”) gives another contribution in this range: -0.00008.

While, in the previous box, the matter we love, know and need was not dominant, it at least made a dent. This changes when we move on to box 3. In this box, one square corresponds to 0.005. In other words: 100 squares from box 2 add up to a single square in box 3:

Box 3 is the last box of our chart. Again, a scale model of box 2 is added for comparison: All that’s in box 2 corresponds to one-square-and-a-bit in box 3.
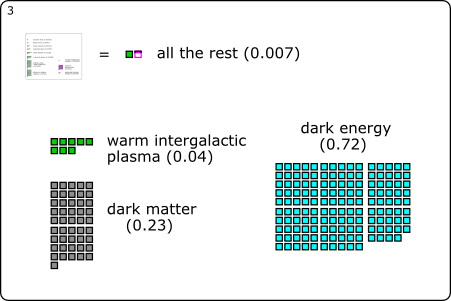
The first new contribution: warm intergalactic plasma. Its presence is deduced from the overall amount of ordinary matter (which follows from measurements of the cosmic background radiation, combined with data from surveys and measurements of the abundances of light elements) as compared with the ordinary matter that has actually been detected (as plasma, stars, e.g.). From models of large-scale structure formation, it follows that this missing matter should come in the shape (non-shape?) of a diffuse plasma, which isn’t dense (or hot) enough to allow for direct detection. This cosmic filler substance amounts to 0.04, or 85% of ordinary matter, showing just how much of a fringe phenomena those astronomical objects we usually hear and read about really are.

The final two (dominant) contributions come as no surprise for anyone keeping up with basic cosmology: dark matter at 23% is, according to simulations, the backbone of cosmic large-scale structure, with ordinary matter no more than icing on the cake. Last but not least, there’s dark energy with its contribution of 72%, responsible both for the cosmos’ accelerated expansion and for the 2011 physics Nobel Prize.

Minority inhabitants of a part-per-million type of object made of non-standard cosmic matter – that’s us. But at the same time, we are a species, that, its cosmic fringe position notwithstanding, has made remarkable strides in unravelling the big picture – including the cosmic inventory represented in this chart.

__________________________________________

Here is the full chart for you to download: the PNG version (1200×900 px, 233 kB) or the lovingly hand-crafted SVG version (29 kB).

The chart “The Cosmic Energy Inventory” is licensed under Creative Commons BY-NC-SA 3.0. In short: You’re free to use it non-commercially; you must add the proper credit line “Markus Pössel [www.haus-der-astronomie.de]”; if you adapt the work, the result must be available under this or a similar license.

Technical notes: As is common in astrophysics, Fukugita and Peebles give densities as fractions of the so-called critical density; in the usual cosmological models, that density, evaluated at any given time (in this case: the present), is critical for determining the geometry of the universe. Using very precise measurements of the cosmic background radiation, we know that the average density of the universe is indistinguishable from the critical density. For simplicity’s sake, I’m skipping this detour in the main text and quoting all of F & P’s numbers as “fractions of the universe’s total energy (density)”.

For the supermassive black hole contributions, I’ve neglected the fraction ?n in F & P’s article; that’s why I’m quoting a lower limit only. The real number could theoretically be twice the quoted value; it’s apparently more likely to be close to the value given here, though. For my gravitational binding energy, I’ve added F & P’s primeval gravitational binding energy (no. 4 in their list) and their binding energy from dissipative gravitational settling (no. 5).

The fact that the content of box 3 adds up not quite to 1, but to 0.997, is an artefact of rounding not quite consistently when going from box 2 to box 3. I wanted to keep the sum of all that’s in box 2 at the precision level of that box.

GALEX Confirms Nature of Dark Energy

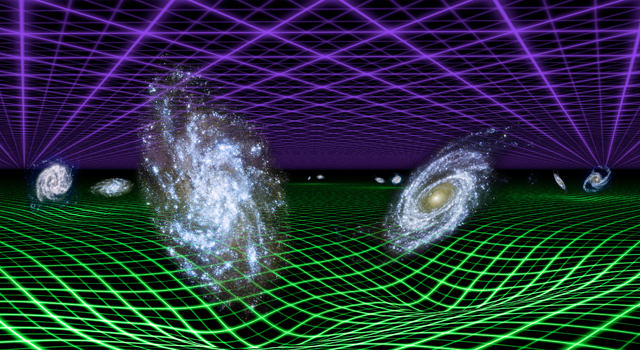
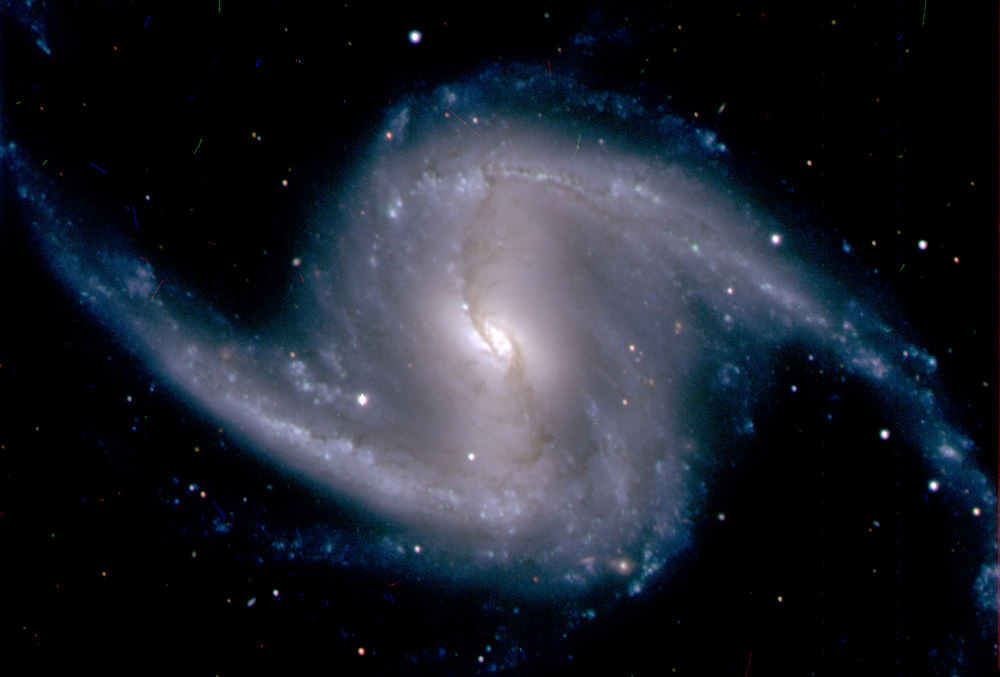
New results from NASA's Galaxy Evolution Explorer and the Anglo-Australian Telescope atop Siding Spring Mountain in Australia confirm that dark energy (represented by purple grid) is a smooth, uniform force that now dominates over the effects of gravity (green grid). The observations follow from careful measurements of the separations between pairs of galaxies (examples of such pairs are illustrated here).Image credit: NASA/JPL-Caltech

[/caption]

From a JPL press release:

A five-year survey of 200,000 galaxies, stretching back seven billion years in cosmic time, has led to one of the best independent confirmations that dark energy is driving our universe apart at accelerating speeds. The survey used data from NASA’s space-based Galaxy Evolution Explorer and the Anglo-Australian Telescope on Siding Spring Mountain in Australia.

The findings offer new support for the favored theory of how dark energy works — as a constant force, uniformly affecting the universe and propelling its runaway expansion. They contradict an alternate theory, where gravity, not dark energy, is the force pushing space apart. According to this alternate theory, with which the new survey results are not consistent, Albert Einstein’s concept of gravity is wrong, and gravity becomes repulsive instead of attractive when acting at great distances.

“The action of dark energy is as if you threw a ball up in the air, and it kept speeding upward into the sky faster and faster,” said Chris Blake of the Swinburne University of Technology in Melbourne, Australia. Blake is lead author of two papers describing the results that appeared in recent issues of the Monthly Notices of the Royal Astronomical Society. “The results tell us that dark energy is a cosmological constant, as Einstein proposed. If gravity were the culprit, then we wouldn’t be seeing these constant effects of dark energy throughout time.”

Dark energy is thought to dominate our universe, making up about 74 percent of it. Dark matter, a slightly less mysterious substance, accounts for 22 percent. So-called normal matter, anything with atoms, or the stuff that makes up living creatures, planets and stars, is only approximately four percent of the cosmos.

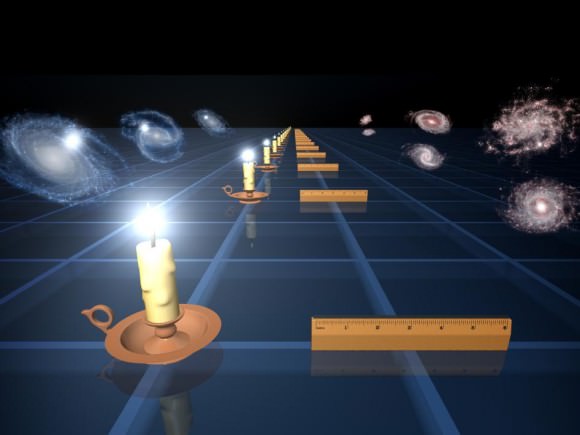
The idea of dark energy was proposed during the previous decade, based on studies of distant exploding stars called supernovae. Supernovae emit constant, measurable light, making them so-called “standard candles,” which allows calculation of their distance from Earth. Observations revealed dark energy was flinging the objects out at accelerating speeds.

his diagram illustrates two ways to measure how fast the universe is expanding -- the "standard candle" method, which involves exploded stars in galaxies, and the "standard ruler" method, which involves pairs of galaxies. Image credit: NASA/JPL-Caltech

Dark energy is in a tug-of-war contest with gravity. In the early universe, gravity took the lead, dominating dark energy. At about 8 billion years after the Big Bang, as space expanded and matter became diluted, gravitational attractions weakened and dark energy gained the upper hand. Billions of years from now, dark energy will be even more dominant. Astronomers predict our universe will be a cosmic wasteland, with galaxies spread apart so far that any intelligent beings living inside them wouldn’t be able to see other galaxies.

The new survey provides two separate methods for independently checking the supernovae results. This is the first time astronomers performed these checks across the whole cosmic timespan dominated by dark energy. The team began by assembling the largest three-dimensional map of galaxies in the distant universe, spotted by the Galaxy Evolution Explorer. The ultraviolet-sensing telescope has scanned about three-quarters of the sky, observing hundreds of millions of galaxies.

“The Galaxy Evolution Explorer helped identify bright, young galaxies, which are ideal for this type of study,” said Christopher Martin, principal investigator for the mission at the California Institute of Technology in Pasadena. “It provided the scaffolding for this enormous 3-D map.”

The astronomers acquired detailed information about the light for each galaxy using the Anglo-Australian Telescope and studied the pattern of distance between them. Sound waves from the very early universe left imprints in the patterns of galaxies, causing pairs of galaxies to be separated by approximately 500 million light-years.

This “standard ruler” was used to determine the distance from the galaxy pairs to Earth — the closer a galaxy pair is to us, the farther apart the galaxies will appear from each other on the sky. As with the supernovae studies, this distance data were combined with information about the speeds at which the pairs are moving away from us, revealing, yet again, the fabric of space is stretching apart faster and faster.

The team also used the galaxy map to study how clusters of galaxies grow over time like cities, eventually containing many thousands of galaxies. The clusters attract new galaxies through gravity, but dark energy tugs the clusters apart. It slows down the process, allowing scientists to measure dark energy’s repulsive force.

“Observations by astronomers over the last 15 years have produced one of the most startling discoveries in physical science; the expansion of the universe, triggered by the Big Bang, is speeding up,” said Jon Morse, astrophysics division director at NASA Headquarters in Washington. “Using entirely independent methods, data from the Galaxy Evolution Explorer have helped increase our confidence in the existence of dark energy.”

For more information see the Australian Astronomical Observatory

Antigravity Could Replace Dark Energy as Cause of Universe’s Expansion

Annihilation
Illustration of Antimatter/Matter Annihilation. (NASA/CXC/M. Weiss)

[/caption]

Since the late 20th century, astronomers have been aware of data that suggest the universe is not only expanding, but expanding at an accelerating rate. According to the currently accepted model, this accelerated expansion is due to dark energy, a mysterious repulsive force that makes up about 73% of the energy density of the universe. Now, a new study reveals an alternative theory: that the expansion of the universe is actually due to the relationship between matter and antimatter. According to this study, matter and antimatter gravitationally repel each other and create a kind of “antigravity” that could do away with the need for dark energy in the universe.

Massimo Villata, a scientist from the Observatory of Turin in Italy, began the study with two major assumptions. First, he posited that both matter and antimatter have positive mass and energy density. Traditionally, the gravitational influence of a particle is determined solely by its mass. A positive mass value indicates that the particle will attract other particles gravitationally. Under Villata’s assumption, this applies to antiparticles as well. So under the influence of gravity, particles attract other particles and antiparticles attract other antiparticles. But what kind of force occurs between particles and antiparticles?

To resolve this question, Villata needed to institute the second assumption – that general relativity is CPT invariant. This means that the laws governing an ordinary matter particle in an ordinary field in spacetime can be applied equally well to scenarios in which charge (electric charge and internal quantum numbers), parity (spatial coordinates) and time are reversed, as they are for antimatter. When you reverse the equations of general relativity in charge, parity and time for either the particle or the field the particle is traveling in, the result is a change of sign in the gravity term, making it negative instead of positive and implying so-called antigravity between the two.

Villata cited the quaint example of an apple falling on Isaac Newton’s head. If an anti-apple falls on an anti-Earth, the two will attract and the anti-apple will hit anti-Newton on the head; however, an anti-apple cannot “fall” on regular old Earth, which is made of regular old matter. Instead, the anti-apple will fly away from Earth because of gravity’s change in sign. In other words, if general relativity is, in fact, CPT invariant, antigravity would cause particles and antiparticles to mutually repel. On a much larger scale, Villata claims that the universe is expanding because of this powerful repulsion between matter and antimatter.

What about the fact that matter and antimatter are known to annihilate each other? Villata resolved this paradox by placing antimatter far away from matter, in the enormous voids between galaxy clusters. These voids are believed to have stemmed from tiny negative fluctuations in the primordial density field and do seem to possess a kind of antigravity, repelling all matter away from them. Of course, the reason astronomers don’t actually observe any antimatter in the voids is still up in the air. In Villata’s words, “There is more than one possible answer, which will be investigated elsewhere.” The research appears in this month’s edition of Europhysics Letters.

Hubble Rules Out One Alternative to Dark Energy

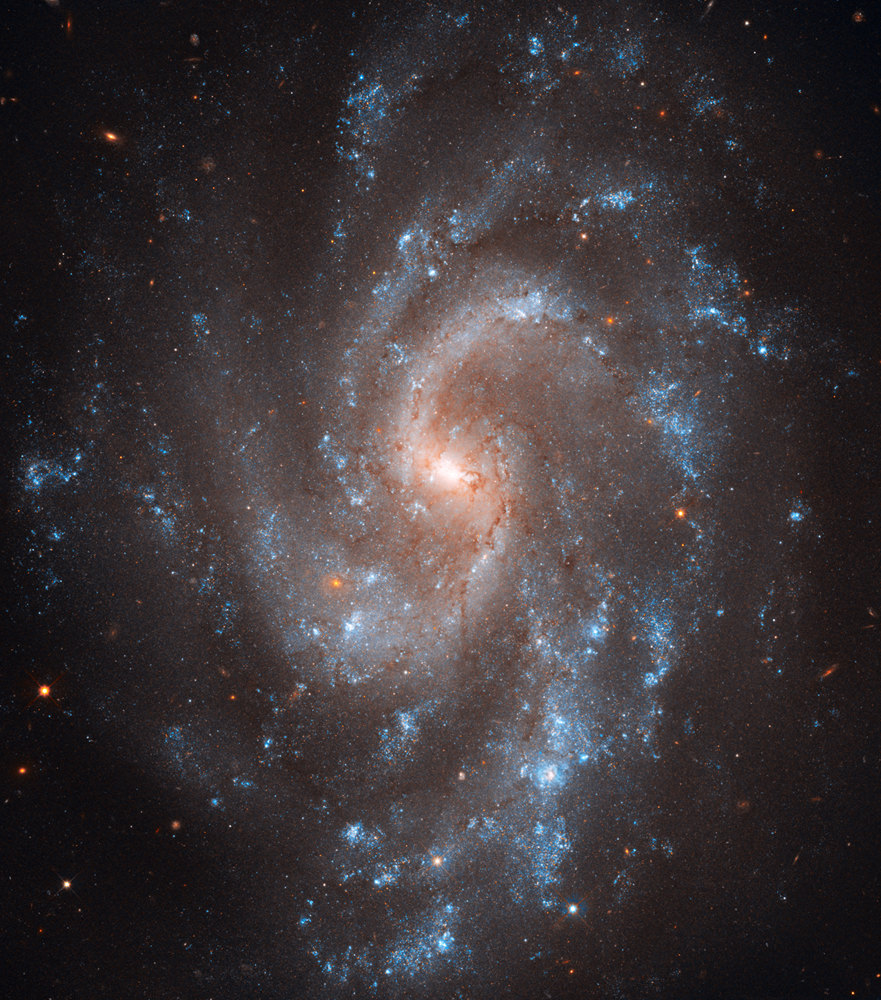
NGC 5584. Credit: NASA, ESA, A. Riess (STScI/JHU), L. Macri (Texas A&M University), and Hubble Heritage Team (STScI/AURA)

[/caption]

From a NASA press release:

Astronomers using NASA’s Hubble Space Telescope have ruled out an alternate theory on the nature of dark energy after recalculating the expansion rate of the universe to unprecedented accuracy.

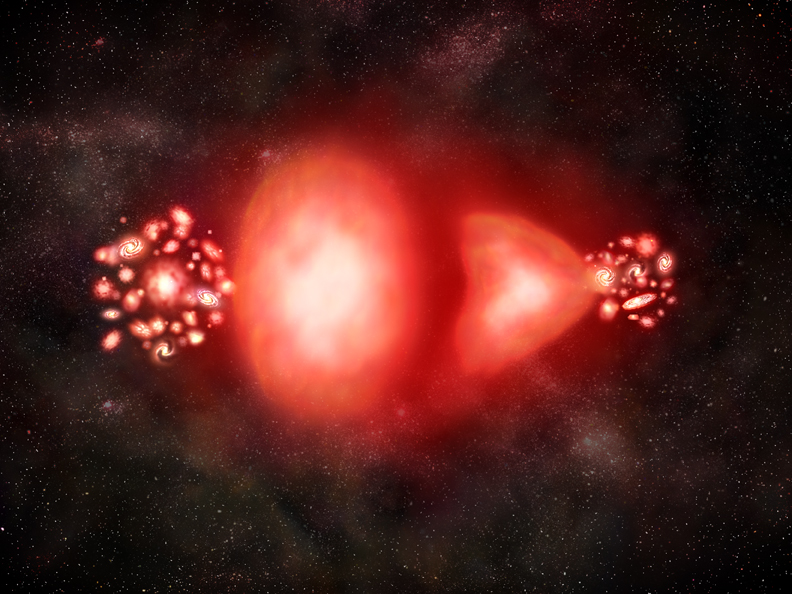
The universe appears to be expanding at an increasing rate. Some believe that is because the universe is filled with a dark energy that works in the opposite way of gravity. One alternative to that hypothesis is that an enormous bubble of relatively empty space eight billion light-years across surrounds our galactic neighborhood. If we lived near the center of this void, observations of galaxies being pushed away from each other at accelerating speeds would be an illusion.

This hypothesis has been invalidated because astronomers have refined their understanding of the universe’s present expansion rate. Adam Riess of the Space Telescope Science Institute (STScI) and Johns Hopkins University in Baltimore, Md., led the research. The Hubble observations were conducted by the SHOES (Supernova H0 for the Equation of State) team that works to refine the accuracy of the Hubble constant to a precision that allows for a better characterization of dark energy’s behavior. The observations helped determine a figure for the universe’s current expansion rate to an uncertainty of just 3.3 percent. The new measurement reduces the error margin by 30 percent over Hubble’s previous best measurement in 2009. Riess’s results appear in the April 1 issue of The Astrophysical Journal.

“We are using the new camera on Hubble like a policeman’s radar gun to catch the universe speeding,” Riess said. “It looks more like it’s dark energy that’s pressing the gas pedal.”

Riess’ team first had to determine accurate distances to galaxies near and far from Earth. The team compared those distances with the speed at which the galaxies are apparently receding because of the expansion of space. They used those two values to calculate the Hubble constant, the number that relates the speed at which a galaxy appears to recede to its distance from the Milky Way. Because astronomers cannot physically measure the distances to galaxies, researchers had to find stars or other objects that serve as reliable cosmic yardsticks. These are objects with an intrinsic brightness, brightness that hasn’t been dimmed by distance, an atmosphere, or stellar dust, that is known. Their distances, therefore, can be inferred by comparing their true brightness with their apparent brightness as seen from Earth.

To calculate longer distances, Riess’ team chose a special class of exploding stars called Type 1a supernovae. These stellar explosions all flare with similar luminosity and are brilliant enough to be seen far across the universe. By comparing the apparent brightness of Type 1a supernovae and pulsating Cepheid stars, the astronomers could measure accurately their intrinsic brightness and therefore calculate distances to Type Ia supernovae in far-flung galaxies.

Using the sharpness of the new Wide Field Camera 3 (WFC3) to study more stars in visible and near-infrared light, scientists eliminated systematic errors introduced by comparing measurements from different telescopes.

“WFC3 is the best camera ever flown on Hubble for making these measurements, improving the precision of prior measurements in a small fraction of the time it previously took,” said Lucas Macri, a collaborator on the SHOES Team from Texas A&M in College Station.

Knowing the precise value of the universe’s expansion rate further restricts the range of dark energy’s strength and helps astronomers tighten up their estimates of other cosmic properties, including the universe’s shape and its roster of neutrinos, or ghostly particles, that filled the early universe.

“Thomas Edison once said ‘every wrong attempt discarded is a step forward,’ and this principle still governs how scientists approach the mysteries of the cosmos,” said Jon Morse, astrophysics division director at NASA Headquarters in Washington. “By falsifying the bubble hypothesis of the accelerating expansion, NASA missions like Hubble bring us closer to the ultimate goal of understanding this remarkable property of our universe.”

Science Paper by: Adam G. Riess et al. (PDF document)

Astronomers Now Closer to Understanding Dark Energy

Dark Energy
The Hubble Space Telescope image of the inner regions of the lensing cluster Abell 1689 that is 2.2 billion light?years away. Light from distant background galaxies is bent by the concentrated dark matter in the cluster (shown in the blue overlay) to produce the plethora of arcs and arclets that were in turn used to constrain dark energy. Image courtesy of NASA?ESA, Jullo (JPL), Natarajan (Yale), Kneib (LAM)

Understanding something we can’t see has been a problem that astronomers have overcome in the past. Now, a group of scientists believe a new technique will meet the challenge of helping to solve one of the biggest mysteries in cosmology today: understanding the nature of dark energy. Using the strong gravitational lensing method — where a massive galaxy cluster acts as a cosmic magnifying lens — an international team of astronomers have been able to study elusive dark energy for the first time. The team reports that when combined with existing techniques, their results significantly improve current measurements of the mass and energy content of the universe.

Using data taken by the Hubble Space Telescope as well as ground-based telescopes, the team analyzed images of 34 extremely distant galaxies situated behind Abell 1689, one of the biggest and most massive known galaxy clusters in the universe.

Through the gravitational lens of Abell 1689, the astronomers, led by Eric Jullo from JPL and Priyamvada Natarajan from Yale University, were able to detect the faint, distant background galaxies—whose light was bent and projected by the cluster’s massive gravitational pull—in a similar way that the lens of a magnifying lens distorts an object’s image.

Using this method, they were able to reduce the overall error in its equation-of-state parameter by 30 percent, when combined with other methods.

The way in which the images were distorted gave the astronomers clues as to the geometry of the space that lies between the Earth, the cluster and the distant galaxies. “The content, geometry and fate of the universe are linked, so if you can constrain two of those things, you learn something about the third,” Natarajan said.

The team was able to narrow the range of current estimates about dark energy’s effect on the universe, denoted by the value w, by 30 percent. The team combined their new technique with other methods, including using supernovae, X-ray galaxy clusters and data from the Wilkinson Microwave Anisotropy Probe (WMAP) spacecraft, to constrain the value for w.

“Dark energy is characterized by the relationship between its pressure and its density: this is known as its equation of state,” said Jullo. “Our goal was to try to quantify this relationship. It teaches us about the properties of dark energy and how it has affected the development of the Universe.”

Dark energy makes up about 72 percent of all the mass and energy in the universe and will ultimately determine its fate. The new results confirm previous findings that the nature of dark energy likely corresponds to a flat universe. In this scenario, the expansion of the universe will continue to accelerate and the universe will expand forever.

The astronomers say the real strength of this new result is that it devises a totally new way to extract information about the elusive dark energy, and it offers great promise for future applications.

According to the scientists, their method required multiple, meticulous steps to develop. They spent several years developing specialized mathematical models and precise maps of the matter — both dark and “normal” — that together constitute the Abell 1689 cluster.

The findings appear in the August 20 issue of the journal Science.

Sources: Yale University, Science Express. ESA Hubble.

New Technique Could Track Down Dark Energy

Robert C. Byrd Green Bank Telescope CREDIT: NRAO/AUI/NSF

[/caption]

From an NRAO press release:

Dark energy is the label scientists have given to what is causing the Universe to expand at an accelerating rate, and is believed to make up nearly three-fourths of the mass and energy of the Universe. While the acceleration was discovered in 1998, its cause remains unknown. Physicists have advanced competing theories to explain the acceleration, and believe the best way to test those theories is to precisely measure large-scale cosmic structures. A new technique developed for the Robert C. Byrd Green Bank Telescope (GBT) have given astronomers a new way to map large cosmic structures such as dark energy.

Sound waves in the matter-energy soup of the extremely early Universe are thought to have left detectable imprints on the large-scale distribution of galaxies in the Universe. The researchers developed a way to measure such imprints by observing the radio emission of hydrogen gas. Their technique, called intensity mapping, when applied to greater areas of the Universe, could reveal how such large-scale structure has changed over the last few billion years, giving insight into which theory of dark energy is the most accurate.

“Our project mapped hydrogen gas to greater cosmic distances than ever before, and shows that the techniques we developed can be used to map huge volumes of the Universe in three dimensions and to test the competing theories of dark energy,” said Tzu-Ching Chang, of the Academia Sinica in Taiwan and the University of Toronto.

To get their results, the researchers used the GBT to study a region of sky that previously had been surveyed in detail in visible light by the Keck II telescope in Hawaii. This optical survey used spectroscopy to map the locations of thousands of galaxies in three dimensions. With the GBT, instead of looking for hydrogen gas in these individual, distant galaxies — a daunting challenge beyond the technical capabilities of current instruments — the team used their intensity-mapping technique to accumulate the radio waves emitted by the hydrogen gas in large volumes of space including many galaxies.

“Since the early part of the 20th Century, astronomers have traced the expansion of the Universe by observing galaxies. Our new technique allows us to skip the galaxy-detection step and gather radio emissions from a thousand galaxies at a time, as well as all the dimly-glowing material between them,” said Jeffrey Peterson, of Carnegie Mellon University.

The astronomers also developed new techniques that removed both man-made radio interference and radio emission caused by more-nearby astronomical sources, leaving only the extremely faint radio waves coming from the very distant hydrogen gas. The result was a map of part of the “cosmic web” that correlated neatly with the structure shown by the earlier optical study. The team first proposed their intensity-mapping technique in 2008, and their GBT observations were the first test of the idea.

“These observations detected more hydrogen gas than all the previously-detected hydrogen in the Universe, and at distances ten times farther than any radio wave-emitting hydrogen seen before,” said Ue-Li Pen of the University of Toronto.

“This is a demonstration of an important technique that has great promise for future studies of the evolution of large-scale structure in the Universe,” said National Radio Astronomy Observatory Chief Scientist Chris Carilli, who was not part of the research team.

In addition to Chang, Peterson, and Pen, the research team included Kevin Bandura of Carnegie Mellon University. The scientists reported their work in the July 22 issue of the scientific journal Nature.