[/caption]
Since the late 20th century, astronomers have been aware of data that suggest the universe is not only expanding, but expanding at an accelerating rate. According to the currently accepted model, this accelerated expansion is due to dark energy, a mysterious repulsive force that makes up about 73% of the energy density of the universe. Now, a new study reveals an alternative theory: that the expansion of the universe is actually due to the relationship between matter and antimatter. According to this study, matter and antimatter gravitationally repel each other and create a kind of “antigravity” that could do away with the need for dark energy in the universe.
Massimo Villata, a scientist from the Observatory of Turin in Italy, began the study with two major assumptions. First, he posited that both matter and antimatter have positive mass and energy density. Traditionally, the gravitational influence of a particle is determined solely by its mass. A positive mass value indicates that the particle will attract other particles gravitationally. Under Villata’s assumption, this applies to antiparticles as well. So under the influence of gravity, particles attract other particles and antiparticles attract other antiparticles. But what kind of force occurs between particles and antiparticles?
To resolve this question, Villata needed to institute the second assumption – that general relativity is CPT invariant. This means that the laws governing an ordinary matter particle in an ordinary field in spacetime can be applied equally well to scenarios in which charge (electric charge and internal quantum numbers), parity (spatial coordinates) and time are reversed, as they are for antimatter. When you reverse the equations of general relativity in charge, parity and time for either the particle or the field the particle is traveling in, the result is a change of sign in the gravity term, making it negative instead of positive and implying so-called antigravity between the two.
Villata cited the quaint example of an apple falling on Isaac Newton’s head. If an anti-apple falls on an anti-Earth, the two will attract and the anti-apple will hit anti-Newton on the head; however, an anti-apple cannot “fall” on regular old Earth, which is made of regular old matter. Instead, the anti-apple will fly away from Earth because of gravity’s change in sign. In other words, if general relativity is, in fact, CPT invariant, antigravity would cause particles and antiparticles to mutually repel. On a much larger scale, Villata claims that the universe is expanding because of this powerful repulsion between matter and antimatter.
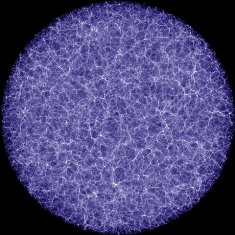
What about the fact that matter and antimatter are known to annihilate each other? Villata resolved this paradox by placing antimatter far away from matter, in the enormous voids between galaxy clusters. These voids are believed to have stemmed from tiny negative fluctuations in the primordial density field and do seem to possess a kind of antigravity, repelling all matter away from them. Of course, the reason astronomers don’t actually observe any antimatter in the voids is still up in the air. In Villata’s words, “There is more than one possible answer, which will be investigated elsewhere.” The research appears in this month’s edition of Europhysics Letters.