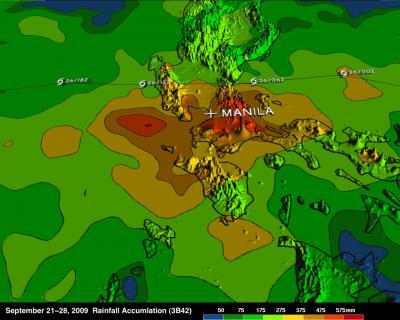
GOCE Satellite Begins Mapping Earth’s Gravity in Lower Orbit Than Expected

Anaglyph images created from an ESA video animation of global gravity gradients. A more accurate global map will be generated by ESA's GOCE craft. Credit: ESA and Nathaniel Burton Bradford.

[/caption]
Is Earth’s gravity field as intriguing and misshapen as this image above? We’re about to find out. The sexy looking Gravity field and steady-state Ocean Circulation Explorer or GOCE satellite has completed its calibration and is now in its science orbit to map the tiny variations of Earth’s gravity in unprecedented detail. And it turns out the sun’s current period of low solar activity has a side benefit for the GOCE mission. Less solar activity means a calmer environment for GOCE in its low Earth orbit, so its current orbit of 255 km is a few kilometers lower than engineers had originally planned. This is good news – the gravity measurements being made at the moment will be even more accurate.

“The completion of the commissioning and first in-flight calibration marks an important milestone for the mission, ” said Rune Floberghagen, ESA’s GOCE Mission Manager. “We are now entering science operations and are looking forward to receiving and processing excellent three-dimensional information on the structure of Earth’s gravity field.”

Anaglyph created from an ESA GOCE craft animation. Credit:  ESA and Nathanial Burton Bradford
Anaglyph created from an ESA GOCE craft animation. Credit: ESA and Nathanial Burton Bradford

Gravity is stronger closer to Earth, so GOCE was designed to orbit as low as possible while remaining stable as it flies through the fringes of our atmosphere. GOCE’s sleek aerodynamic design helps this the satellite to cut though the tenuous fringes of Earth’s atmosphere at this low altitude. Moreover, the electric ion thruster at the back continuously generates tiny forces to compensate for any drag that GOCE experiences along its orbit.

To help avoid drag and ensure that the gravity measurements are of true gravity, the satellite has to be kept stable in ‘free fall’. Any buffeting from residual air at this low altitude could potentially drown out the gravity data.

Space gradiometry and the use of the sophisticated electric propulsion are both ‘firsts’ in satellite technology, so the commissioning and calibration were particularly important for the success of the mission. This phase was completed in the summer, ready for the tricky task of bringing GOCE down to its operational altitude, which took a couple of months.

Worldwide gravity gradients from simulations. GOCE is now gathering data such as shown here to map Earth's gravity with unprecedented accuracy and spatial resolution. Credit:  ESA
Worldwide gravity gradients from simulations. GOCE is now gathering data such as shown here to map Earth's gravity with unprecedented accuracy and spatial resolution. Credit: ESA

Over two six-month uninterrupted periods, GOCE will map these subtle variations with extreme detail and accuracy. This will result in a unique model of the ‘geoid’ – the surface of an ideal global ocean at rest.

A precise knowledge of the geoid is crucial for accurate measurement of ocean circulation and sea-level change, both of which are influenced by climate. The data from GOCE are also much-needed to understand the processes occurring inside Earth. In addition, by providing a global reference to compare heights anywhere in the world, the GOCE-derived geoid will be used for practical applications in areas such as surveying and leveling.

Stay tuned for some unique data about our home planet from GOCE.

Thanks to Nathanial Burton-Bradford for the terrific anaglyphs he created from a GOCE animation. See more of Nathanial’s images on his Flickr page.

Source: ESA

From Space: Huge River of Dust Over Australia

A river of dust over Eastern Australia on Sept. 24, 2009. NASA image courtesy Jeff Schmaltz, MODIS Rapid Response Team at NASA GSFC. Caption by Holli Riebeek.

[/caption]This isn’t a special effect image from a new catastrophe movie; it is an actual satellite image of the dust storm sweeping over and around eastern Australia, heading across the Tasman Sea toward New Zealand. A dense wall of dust descended upon Sydney on Sept. 23, creating an apocalyptic scene (see these images from Boston Globe’s Big Picture) and the river of dust continues unabated across water. The Moderate Resolution Imaging Spectroradiometer (MODIS) on NASA’s Terra satellite captured this image of the storm on September 24, at 11:10 a.m., New Zealand time (23:10 UTC on September 23). The distance between the far northern edge of the plume and the southern edge is about 3,450 kilometers (2,700 miles), roughly equivalent to the distance between New York City and Los Angeles. Below, see how the storm progressed across the Sea later in the day.

Dust storm over Australia during the afternoon of Sept. 24, 2009. NASA image courtesy Jeff Schmaltz, MODIS Rapid Response Team at NASA GSFC.

By the early afternoon of September 24, 2009, when the same satellite acquired this image, the thick dust that had covered the eastern shore of Australia previouly, stretched in a long plume from northern Queensland to New Zealand. This image shows the northern portion of the plume off the coast of Queenland. The tan dust is densely concentrated in a compact plume that mirrors the coastline. The gem-like blue-green Great Barrier Reef is visible beneath the plume near the top of the image where the tan dust mingles with gray-brown smoke from wildfires.

Source: NASA Earth Observatory

Pictures of Rivers

Mississippi river delta

Here are some cool pictures of rivers taken by various spacecraft.

Here’s a picture of the Mississippi river delta. The image was captured by Advanced Spaceborne Thermal Emission and Reflection Radiometer (ASTER) aboard NASA’s Terra satellite.


Betsiboka River flooding

This is an image of flooding on the Betsiboka River in Madagascar. The flooding was created by Tropical Storm Eric, which swept through the region in early 2009. This photograph was taken by astronauts on board the International Space Station.


Colorado River Delta

People rely on the Colorado River so much that very little of it actually reaches the ocean. Instead, almost all of the water that flows through the river is used for irrigation along its route.


Ganges river delta. Image credit: NASA

This is a picture of the river delta for the Ganges. In fact, the Ganges combined with the Brahmaputra River make up the largest river delta in the world. The rivers flood from snow melt in the nearby Himalayas.


Niger River
Niger River

This is a picture of the Niger River. It was captured by the ASTER instrument on board NASA’s Terra Earth Observation satellite.

We have written many articles with pictures of rivers for Universe Today. Here’s an article about flooding in the Red River, and here’s an image of the Yangtze River from space.

We have also recorded an episode of Astronomy Cast all about the Earth. Listen to it here, Episode 51: Earth.

Satellite Map of the World

World satellite map. Image credit: NASA

There’s no better way to appreciate the planet you live on than to have a great big picture of it on your wall. Here are some ways you can get your hands on a satellite map of the world.

If you’ve got a nice printer and you’d like to save yourself some money, why not download a satellite map of the world for free from NASA. You can get free satellite images from the NASA Earth Observatory.

[/caption]

Each month NASA releases a new composite satellite image of the entire planet. This lets you track changes from month to month. You can view the full images on this page.

NASA satellite map of the Earth

You can also get a free satellite map of the world captured at night. This photo shows whole planet Earth, but now you’re seeing it at night. The bright spots are cities and populated areas. It’s easy to see the differences between 1st world countries and more developing nations.

Earth lights at night.

If you want to just buy a poster that you can put on your wall, you can find a bunch of satellite world maps from Amazon.com. Here’s a link to buy the Earth at night poster. And here’s an image of the whole Earth by day.

The Grand Canyon From Space

Grand Canyon from space. Click for larger version. Credit: ESA

[/caption]
The Grand Canyon is an awesome sight on Earth — one of the seven natural wonders of the world – and it looks breathtaking from space, too. This image was taken by the Envisat satellite, showing canyon walls, rock structures, old lava flows, buttes, ravines, stair-step topography in hues of pink, violet and gray.

Also visible in the image are the Colorado Plateau (upper right corner), the Mogollon Plateau (dark area under Colorado Plateau), Lake Meade (Y-shaped water body left of the canyon), Las Vegas, Nevada (bright white and blue area left of Lake Meade) and the southern tip of Utah (upper left).

Although a number of processes combined to create the Grand Canyon, it was formed primarily by the eroding action of the Colorado River that began about six million years ago. Other contributing factors include volcanism, continental drift and the semiarid climate.

As water erosion sculpted this majestic showplace, it revealed layers and layers of exposed rocks that provide us with a profound record of geologic events. As some of Earth’s oldest rock lies at the bottom of the canyon, it is said to be 1800 meters and a billion years deep. It is about 443 km long and 8 to 29 km wide.

This image was acquired by Envisat’s Medium Resolution Imaging Spectrometer (MERIS) instrument on 10 May 2009, working in Full Resolution mode to provide a spatial resolution of 300 meters.

Source: ESA