Scientists Propose a New Kind of Planet: A Smashed Up Torus of Hot Vaporized Rock

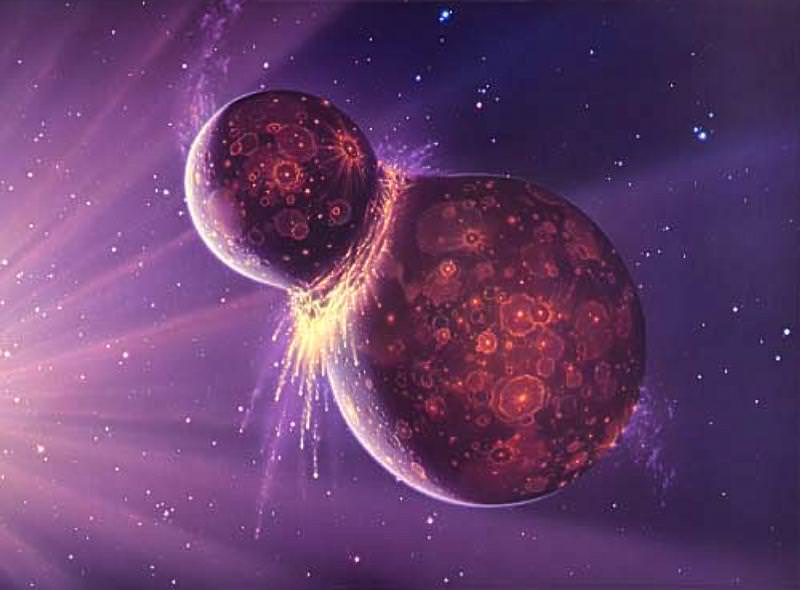
Artist's impression of a Mars-sized object crashing into the Earth, starting the process that eventually created our Moon. Credit: Joe Tucciarone

There’s a new type of planet in town, though you won’t find it in well-aged solar systems like our own. It’s more of a stage of formation that planets like Earth can go through. And its existence helps explain the relationship between Earth and our Moon.

The new type of planet is a huge, spinning, donut-shaped mass of hot, vaporized rock, formed as planet-sized objects smash into each other. The pair of scientists behind the study explaining this new planet type have named it a ‘synestia.’ Simon Lock, a graduate student at Harvard University, and Sarah Stewart, a professor in the Department of Earth and Planetary Sciences at the University of California, Davis, say that Earth was at one time a synestia.

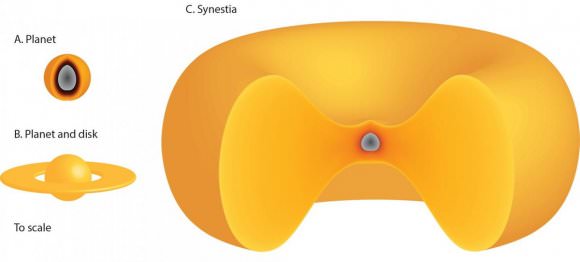
Rocky planets like Earth are accreted from smaller bodies over time. Objects with high energy and high angular momentum could form a synestia, a transient stage in planetary formation where vaporized rock orbits the rest of the body. In this image, each of the three stages has the same mass. Image: Simon Lock, Harvard University

The current theory of planetary formation goes like this: When a star forms, the left-over material is in motion around the star. This left-over material is called a protoplanetary disk. The material coagulates into larger bodies as the smaller ones collide and join together.

As the bodies get larger and larger, the force of their collisions becomes greater and greater, and when two large bodies collided, their rocky material melts. Then, the newly created body cools, and becomes spherical. It’s understood that this is how Earth and the other rocky planets in our Solar System formed.

Lock and Stewart looked at this process and asked what would happen if the resulting body was spinning quickly.

When a body is spinning, the law of conservation of angular momentum comes into play. That law says that a spinning body will spin until an external torque slows it down. The often-used example from figure skating helps explain this.

If you’ve ever watched figure skaters, and who hasn’t, their actions are very instructive. When a single skater is spinning rapidly, she stretches out her arms to slow the rate of spin. When she folds her arms back into her body, she speeds up again. Her angular momentum is conserved.

This short video shows figure skaters and physics in action.

If you don’t like figure skating, this one uses the Earth to explain angular momentum.

Now take the example from a pair of figure skaters. When they’re both turning, and the two of them join together by holding each other’s hands and arms, their angular momentum is added together and conserved.

Replace two figure skaters with two planets, and this is what the two scientists behind the study wanted to model. What would happen if two large bodies with high energy and high angular momentum collided with each other?

If the two bodies had high enough temperatures and high enough angular momentum, a new type of planetary structure would form: the synestia. “We looked at the statistics of giant impacts, and we found that they can form a completely new structure,” Stewart said.

“We looked at the statistics of giant impacts, and we found that they can form a completely new structure.” – Professor Sarah Stewart, Department of Earth and Planetary Sciences at the University of California, Davis.

As explained in a press release from the UC Davis, for a synestia to form, some of the vaporized material from the collision must go into orbit. When a sphere is solid, every point on it is rotating at the same rate, if not the same speed. But when some of the material is vaporized, its volume expands. If it expands enough, and if its moving fast enough, it leaves orbit and forms a huge disc-shaped synestia.

Other theories have proposed that two large enough bodies could form an orbiting molten mass after colliding. But if the two bodies had high enough energy and temperature to vaporize some of the rock, the resulting synestia would occupy a much larger space.

“The main issue with looking for synestias around other stars is that they don’t last a long time. These are transient, evolving objects that are made during planet formation.” – Professor Sarah Stewart, UC Davis.

These synestias likely wouldn’t last very long. They would cool quickly and condense back into rocky bodies. For a body the size of Earth, the synestia might only last one hundred years.

The synestia structure sheds some light on how moons are formed. The Earth and the Moon are very similar in terms of composition, so it’s likely they formed as a result of a collision. It’s possible that the Earth and Moon formed from the same synestia.

These synestias have been modelled, but they haven’t been observed. However, the James Webb Space Telescope will have the power to peer into protoplanetary disks and watch planets forming. Will it observe a synestia?

“These are transient, evolving objects that are made during planet formation.” – Professor Sarah Stewart, UC Davis

In an email exchange with Universe Today, Dr. Sarah Stewart of UC Davis, one of the scientists behind the study, told us that “The main issue with looking for synestias around other stars is that they don’t last a long time. These are transient, evolving objects that are made during planet formation.”

“So the best bet for finding a rocky synestia is young systems where the body is close to the star. For gas giant planets, they may form a synestia for a period of their formation. We are getting close to being able to image circumplanetary disks in other star systems.”

Once we have the ability to observe planets forming in their circumstellar disks, we may find that synestias are more common than rare. In fact, planets may go through the synestia stage multiple times. Dr. Stewart told us that “Based on the statistics presented in our paper, we expect that most (more than half) of rocky planets that form in a manner similar to Earth became synestias one or more times during the giant impact stage of accretion.”

Weekly Space Hangout – May 19, 2017: Eric Fisher of Labfundr

Host: Fraser Cain (@fcain)

Special Guest:
Eric Fisher is the head of Labfundr, a Canadian crowdsourcing platform for science research and outreach. Eric is an entrepreneur, recovering biochemist, and son of a glaciologist. He completed a PhD in Biochemistry & Molecular Biology at Dalhousie University in Halifax, Nova Scotia, Canada. At Dalhousie, Eric investigated how liver cells create and destroy “bad” cholesterol particles. Eric recently founded Labfundr, Canada’s first crowdfunding platform for science, which aims to boost public engagement and investment in research. He stays on his toes by trying to keep up with his dog Joni, who is smarter and faster than him.

Guests:
Dr. Kimberly Cartier ( KimberlyCartier.org / @AstroKimCartier )
Dr. Morgan Rehnberg (MorganRehnberg.com / @MorganRehnberg ChartYourWorld.org)
Alessondra Springmann (@sondy)
Their stories this week:

Explaining massive black hole formation with LIGO

Discovery of a moon around large dwarf planet

More troubles for SLS and here

A Neptune-sized planet that looks like a Jupiter

Rivers on Titan look more like Mars than Earth

We use a tool called Trello to submit and vote on stories we would like to see covered each week, and then Fraser will be selecting the stories from there. Here is the link to the Trello WSH page (http://bit.ly/WSHVote), which you can see without logging in. If you’d like to vote, just create a login and help us decide what to cover!

Announcements:

The WSH recently welcomed back Mathew Anderson, author of “Our Cosmic Story,” to the show to discuss his recent update. He was kind enough to offer our viewers free electronic copies of his complete book as well as his standalone update. Complete information about how to get your copies will be available on the WSH webpage – just visit http://www.wsh-crew.net/cosmicstory for all the details.

If you’d like to join Fraser and Paul Matt Sutter on their Tour to Iceland in February 2018, you can find the information at astrotouring.com.

If you would like to join the Weekly Space Hangout Crew, visit their site here and sign up. They’re a great team who can help you join our online discussions!

We record the Weekly Space Hangout every Friday at 12:00 pm Pacific / 3:00 pm Eastern. You can watch us live on Universe Today, or the Universe Today YouTube page

Dinosaur Killing Asteroid Hit in Exactly the Wrong Place

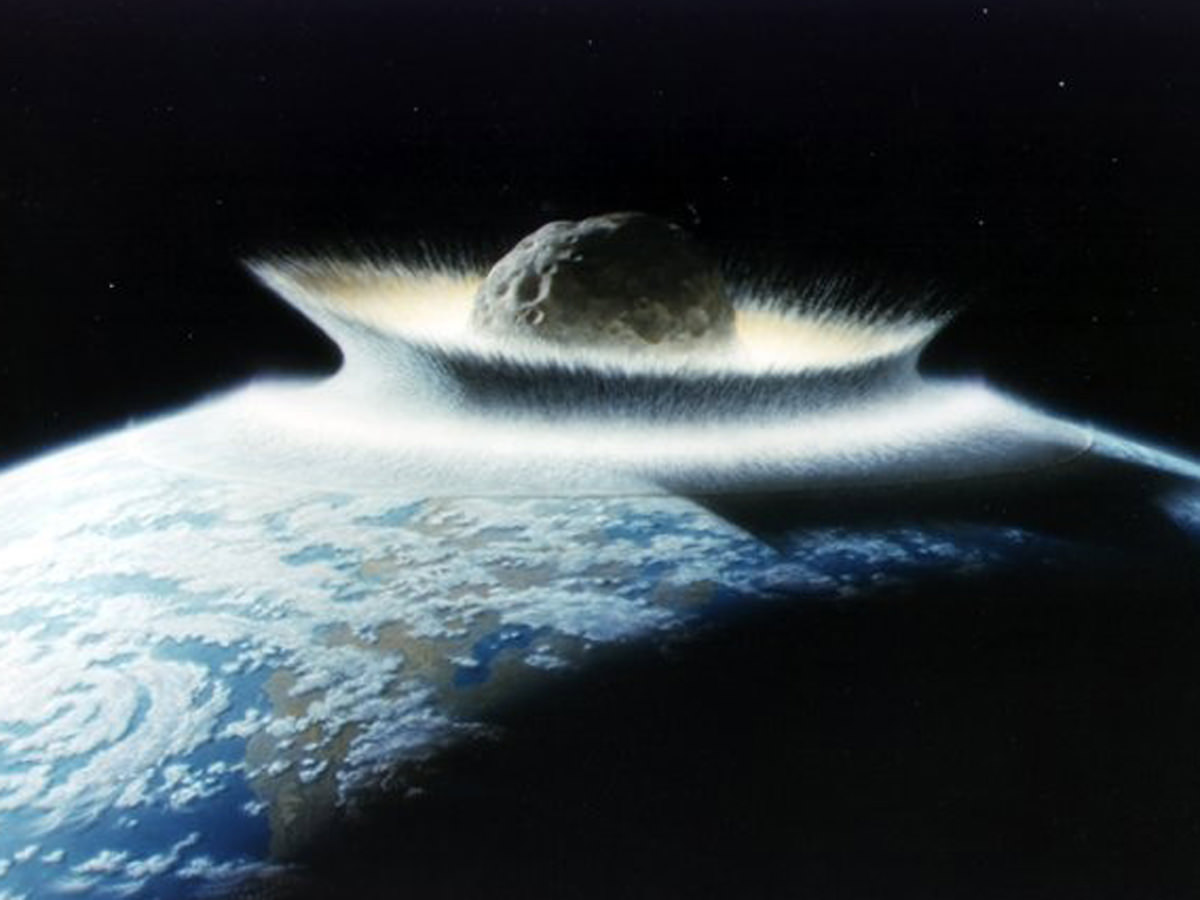
When an asteroid struck the Yucatan region about 66 million years ago, it triggered the extinction of the dinosaurs. ESA's Hera mission is visiting the smallest spacerock ever as part of our effort to not get creamed by an asteroid. Credit: NASA/Don Davis

The asteroid that struck Earth about 66 million years ago and led to the mass extinction of dinosaurs may have hit one of the worst places possible as far as life on Earth was concerned. When it struck, the resulting cataclysm choked the atmosphere with sulphur, which blocked out the Sun. Without the Sun, the food chain collapsed, and it was bye-bye dinosaurs, and bye-bye most of the other life on Earth, too.

But, as it turns out, if it had struck a few moments earlier or later, it would not have hit the Yucatan, and things may have turned out differently. Why? Because of the concentration of the mineral gypsum in that area.

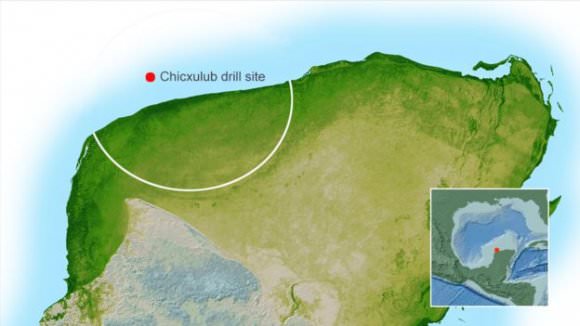
The place where the asteroid hit Earth is called the Chicxulub Crater, and scientists have been studying that area to try to learn more about the impact event that altered the course of life on Earth. An upcoming BBC documentary called “The Day The Dinosaurs Died,” focuses on what happened when the asteroid struck. Drill-core samples from the Yucatan area help explain the events that followed the impact.

The drilling rig off the coast of the Yucatan. The rig was there in the Spring of 2016 obtaining samples from the seafloor. Image: BBC/Barcroft Productions.

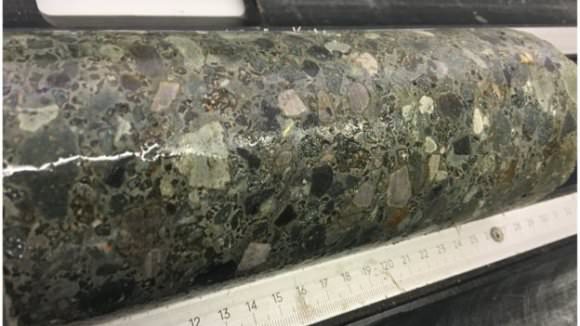
The core samples, which are from as deep as 1300 m beneath the Gulf of Mexico, are from a feature called the peak ring.

When the asteroid struck Earth, it excavated a crater 100 km across and 30 km deep. This crater collapsed into a wider but shallower crater 200 km across and a few km deep. Then the center of the crater rebounded, and collapsed again, leaving the peak ring feature. The Chicxulub crater is now partly under water, and that’s where a drilling rig was set up to take samples.

The peak ring is at the center of the crater, offshore of the Yucatan Peninsula. Image: NASA/BBC

The core samples revealed rock that has been heavily fractured and altered by immense pressures. The same impact that altered those rocks would have generated an enormous amount of heat, and that heat created an enormous cloud of sulphur from the vaporized gypsum. That cloud persisted, which led to a global winter. Temperatures dropped, plant growth came to a standstill, and the course of events on Earth were altered forever.

“Had the asteroid struck a few moments earlier or later, rather than hitting shallow coastal waters it might have hit deep ocean,” documentary co-presenter Ben Garrod told the BBC.

“This is where we get to the great irony of the story – because in the end it wasn’t the size of the asteroid, the scale of blast, or even its global reach that made dinosaurs extinct – it was where the impact happened,” said Ben Garrod, who presents “The Day The Dinosaurs Died” with Alice Roberts.

“An impact in the nearby Atlantic or Pacific oceans would have meant much less vaporised rock – including the deadly gypsum. The cloud would have been less dense and sunlight could still have reached the planet’s surface, meaning what happened next might have been avoided,” said Garrod.

In the documentary, host Alice Roberts will also visit a quarry in New Jersey, where fossil evidence shows a massive die-off in a very short period of time. In fact, these creatures could have died on the very day that the asteroid struck.

The core samples from the drilling rig show rocks that were subjected to immense heat and pressure at the time of the impact. Image: Barcroft Productions/BBC

“All these fossils occur in a layer no more than 10cm thick,” palaeontologist Ken Lacovara tells Alice. “They died suddenly and were buried quickly. It tells us this is a moment in geological time. That’s days, weeks, maybe months. But this is not thousands of years; it’s not hundreds of thousands of years. This is essentially an instantaneous event.”

There’s lots of evidence showing that an asteroid struck Earth about 66 million years ago, causing widespread extinction. NASA satellite images clearly show crater features, now obscured by 66 million years of geological activity, but still visible.

There’s also what’s called the K-T Boundary, or Cretaceous-Tertiary Boundary. It’s a geological signature dating to 66 million years ago, which marks the end of the Cretaceous Period. In that boundary is a layer of iridium at very high concentrations, much higher than is normally present in the Earth’s crust. Since iridium is much more abundant in asteroids, the conclusion is that it was probably deposited by an asteroid.

But this is the first evidence that shows how critical the actual location of the event may have been. If it had not struck where it had, dinosaurs may never have gone extinct, you and I would not be here, and things on Earth could look much different.

It might sound like the stuff of science fiction, but who knows? Maybe a race of intelligent lizards might already have mastered interstellar travel.

Mysterious Flashes Coming From Earth That Puzzled Carl Sagan Finally Have An Explanation

Sun glints off atmospheric ice crystals (circled in red) in this view captured by NASA's EPIC instrument on NOAA's DISCOVR satellite. Image Credit: NASA's Goddard Space Flight Center

Back in 1993, Carl Sagan encountered a puzzle. The Galileo spacecraft spotted flashes coming from Earth, and nobody could figure out what they were. They called them ‘specular reflections’ and they appeared over ocean areas but not over land.

The images were taken by the Galileo space probe during one of its gravitational-assist flybys of Earth. Galileo was on its way to Jupiter, and its cameras were turned back to look at Earth from a distance of about 2 million km. This was all part of an experiment aimed at finding life on other worlds. What would a living world look like from a distance? Why not use Earth as an example?

Fast-forward to 2015, when the National Oceanographic and Atmospheric Administration (NOAA) launched the Deep Space Climate Observatory (DSCOVER) spacecraft. DSCOVER’s job is to orbit Earth a million miles away and to warn us of dangerous space weather. NASA has a powerful instrument on DSCOVER called the Earth Polychromatic Imaging Camera (EPIC.)

Every hour, EPIC takes images of the sunlit side of Earth, and these images can be viewed on the EPIC website. (Check it out, it’s super cool.) People began to notice the same flashes Sagan saw, hundreds of them in one year. Scientists in charge of EPIC started noticing them, too.

One of the scientists is Alexander Marshak, DSCOVR deputy project scientist at NASA’s Goddard Space Flight Center in Greenbelt, Maryland. At first, he noticed them only over ocean areas, the same as Sagan did 25 years ago. Only after Marshak began investigating them did he realize that Sagan had seen them too.

Back in 1993, Sagan and his colleagues wrote a paper discussing the results from Galileo’s examination of Earth. This is what they said about the reflections they noticed: “Large expanses of blue ocean and apparent coastlines are present, and close examination of the images shows a region of [mirror-like] reflection in ocean but not on land.”

Marshak surmised that there could be a simple explanation for the flashes. Sunlight hits a smooth part of an ocean or lake, and reflects directly back to the sensor, like taking a flash-picture in a mirror. Was it really that much of a mystery?

When Marshak and his colleagues took another look at the Galileo images showing the flashes, they found something that Sagan missed back in 1993: The flashes appeared over land masses as well. And when they looked at the EPIC images, they found flashes over land masses. So a simple explanation like light reflecting off the oceans was no longer in play.

“We found quite a few very bright flashes over land as well.” – Alexander Marshak, DSCOVR Deputy Project Scientist

“We found quite a few very bright flashes over land as well,” he said. “When I first saw it I thought maybe there was some water there, or a lake the sun reflects off of. But the glint is pretty big, so it wasn’t that.”

But something was causing the flashes, something reflective. Marshak and his colleagues, Tamas Varnai of the University of Maryland, Baltimore County, and Alexander Kostinski of Michigan Technological University, thought of other ways that water could cause the flashes.

The primary candidate was ice particles high in Earth’s atmosphere. High-altitude cirrus clouds contain tiny ice platelets that are horizontally aligned almost perfectly. The trio of scientists did some experiments to find the cause of the flashes, and published their results in a new paper published in Geophysical Research Letters.

“Lightning doesn’t care about the sun and EPIC’s location.” – Alexander Marshak, DSCOVR Deputy Project Scientist

As their study details, they first catalogued all of the reflective glints that EPIC found over land; 866 of them in a 14 month period from June 2015 to August 2016. If these flashes were caused by reflection, then they would only appear on locations on the globe where the angle between the Sun and Earth matched the angle between the DSCOVER spacecraft and Earth. As the catalogued the 866 glints, they found that the angle did match.

This ruled out something like lightning as the cause of the flashes. But as they continued their work plotting the angles, they came to another conclusion: the flashes were sunlight reflecting off of horizontal ice crystals in the atmosphere. Other instruments on DSCOVR confirmed that the reflections were coming from high in the atmosphere, rather than from somewhere on the surface.

“The source of the flashes is definitely not on the ground. It’s definitely ice, and most likely solar reflection off of horizontally oriented particles.” -Alexander Marshak, DSCOVR Deputy Project Scientist

Mystery solved. But as is often the case with science, answering one question leads to a couple other questions. Could detecting these glints be used in the study of exoplanets somehow? But that’s one for the space science community to answer.

As for Marshak, he’s an Earth scientist. He’s investigating how common these horizontal ice particles are, and what effect they have on sunlight. If that impact is measurable, then it could be included in climate modelling to try to understand how Earth retains and sheds heat.

Sources:

New Estimate Puts the Supernova Killzone Within 50 Light-Years of Earth

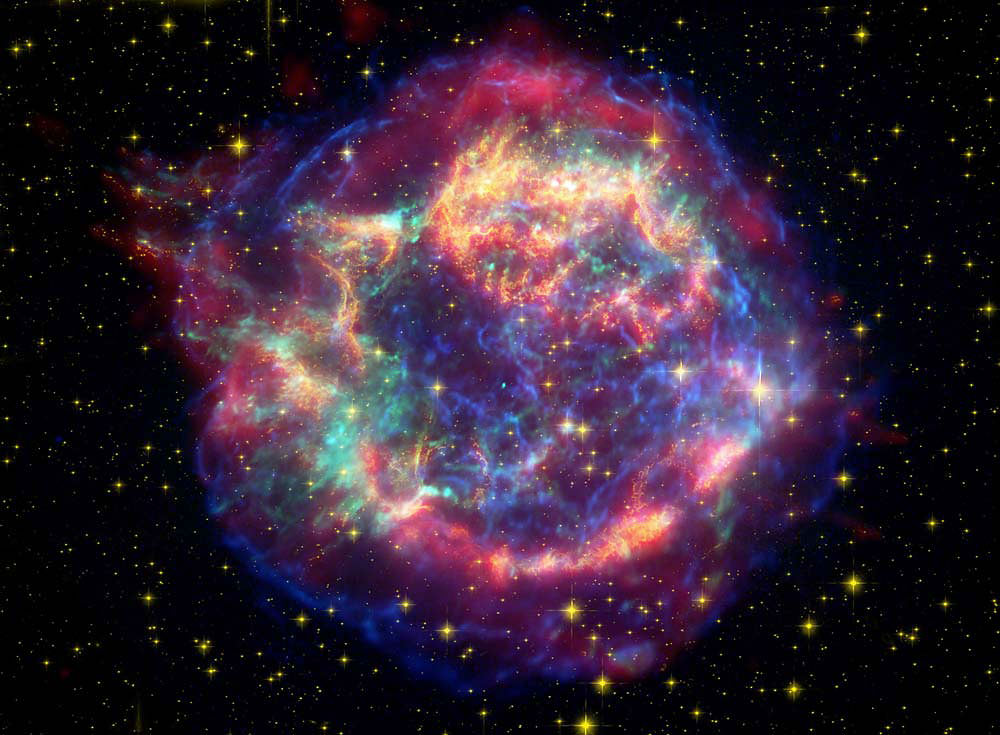
Composite Spitzer, Hubble, and Chandra image of supernova remnant Cassiopeia A. A new study shows that a supernova as far away as 50 light years could have devastating effects on life on Earth. (NASA/JPL-Caltech/STScI/CXC/SAO)

There are a lot of ways that life on Earth could come to an end: an asteroid strike, global climate catastrophe, or nuclear war are among them. But perhaps the most haunting would be death by supernova, because there’s absolutely nothing we could do about it. We’d be sitting ducks.

New research suggest that a supernova’s kill zone is bigger than we thought; about 25 light years bigger, to be exact.

Iron in the Ocean

In 2016, researchers confirmed that Earth has been hit with the effects from multiple supernovae. The presence of iron 60 in the seabed confirms it. Iron 60 is an isotope of iron produced in supernova explosions, and it was found in fossilized bacteria in sediments on the ocean floor. Those iron 60 remnants suggest that two supernovae exploded near our solar system, one between 6.5 to 8.7 million years ago, and another as recently as 2 million years ago.

Iron 60 is extremely rare here on Earth because it has a short half life of 2.6 million years. Any of the iron 60 created at the time of Earth’s formation would have decayed into something else by now. So when researchers found the iron 60 on the ocean floor, they reasoned that it must have another source, and that logical source is a supernova.

This evidence was the smoking gun for the idea that Earth has been struck by supernovae. But the questions it begs are, what effect did that supernova have on life on Earth? And how far away do we have to be from a supernova to be safe?

“…we can look for events in the history of the Earth that might be connected to them (supernova events).” – Dr. Adrian Melott, Astrophysicist, University of Kansas.

In a press release from the University of Kansas, astrophysicist Adrian Melott talked about recent research into supernovae and the effects they can have on Earth. “This research essentially proves that certain events happened in the not-too-distant past,” said Melott, a KU professor of physics and astronomy. “They make it clear approximately when they happened and how far away they were. Knowing that, we can consider what the effect may have been with definite numbers. Then we can look for events in the history of the Earth that might be connected to them.”

Earlier work suggested that a supernova kill zone is about 25-30 light years. If a supernova exploded that close to Earth, it would trigger a mass extinction. Bye-bye humanity. But new work suggests that 25 light years is an under-estimation, and that a supernova 50 light years away would be powerful enough to cause a mass extinction.

Supernovae: A Force Driving Evolution?

But extinction is just one effect a supernova could have on Earth. Supernovae can have other effects, and they might not all be negative. It’s possible that a supernovae about 2.6 million years ago even drove human evolution.

“Our local research group is working on figuring out what the effects were likely to have been,” Melott said. “We really don’t know. The events weren’t close enough to cause a big mass extinction or severe effects, but not so far away that we can ignore them either. We’re trying to decide if we should expect to have seen any effects on the ground on the Earth.”

Melott and his colleagues have written a new paper that focuses on the effects a supernova might have on Earth. In a new paper titled “A SUPERNOVA AT 50 PC: EFFECTS ON THE EARTH’S ATMOSPHERE AND BIOTA”, Melott and a team of researchers tried to shed light on Earth-supernova interactions.

The Local Bubble

There are a number of variables that come into play when trying to determine the effects of a supernova, and one of them is the idea of the Local Bubble. The Local Bubble itself is the result of one or more supernova explosion that occurred as long as 20 million years ago. The Local Bubble is a 300 light year diameter bubble of expanding gas in our arm of the Milky Way galaxy, where our Solar System currently resides. We’ve been travelling through it for the last five to ten million years. Inside this bubble, the magnetic field is weak and disordered.

Melott’s paper focused on the effects that a supernova about 2.6 million years ago would have on Earth in two instances: while both were within the Local Bubble, and while both were outside the Local Bubble.

The disrupted magnetic field inside the Local Bubble can in essence magnify the effects a supernova can have on Earth. It can increase the cosmic rays that reach Earth by a factor of a few hundred. This can increase the ionization in the Earth’s troposphere, which mean that life on Earth would be hit with more radiation.

Outside the Local Bubble, the magnetic field is more ordered, so the effect depends on the orientation of the magnetic field. The ordered magnetic field can either aim more radiation at Earth, or it could in a sense deflect it, much like our magnetosphere does now.

Focusing on the Pleistocene

Melott’s paper looks into the connection between the supernova and the global cooling that took place during the Pleistocene epoch about 2.6 million years ago. There was no mass extinction at that time, but there was an elevated extinction rate.

According to the paper, it’s possible that increased radiation from a supernova could have changed cloud formation, which would help explain a number of things that happened at the beginning of the Pleistocene. There was increased glaciation, increased species extinction, and Africa grew cooler and changed from predominantly forests to semi-arid grasslands.

Cancer and Mutation

As the paper concludes, it is difficult to know exactly what happened to Earth 2.6 million years ago when a supernova exploded in our vicinity. And it’s difficult to pinpoint an exact distance at which life on Earth would be in trouble.

But high levels of radiation from a supernova could increase the cancer rate, which could contribute to extinction. It could also increase the mutation rate, another contributor to extinction. At the highest levels modeled in this study, the radiation could even reach one kilometer deep into the ocean.

There is no real record of increased cancer in the fossil record, so this study is hampered in that sense. But overall, it’s a fascinating look at the possible interplay between cosmic events and how we and the rest of life on Earth evolved.

Sources:

Early Earth Was Almost Entirely Underwater, With Just A Few Islands

Earth's Hadean Eon is a bit of a mystery to us, because geologic evidence from that time is scarce. Researchers at the Australian National University have used tiny zircon grains to get a better picture of early Earth. Credit: NASA

It might seem unlikely, but tiny grains of minerals can help tell the story of early Earth. And researchers studying those grains say that 4.4 billion years ago, Earth was a barren, mountainless place, and almost everything was under water. Only a handful of islands poked above the surface.

Continue reading “Early Earth Was Almost Entirely Underwater, With Just A Few Islands”

NASA Releases Spellbinding Images Of Earth At Night

Composite image of continental U.S. at night, 2016. Credits: NASA Earth Observatory images by Joshua Stevens, using Suomi NPP VIIRS data from Miguel Román, NASA's Goddard Space Flight Center

NASA strives to explore space and to expand our understanding of our Solar System and beyond. But they also turn their keen eyes on Earth in an effort to understand how our planet is doing. Now, they’re releasing a new composite image of Earth at night, the first one since 2012.

We’ve grown accustomed to seeing these types of images in our social media feeds, especially night-time views of Earth from the International Space Station. But this new image is much more than that. It’s part of a whole project that will allow scientists—and the rest of us—to study Earth at night in unprecedented detail.

Night-time views of Earth have been around for 25 years or so, usually produced several years apart. Comparing those images shows clearly how humans are changing the face of the planet. Scientists have been refining the imaging over the years, producing better and more detailed images.

The team behind this is led by Miguel Román of NASA’s Goddard Space Flight Center. They’ve been analyzing data and working on new software and algorithms to improve the quality, clarity, and availability of the images.

This new work stems from a collaboration between the National Oceanic and Atmospheric Administration (NOAA) and NASA. In 2011, NASA and NOAA launched a satellite called the Suomi National Polar-orbiting Partnership (NPP) satellite. The key instrument on that satellite is the Visible Infrared Imaging Radiometer Suite (VIIRS), a 275 kg piece of equipment that is a big step forward in Earth observation.

VIIRS detects photons of light in 22 different wavelengths. It’s the first satellite instrument to make quantitative measurements of light emissions and reflections, which allows researchers to distinguish the intensity, types and the sources of night lights over several years.

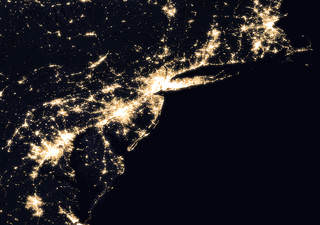
Composite image of Mid-Atlantic and Northeastern U.S. at night, 2016. Credits: NASA Earth Observatory images by Joshua Stevens, using Suomi NPP VIIRS data from Miguel Román, NASA's Goddard Space Flight Center
Composite image of Mid-Atlantic and Northeastern U.S. at night, 2016.
Credits: NASA Earth Observatory images by Joshua Stevens, using Suomi NPP VIIRS data from Miguel Román, NASA’s Goddard Space Flight Center

Producing these types of maps is challenging. The raw data from SUOMI NPP and its VIIRS instrument has to be skillfully manipulated to get these images. The main challenge is the Moon itself.

As the Moon goes through its different phases, the amount of light hitting Earth is constantly changing. Those changes are predictable, but they still have to be accounted for. Other factors have to be managed as well, like seasonal vegetation, clouds, aerosols, and snow and ice cover. Other changes in the atmosphere, though faint, also affect the outcome. Phenomenon like auroras change the way that light is observed in different parts of the world.

The newly released maps were made from data throughout the year, and the team developed algorithms and code that picked the clearest night views each month, ultimately combining moonlight-free and moonlight-corrected data.

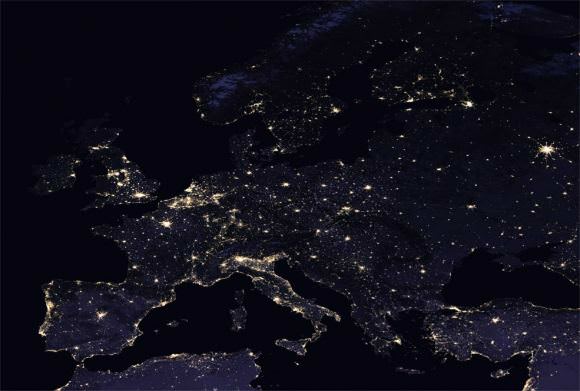
A glittering night-time map of Europe. Looks like there's a Kraftwerk concert happening in Dusseldorf! NASA Earth Observatory images by Joshua Stevens, using Suomi NPP VIIRS data from Miguel Román, NASA's Goddard Space Flight Center
A glittering night-time map of Europe. Looks like there’s a Kraftwerk concert happening in Dusseldorf! NASA Earth Observatory images by Joshua Stevens, using Suomi NPP VIIRS data from Miguel Román, NASA’s Goddard Space Flight Center

The SUOMI NPP satellite is in a polar orbit, and it observes the planet in vertical swaths that are about 3,000 km wide. With its VIIRS instrument, it images almost every location on the surface of the Earth, every day. VIIRS low-light sensor has six times better spatial resolution for distinguishing night lights, and 250 times better resolution overall than previous satellites.

What do all those numbers mean? The team hopes that their new techniques, combined with the power of VIIRS, will create images with extraordinary resolution: the ability to distinguish a single highway lamp, or fishing boat, anywhere on the surface of Earth.

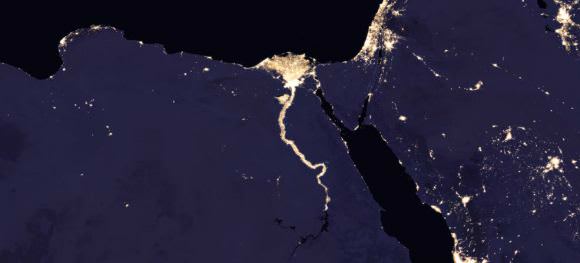
Composite image of Nile River and surrounding region at night, 2016. Credits: NASA Earth Observatory images by Joshua Stevens, using Suomi NPP VIIRS data from Miguel Román, NASA's Goddard Space Flight Center
Composite image of Nile River and surrounding region at night, 2016.
Credits: NASA Earth Observatory images by Joshua Stevens, using Suomi NPP VIIRS data from Miguel Román, NASA’s Goddard Space Flight Center

Beyond thought-provoking eye-candy for the rest of us, these images of night-time Earth have practical benefits to researchers and planners.

“Thanks to VIIRS, we can now monitor short-term changes caused by disturbances in power delivery, such as conflict, storms, earthquakes and brownouts,” said Román. “We can monitor cyclical changes driven by reoccurring human activities such as holiday lighting and seasonal migrations. We can also monitor gradual changes driven by urbanization, out-migration, economic changes, and electrification. The fact that we can track all these different aspects at the heart of what defines a city is simply mind-boggling.”

These three composite images provide full-hemisphere views of Earth at night. The clouds and sun glint — added here for aesthetic effect — are derived from MODIS instrument land surface and cloud cover products. Credits: NASA Earth Observatory images by Joshua Stevens, using Suomi NPP VIIRS data from Miguel Román, NASA's Goddard Space Flight Center
These three composite images provide full-hemisphere views of Earth at night. The clouds and sun glint — added here for aesthetic effect — are derived from MODIS instrument land surface and cloud cover products.
Credits: NASA Earth Observatory images by Joshua Stevens, using Suomi NPP VIIRS data from Miguel Román, NASA’s Goddard Space Flight Center

These maps of night-time Earth are a powerful tool. But the newest development will be a game-changer: Román and his team aim to provide daily, high-definition views of Earth at night. Daily updates will allow real-time tracking of changes on Earth’s surface in a way never before possible.

Maybe the best thing about these upcoming daily night-time light maps is that they will be publicly available. The SUOMI NPP satellite is not military and its data is not classified in any way. They hope to have these daily images available later this year. Once the new daily light-maps of Earth are available, it’ll be another powerful tool in the hands of researchers and planners, and the rest of us.

These maps will join other endeavours like NASA-EOSDIS Worldview. Worldview is a fascinating, easy-to-use data tool that anyone can access. It allows users to look at satellite images of the Earth with user-selected layers for things like dust, smoke, draught, fires, and storms. It’s a powerful tool that can change how you understand the world.

What is an Astronomical Unit?

Apsis
The Earth revolves around the Sun like this.

When it comes to dealing with the cosmos, we humans like to couch things in familiar terms. When examining exoplanets, we classify them based on their similarities to the planets in our own Solar System – i.e. terrestrial, gas giant, Earth-size, Jupiter-sized, Neptune-sized, etc. And when measuring astronomical distances, we do much the same.

For instance, one of the most commonly used means of measuring distances across space is known as an Astronomical Unit (AU). Based on the distance between the Earth and the Sun, this unit allows astronomers to characterize the vast distances between the Solar planets and the Sun, and between extra-solar planets and their stars.

Definition:

According to the current astronomical convention, a single Astronomical Unit is equivalent to 149,597,870.7 kilometers (or 92,955,807 miles). However, this is the average distance between the Earth and the Sun, as that distance is subject to variation during Earth’s orbital period. In other words, the distance between the Earth and the Sun varies in the course of a single year.

Earth’s orbit around the Sun, showing its average distance (or 1 AU). Credit: Huritisho/Wikipedia Commons

During the course of a year, the Earth goes from distance of 147,095,000 km (91,401,000 mi) from the Sun at perihelion (its closest point) to 152,100,000 km (94,500,000 mi) at aphelion (its farthest point) – or from a distance of 0.983 AUs to 1.016 AUs.

History of Development:

The earliest recorded example of astronomers estimating the distance between the Earth and the Sun dates back to Classical Antiquity. In the 3rd century BCE work, On the Sizes and Distances of the Sun and Moon – which is attributed to Greek mathematician Aristarchus of Samos – the distance was estimated to be between 18 and 20 times the distance between the Earth and the Moon.

However, his contemporary Archimedes, in his 3rd century BCE work Sandreckoner, also claimed that Aristarchus of Samos placed the distance of 10,000 times the Earth’s radius. Depending on the values for either set of estimates, Aristarchus was off by a factor of about 2 (in the case of Earth’s radius) to 20 (the distance between the Earth and the Moon).

The oldest Chinese mathematical text – the 1st century BCE treatise known as Zhoubi Suanjing – also contains an estimate of the distance between the Earth and Sun. According to the anonymous treatise, the distance could be calculated by conducting geometric measurements of the length of noontime shadows created by objects spaced at specific distances. However, the calculations were based on the idea that the Earth was flat.

Illustration of the Ptolemaic geocentric conception of the Universe, by Bartolomeu Velho (?-1568), from his work Cosmographia, made in France, 1568. Credit: Bibilotèque nationale de France, Paris

Famed 2nd century CE mathematician and astronomer Ptolemy relied on trigonometric calculations to come up with a distance estimate that was equivalent to 1210 times the radius of the Earth. Using records of lunar eclipses, he estimated the Moon’s apparent diameter, as well as the apparent diameter of the shadow cone of Earth traversed by the Moon during a lunar eclipse.

Using the Moon’s parallax, he also calculated the apparent sizes of the Sun and the Moon and concluded that the diameter of the Sun was equal to the diameter of the Moon when the latter was at it’s greatest distance from Earth. From this, Ptolemy arrived at a ratio of solar to lunar distance of approximately 19 to 1, the same figure derived by Aristarchus.

For the next thousand years, Ptolemy’s estimates of the Earth-Sun distance (much like most of his astronomical teachings) would remain canon among Medieval European and Islamic astronomers. It was not until the 17th century that astronomers began to reconsider and revise his calculations.

This was made possible thanks to the invention of the telescope, as well as Kepler’s Three Laws of Planetary Motion, which helped astronomers calculate the relative distances between the planets and the Sun with greater accuracy. By measuring the distance between Earth and the other Solar planets, astronomers were able to conduct parallax measurements to obtain more accurate values.

With parallax technique, astronomers observe object at opposite ends of Earth’s orbit around the Sun to precisely measure its distance. Credit: Alexandra Angelich, NRAO/AUI/NSF.

By the 19th century, determinations of about the speed of light and the constant of the aberration of light resulted in the first direct measurement of the Earth-Sun distance in kilometers.  By 1903, the term “astronomical unit” came to be used for the first time. And throughout the 20th century, measurements became increasingly precise and sophisticated, thanks in part to accurate observations of the effects of Einstein’s Theory of Relativity.

Modern Usage:

By the 1960s, the development of direct radar measurements, telemetry, and the exploration of the Solar System with space probes led to precise measurements of the positions of the inner planets and other objects. In 1976, the International Astronomical Union (IAU) adopted a new definition during their 16th General Assembly. As part of their System of Astronomical Constants, the new definition stated:

“The astronomical unit of length is that length (A) for which the Gaussian gravitational constant (k) takes the value 0.01720209895 when the units of measurement are the astronomical units of length, mass and time. The dimensions of k² are those of the constant of gravitation (G), i.e., L³M-1T2. The term “unit distance” is also used for the length A.”

In response to the development of hyper-precise measurements, the International Committee for Weights and Measures (CIPM) decided to modify the the International System of Units (SI) in 1983. Consistent with this, they redefined the meter to be measured in terms of the speed of light in vacuum.

Infographic comparing the orbit of the planet around Proxima Centauri (Proxima b) with the same region of the Solar System. Credit: ESO

However, by 2012, the IAU determined that the equalization of relativity made the measurement of AUs too complex, and redefined the astronomical unit in terms of meters. In accordance with this, a single AU is equal to 149597870.7 km exactly (92.955807 million miles), 499 light-seconds, 4.8481368×10⁻⁶ of a parsec, or 15.812507×10⁻⁶ of a light-year.

Today, the AU is used commonly to measure distances and create numerical models for the Solar System. It is also used when measuring extra-solar systems, calculating the extent of protoplanetary clouds or the distance between extra-solar planets and their parent star. When measuring interstellar distances, AUs are too small to offer convenient measurements. As such, other units – such as the parsec and the light year – are relied upon.

The Universe is a huge place, and measuring even our small corner of it producing some staggering results. But as always, we prefer to express them in ways that are as relatable and familiar.

We’ve written many interesting articles about distances in the Solar System here at Universe Today. Here’s How Far are the Planets from the Sun?, How Far is Mercury from the Sun?, How Far is Venus from the Sun?, How Far is Earth from the Sun?, How Far is Mars from the Sun?, How Far is Jupiter from the Sun?, How Far is Saturn from the Sun?, How Far is Uranus from the Sun?, How Far is Neptune from the Sun?, How Far is Pluto from the Sun?

If you’d like more information about the Earth’s orbit, check out NASA’s Solar System Exploration page.

We’ve also recorded an episode of Astronomy Cast dedicated to the measurement of distances in astronomy. Listen here, Episode 10: Measuring Distance in the Universe.

Sources:

New Study Wants To Rip T-Rex From Its Place On Dino Tree

A reconstruction of a T. Rex at the Field Museum of Natural History, Chicago. This is Sue, the world's largest and most complete dinosaur skeleton. Image: By Connie Ma Uploaded by FunkMonk, CC BY-SA 2.0, https://commons.wikimedia.org/w/index.php?curid=20207230

To kids, there are only two kinds of dinosaurs: meat-eaters and plant-eaters. But to paleontologists, those are just diet distinctions. Paleontologists divide dinos into two different groups based largely on pelvic structure: reptile-hipped saurischians, and bird-hipped ornithischians.

Those two categories are called ‘clades’, and they’re fundamental to the study of dinosaurs. But a new study is casting doubt on those two groups, as well as moving the infamous Tyrannosaurus Rex to a new spot on the dinosaur family tree.

The study, by Matthew G. Baron, David B. Norman & Paul M. Barrett, was published in the journal Nature. If the findings in this study are accepted by paleontologists, then it will upset our understanding of the family tree that was first established in Victorian times.

Pelvic Structure of a reptile-hipped saurischian. Image: By Fred the Oyster, CC BY-SA 4.0, https://commons.wikimedia.org/w/index.php?curid=35371104
Pelvic structure of a bird-hipped ornithischian. Image: By Fred the Oyster, CC BY-SA 4.0, https://commons.wikimedia.org/w/index.php?curid=35371104

The T. Rex is the most famous member of the reptile-hipped saurischians. Many other carnivorous theropods are saurischians too, like Giganotosaurus and Spinosaurus. Other famous dinosaurs, like Stegosaurus, are bird-hipped ornithischians. The distinction between the saurischians and the ornithischians has been workable for a long time. But there were always problems with the two clades of dinosaurs.

The Dinosaur Family Tree. Image: By Evolution_of_dinosaurs_by_Zureks.svg: Zureksderivative work: Woudloper (talk) – Evolution_of_dinosaurs_by_Zureks.svg, CC BY-SA 3.0, https://commons.wikimedia.org/w/index.php?curid=6321464

Some of the earliest ornithischian dinosaurs in the Triassic period had some theropod qualities: they were bipedal and probably meat-eaters. This clouded the separation between ornithischians and saurischians. There are also the herrerasaurids, small dinosaurs not larger than 4 meters long. They were some of the earliest dinosaurs, carnivores that look like both sauropods and theropods, and even though they appear early in the fossil record, they are not considered ancestors to any other group of dinosaurs. They show a mixture of both primitive and derived traits.

Huge plant-eating sauropods like the Brontosaurus and the Diplodocus are included in the reptile-hipped saurischians with the meat-eating theropods, even though there are some key skeletal differences between the two groups.

Another problem centers around birds. Believe it or not, birds have theropods as ancestors, even though theropods are in the reptile-hipped clade, rather than the bird-hipped clade.

Are You Confused Yet?

If this all seems kind of confusing, let’s back up for a minute.

When we think of dinosaurs, we tend to think of full-scale rebuilt skeletons of the type on display in museums around the world. But for paleontologists, the reality is much different. Many dinosaur species are known only by a few bones or teeth. These samples are studied in great detail. Any groove in a bone or slightly different shape in a tooth is analyzed, and out of this a dinosaur family tree is constructed.

It’s hard work, and our fossil record is spotty at best. Some new dinosaur taxa are proposed based only on the discovery of isolated teeth in the fossil record. With all of this in mind, you can see that the dinosaur family tree is an ongoing work in progress.

The authors of the study say that many ornithischian dinosaurs were overlooked in the past, because paleontologists didn’t really know what to do with them. Many of the ornithischians had weird traits like extra chin bones and molar-like teeth in their cheeks. These ornithischian dinos were thought of as oddities, early offshoots from other species.

New Clades

The authors studied 457 traits in 74 taxa, looking at details like the shapes of tiny eye-socket bones and grooves on femurs. They found that Theropods, even though they have reptile-like hips, don’t belong in the saurischian clade. They’re suggesting that Theropods are a sister clade to the ornithischians. The revised grouping of Ornithischia and Theropoda has been named the Ornithoscelida. The authors are also proposing that the herrerasaurids did not branch off as early as previously thought, and should form a sister clade with the sauropods.

But this study does even more. It’s been long understood by paleontologists that dinosaurs appeared in the southern hemisphere first. That’s where the herrerasaurids were found, dating back to 240 million years ago. The authors remind us that there are very few Herrerasaurus skeletons and bones, and there are uncertainties in the age of the Triassic fossil beds where herrerasaurids are found. A nearly complete skeleton was found in Argentina, and less complete ones have been found in North America.

But this shuffling of the family tree moves the herrerasaurids further away from the base of the tree. Remember, the herrerasaurids look like both sauropods and theropods, and they show both derived and primitive traits. If it’s accepted that the herrerasaurids did not appear as early as thought, that might mean that dinos did not appear first in the southern hemisphere. The authors say that some enigmatic fossils found in the northern hemisphere should be re-examined in case they are earlier than the ones found in the south.

Enter the Saltopus

A fossil of a cat-like creature found in Scotland, called the Saltopus, is a part of the shake-up of the dinosaur family tree. It was considered a pre-cursor to dinosaurs, rather than a true dinosaur. As part of their analysis, the Saltopus has been re-positioned in the earliest part of the dinosaur lineage, as the first true dinosaur. This supports the idea that dinosaurs appeared first in the northern hemisphere rather than the south.

The Saltopus, a small cat-sized dinosaur found in Scotland. If it is the first dinosaur, that means dinosaurs originated in the northern hemisphere rather than the south. Image: By Nobu Tamura email:[email protected] http://spinops.blogspot.com/ http://paleoexhibit.blogspot.com/ – Own work, CC BY-SA 4.0, https://commons.wikimedia.org/w/index.php?curid=50251442

If this new family tree for dinosaurs is accepted, it will change our understanding of the way dinosaurs evolved. We’ve relied on similarity in hip shape to ascertain ancestry, but that may be a little simplistic.

Our understanding of dinosaurs changes frequently. Remember when dinosaurs were slow, dim-witted creatures with tiny brains and huge bodies? Now we think of dinosaurs as feathered and fast, using cunning and perhaps teamwork to hunt in packs. Remember when the prevailing wisdom was that some dinosaurs got so large and spiny that they were doomed to extinction? That was proven false as well.

If it does stick, this new family tree will be a huge change in paleontology, a field where knowledge is overturned on a regular basis, sometimes by little more than a few teeth.

Astronauts Capture Great Views of Mount Etna Eruption

Mount Etna in Italy, as seen by astronauts on the International Space Station. Credit: NASA/ESA, Image editing by Riccardo Rossi.

Mount Etna is Europe’s most active volcano, and it’s been spouting off since late February 2017. It spewed lava and gas with a rather big eruption last week, where 10 people were actually injured. The Expedition 50 crew on board the International Space Station have been able to capture both day and nighttime views of the activity from orbit.

The stunning view, above, was taken on March 17, 2017. The original photo, which you can see on NASA’s Gateway to Astronaut Photography of Earth website is actually a bit hard to make out. But space enthusiast Riccardo Rossi from Modena, Italy enhanced the original with color correction and increased the contrast with Photoshop. You can see the full version of Rossi’s enhancements on Flickr. .

ESA astronaut Thomas Pesquet took the image below on March 19, and shared it on Twitter, writing, “Mount Etna, in Sicily. The volcano is currently erupting and the molten lava is visible from space, at night! (the red lines on the left).”

A nighttime view from orbit of Mount Etna, erupting on March 19, 2017, taken by ESA astronaut Thomas Pesquet. The red streaks on the lower left are molten lava. See detail below. Credit: NASA/ESA.

This crop shows the glowing lava:

A crop of the above image, showing detail of the glowing lava at night from Mount Etna’s recent activity. Credit: NASA/ESA.

Mount Etna towers above the city of Catania on the island of Sicily. Scientists estimate it has been active for about 500,000 years. The first recorded eruption dates back to 1500 B.C., and it has erupted over 200 times since then.

NASA’s Suomi NPP satellite also spotted nighttime activity from orbit. The image was acquired by the Visible Infrared Imaging Radiometer Suite (VIIRS), using its “day-night band,” which detects light in a range of wavelengths and uses filtering techniques to observe signals such as gas flares, city lights, and reflected moonlight. In this image, it detected the nighttime glow of molten lava.

A view of Sicily and Mount Etna during the dark morning hours of March 16, 2017, taken by the Visible Infrared Imaging Radiometer Suite (VIIRS) on the Suomi NPP satellite. Credit: NASA.

Further reading:
NASA Image of the Day
NASA Earth Observatory