Watch the Effects of Earthquakes Just Hours After They Occur

Princeton University has developed software that can produce realistic “movies” of earthquakes based on complex computer simulations, and these visualizations will be available on the internet within hours of a disastrous upheaval. For example, this video of a 5.7 scale Earthquake off the coast of Peru occurred yesterday, September 22, 2010. “In our view, this could truly change seismic science,” said Princeton’s Jeroen Tromp, a professor of geosciences and applied and computational mathematics, who led the effort. “The better we understand what happens during earthquakes, the better prepared we can be. In addition, advances in understanding seismic waves can aid basic science efforts, helping us understand the underlying physics at work in the Earth’s interior. These visualizations, we believe, will add greatly to the research effort.”

Continue reading “Watch the Effects of Earthquakes Just Hours After They Occur”

Earth Moved Substantially in April 2010 Earthquake

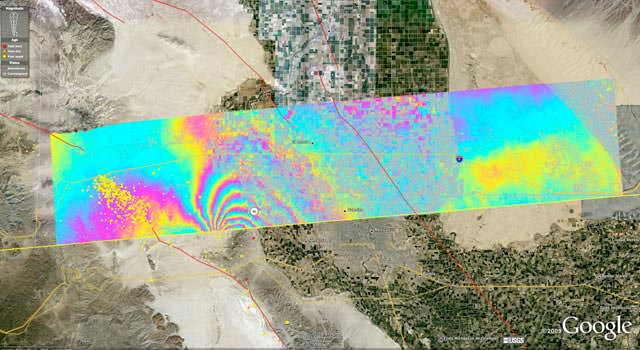
Overview of the UAVSAR interferogram of the magnitude 7.2 Baja California earthquake of April 4, 2010, overlaid atop a Google Earth image of the region. Major fault systems are shown by red lines, while recent aftershocks are denoted by yellow, orange and red dots. Image credit: NASA/JPL/USGS/Google ›

[/caption]


From a JPL press release.

NASA has released the first-ever airborne radar images of the deformation in Earth’s surface caused by a major earth quake — the magnitude 7.2 temblor that rocked Mexico’s state of Baja California and parts of the American Southwest on April 4, 2010. The data reveal that in the area studied, the quake moved the Calexico, Calif., region in a downward and southerly direction up to 80 centimeters (31 inches).

A science team at NASA’s Jet Propulsion Laboratory, Pasadena, Calif., used the JPL-developed Uninhabited Aerial Vehicle Synthetic Aperture Radar (UAVSAR) to measure surface deformation from the quake. The radar flies at an altitude of 12.5 kilometers (41,000 feet) on a Gulfstream-III aircraft from NASA’s Dryden Flight Research Center, Edwards, Calif.

The team used a technique that detects minute changes in the distance between the aircraft and the ground over repeated, GPS-guided flights. The team combined data from flights on Oct. 21, 2009, and April 13, 2010. The resulting maps are called interferograms.

The April 4, 2010, El Mayor-Cucapah earthquake was centered 52 kilometers (32 miles) south-southeast of Calexico, Calif., in northern Baja California. It occurred along a geologically complex segment of the boundary between the North American and Pacific tectonic plates. The quake, the region’s largest in nearly 120 years, was also felt in southern California and parts of Nevada and Arizona. It killed two, injured hundreds and caused substantial damage. There have been thousands of aftershocks, extending from near the northern tip of the Gulf of California to a few miles northwest of the U.S. border. The area northwest of the main rupture, along the trend of California’s Elsinore fault, has been especially active, and was the site of a large, magnitude 5.7 aftershock on June 14.

UAVSAR has mapped California’s San Andreas and other faults along the plate boundary from north of San Francisco to the Mexican border every six months since spring 2009, looking for ground motion and increased strain along faults. “The goal of the ongoing study is to understand the relative hazard of the San Andreas and faults to its west like the Elsinore and San Jacinto faults, and capture ground displacements from larger quakes,” said JPL geophysicist Andrea Donnellan, principal investigator of the UAVSAR project to map and assess seismic hazard in Southern California.

Each UAVSAR flight serves as a baseline for subsequent quake activity. The team estimates displacement for each region, with the goal of determining how strain is partitioned between faults. When quakes do occur during the project, the team will observe their associated ground motions and assess how they may redistribute strain to other nearby faults, potentially priming them to break. Data from the Baja quake are being integrated into JPL’s QuakeSim advanced computer models to better understand the fault systems that ruptured and potential impacts to nearby faults, such as the San Andreas, Elsinore and San Jacinto faults.

One figure (Figure 1) shows a UAVSAR interferogram swath measuring 110 by 20 kilometers (69 by 12.5 miles) overlaid atop a Google Earth image. Each colored contour, or fringe, of the interferogram represents 11.9 centimeters (4.7 inches) of surface displacement. Major fault lines are marked in red, and recent aftershocks are denoted by yellow, orange and red dots.

The quake’s maximum ground displacements of up to 3 meters (10 feet) actually occurred well south of where the UAVSAR measurements stop at the Mexican border. However, these displacements were measured by JPL geophysicist Eric Fielding using synthetic aperture radar interferometry from European and Japanese satellites and other satellite imagery, and by mapping teams on the ground.

Scientists are still working to determine the exact northwest extent of the main fault rupture, but it is clear it came within 10 kilometers (6 miles) of the UAVSAR swath, close to the point where the interferogram fringes converge. “Continued measurements of the region should tell us whether the main fault rupture has moved north over time,” Donnellan said.

An enlargement of the interferogram is shown in another figure (Figure 2), focusing on the area where the largest deformation was measured. The enlargement, which covers an area measuring about 20 by 20 kilometers (12.5 by 12.5 miles), reveals many small “cuts,” or discontinuities, in the fringes. These are caused by ground motions ranging from a centimeter to tens of centimeters (a few inches) on small faults. “Geologists are finding the exquisite details of the many small fault ruptures extremely interesting and valuable for understanding the faults that ruptured in the April 4th quake,” said Fielding. Another figure, (Figure 3) shows a close-up of the region where the magnitude 5.7 aftershock struck.

“UAVSAR’s unprecedented resolution is allowing scientists to see fine details of the Baja earthquake’s fault system activated by the main quake and its aftershocks,” said UAVSAR Principal Investigator Scott Hensley of JPL. “Such details aren’t visible with other sensors.”

UAVSAR is part of NASA’s ongoing effort to apply space-based technologies, ground-based techniques and complex computer models to advance our understanding of quakes and quake processes. The radar flew over Hispaniola earlier this year to study geologic processes following January’s devastating Haiti quake. The data are giving scientists a baseline set of imagery in the event of future quakes. These images can then be combined with post-quake imagery to measure ground deformation, determine how slip on faults is distributed, and learn more about fault zone properties.

UAVSAR is also serving as a flying test bed to evaluate the tools and technologies for future space-based radars, such as those planned for a NASA mission currently in formulation called the Deformation, Ecosystem Structure and Dynamics of Ice, or DESDynI. That mission will study hazards such as earth quakes, volcanoes and landslides, as well as global environmental change.

See all the maps at this webpage.

Chilean Telescopes OK, ESO, Gemini Report

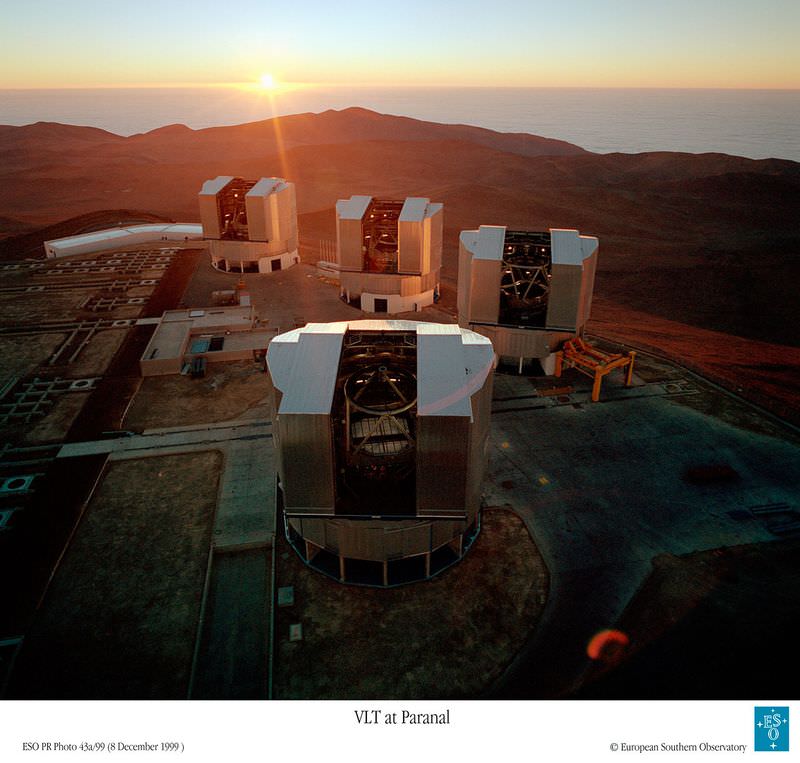
The ESO Very Large Array atop Cerro Paranal, northern Chile (ESO).

[/caption]

The European Southern Observatory, which has several telescopes housed in the mountains of Chile, issued a press release that none of the observatories suffered any damage, and they have no reports of any staff that were injured or killed in the magnitutde 8.8 earthquake that struck central Chile on February 27, 2010:

Despite being the 7th strongest earthquake ever recorded worldwide, the ESO observatory sites did not suffer any damage, partly as they are engineered to withstand seismic activity and partly due to their distances from the epicentre. At La Silla, a power cut caused observations to stop during the night. Paranal Observatory, the APEX telescope and the ALMA Operations Support Facility and Array Operations Site were unaffected.

Additionally, the Gemini South Observatory posted on their website that they experienced no significant damage:

Sunset over Gemini South. Credit: Gemini

Gemini was fortunate that there were no significant structural damages to any of our facilities. The earthquake disrupted observations on early Saturday morning for less than 30 minutes. Subsequent operations have been essentially normal with the exception of Internet connectivity. We are dealing with communications and minor power inconsistencies that should be solved once general Chilean infrastructure issues are resolved. The temblor struck about 700 kilometers south of Gemini South which is on Cerro Pachón.

ESO reported that they are experiencing power outages and network interruptions, which means that communication may be limited. “Disruption to staff travel plans within, to, and from Chile should be expected. We urge Visiting Astronomers with observations planned at ESO observatories to put their trips to Chile on hold until further notice. International flights to and from Santiago International Airport are currently either cancelled or diverted. Information about observing programmes will be provided at a later date,” the press release said.

Other observatories in Chile include Cerro Tololo (CTIO) and SLOOH. The servers for the websites for these observatories were down on Saturday, but are now back up.

The SLOOH Twitter account reported late Sunday that their observatory has no power but scope, pier and dome appear to be OK. “Won’t know more until power is restored,” they said.

Update (3/1/2010): Mark T. Adams from NRAO sent this report via Facebook (thanks to Richard Drumm for forwarding it on to UT!):

“We’ve been able to contact or have heard from most of our staff based in or visiting Chile, and we are relieved to report that there appear to be no injuries to our staff or their families. Communication remains very difficult: land-lines, cell-phones, and the Internet are intermittent and unreliable.

“The ALMA Array Operations Site and Operations … See MoreSupport Facilities in northern Chile suffered no damage other than loss of communications. It may take a few days for the completion of a safety inspection of the NRAO/AUI and JAO offices in Santiago, which suffered some damage.”

The earthquake epicentre was 115 km north-northeast of the city of Concepción and 325 km south-west of the capital Santiago. The earthquake caused significant casualties and damage in the country.

Source: ESO, Gemini South

ISS Astronaut Sends Twitpics of Chile Earthquake Aftermath

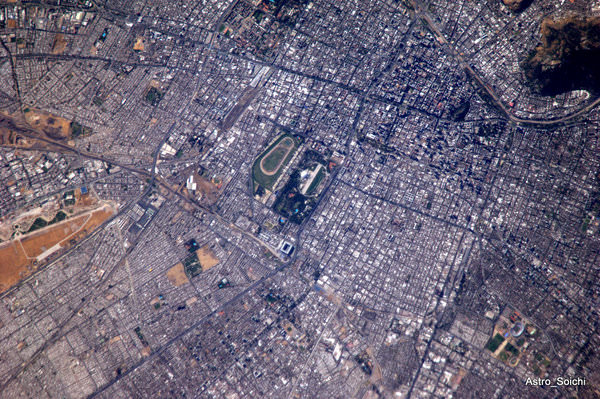
Santiago, the capital city of Chile. One day after the Mega earthquake(M8.8) hit the country. We wish the earliest recovery. Credit: Soichi Noguchi

[/caption]
Astronaut Soichi Noguchi, (@Astro_Soichi) who has taken full advantage of being able to use Twitter live from the International Space Station, has been sending down a stream of images he has taken of Chile following the magnitude 8.8 earthquake that hit the country early Saturday. Just recently, he posted the above image, taken directly over Santiago. “Santiago, the capital city of Chile. One day after the Mega earthquake(M8.8) hit the country. We wish the earliest recovery,” Noguchi wrote on Twitter. He also took a video of the ISS astronaut’s view as they flew over Chile earlier today, below.

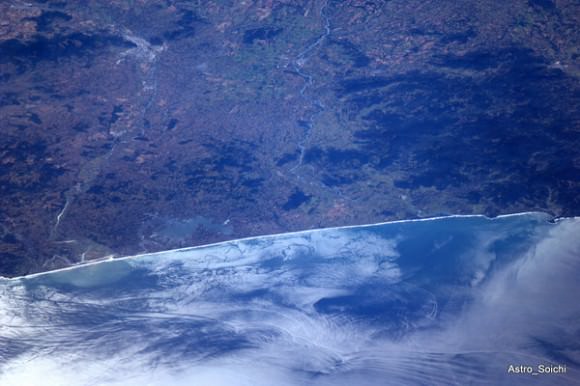
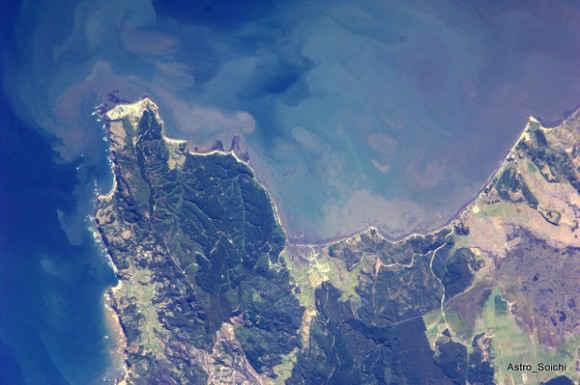
Here’s another image Noguchi took from the ISS, of the coastline of Chile, near Santiago.

Near Santiago, Chile. Coast line. Credit: Soichi Noguchi

And another, near Concepcion, Chile.

Coastline near Concepcion, Chile. Credit: Soichi Noguchi

For more images from space, follow @Astro_Soichi on Twitter.

Maps of Earthquake and Aftershocks in Haiti

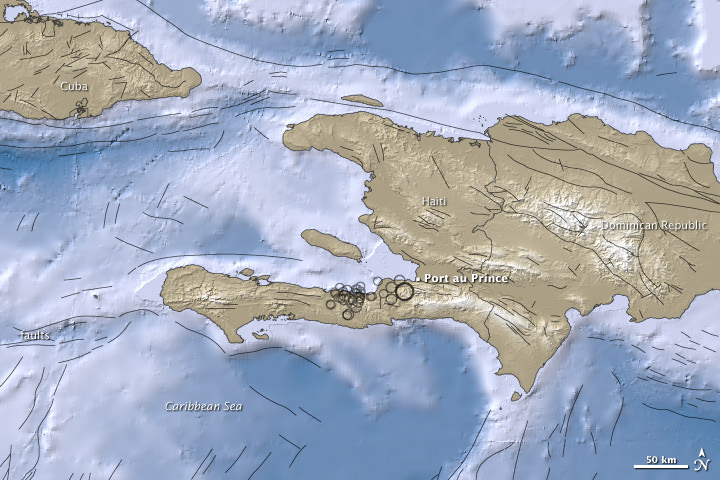
Caption: NASA Earth Observatory image by Jesse Allen

At 21:53 UTC on January 12, 2010 an earthquake with a magnitude 7.0 struck the Caribbean nation of Haiti. The US Geological Survey (USGS) says that it was the most violent earthquake to strike the impoverished country in a century, and death tolls are reported to be rising into the hundreds of thousands. “Porte-au-Prince is probably one of the worst constructed cities in the world, and even the presidential palace collapsed,” said Roger Bilham, from the University of Colorado-Boulder. “This is an earthquake many of us were expecting to occur sooner or later.”

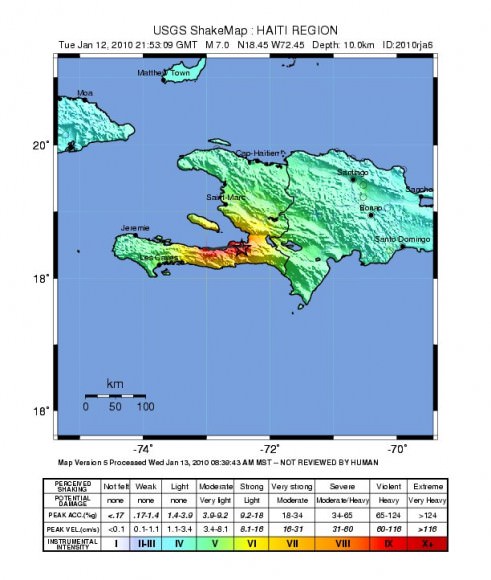
Map of earthquake and aftershocks in Haiti. Credit: USGS

This image from the USGS shows all the seismic activity in the region, including areas in the ocean.

Dennis Mileti, also from CU-Boulder said three factors contributed to the severity of the Haitian event: the shallow location of the earth quake (only 8.3 kilometers or 5.2 miles underground) resulting in high shaking intensity; the low-quality construction of structures in the area; and the lack of earthquake preparedness and increased vulnerability resulting from Haiti being a poor country.

The epicenter of the earthquake was just 15 kilometers (10 miles) southwest of the Haitian capital of Port-au-Prince. Besides its strong magnitude, the earthquake’s shallow depth ensured that the densely populated capital would suffer violent shaking. More than 30 aftershocks rocked the area.

Reports say a majority if the infrastructure has collapsed, including schools, hospitals, government buildings – such as the presidential palace and the main prison — aid centers, and shantytowns.

The top map shows the region surrounding the 7.0-magnitude earthquake and the aftershock. Earthquake magnitudes are measures of earthquake size calculated from ground motion recorded on seismographs.

Ocean areas appear in shades of blue, and land areas appear in shades of brown. Both in water and on land, higher elevation appears in lighter colors. Black circles mark earthquake locations determined by the USGS, and circle sizes correspond with quake magnitudes. Black lines indicate fault lines.

The map was created using earthquake and plate tectonics data from the USGS Earthquake Hazard Program, elevation data from the Shuttle Radar Topography Mission (SRTM) courtesy of the University of Maryland’s Global Land Cover Facility, and ocean bathymetry data from the British Oceanogprahic Data Centre’s (BODC) General Bathymetric Chart of the Oceans (GEBCO).


This “shake” map from the USGS shows the intensity of shaking felt across the region in Haiti.

The USGS said the earthquakes occurred along the boundary between the Caribbean and North America plates. This area is characterized as a strike-slip fault where the Caribbean plate moves eastward with respect to the North America plate.

But Haiti wasn’t the only place an earthquake has taken place recently. Check out this intriguing map of earthquakes in the past week.

Sources: NASA Earth Observatory, USGS, University of Colorado-Boulder, Nature,

Continental Crust

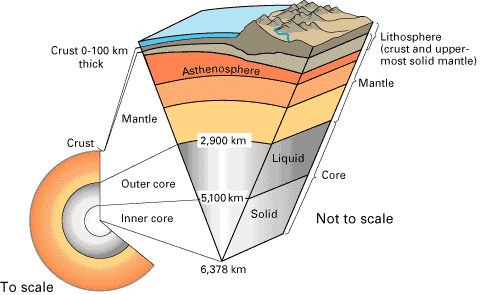
The crust is the top layer of the Earth’s Surface. Did you know that there are 2 types, though? One is called the Oceanic Crust, and the other, the Continental Crust. As its name suggests, the Oceanic Crust is the top layer of Earth that forms the ocean floor. The Continental Crust, however, will be our focus.

We walk on top of and dig down through the Continental Crust when we plant or drill. Even if there is an unstable surface at the very top, like sand, the deeper parts of the Crust are made of harder rocks. The large land masses, continents, have bases made from sedimentary, igneous, or metamorphic rocks, as well as any combination thereof. This shield rock is the oldest known; it’s been tested, dated, and found to have been here for 3,960,000,000 years!

Geologists, scientists who study the Earth, believe that shield rock was created when hot molten iron, known as magma cooled. If their math’s correct, it happened around the time these rocks formed, almost 4 billion years ago, right? Some of those rocks were so big it took a long time for them to cool. So, even if the rocks were formed 3.9 billion years ago, they might not have cooled for quite some time. Many estimate that the Continental Crust wasn’t completely hard for another 60,000,000 to 160,000,000 years.

The top portion of this rock has another name, platform rock. The oldest-known platform rocks are approximately 600,000,000 years old, and can be found in central North America. The sedimentary rock ranges from 1,000 to 2,000 meters thick; that is equivalent to more than a half mile to 1.25 miles. When we put the top and bottom portions of the Continental Crust together, we get what scientists call, a craton. Most cratons are stable and haven’t been damaged by earthquakes or volcanoes for hundreds of millions of years.

Around the edges are the continental margins, mostly created by sedimentary rock originally found in the oceans. How is that possible, you ask? Well, it’s due to earthquake and volcanic activity. In this case, it’s mainly due to a phenomenon called, subduction. You see, the Earth fits together like a puzzle; and, if you try to place the wrong piece into a spot where it fits, but isn’t quite right, what happens? Another piece might pop out of place. Sometimes, a continental margin works its way under the oceanic crust. When that occurs, the oceanic layer ends up on top of the continental margin. This is subduction. The most well-known place for this is along The Ring of Fire, an area that covers the edges along the Pacific Ocean. This is why so many and such violent earthquakes, volcanic eruptions, and tsunamis occur in that part of the world.

Universe Today has a wealth of information on this and other related topics. Here are just 2 of those available. The first is entitled,
Earth, Barely Habitable?.

The second is called, Interesting Facts About Planet Earth.

Universe Today also hosts Astronomy Cast, a science program that covers a variety of subjects. Episode 51: Earth, explains this subject in greater detail.

The Encyclopedia of Earth , by Michael Pidwirny has some excellent information, too.

Sources:
USGS
Science Daily