What is the Closest Galaxy to the Milky Way?

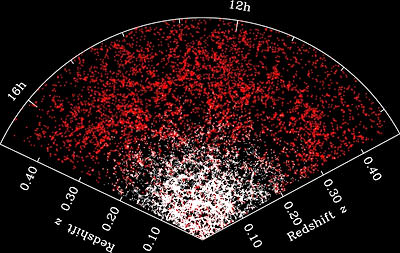
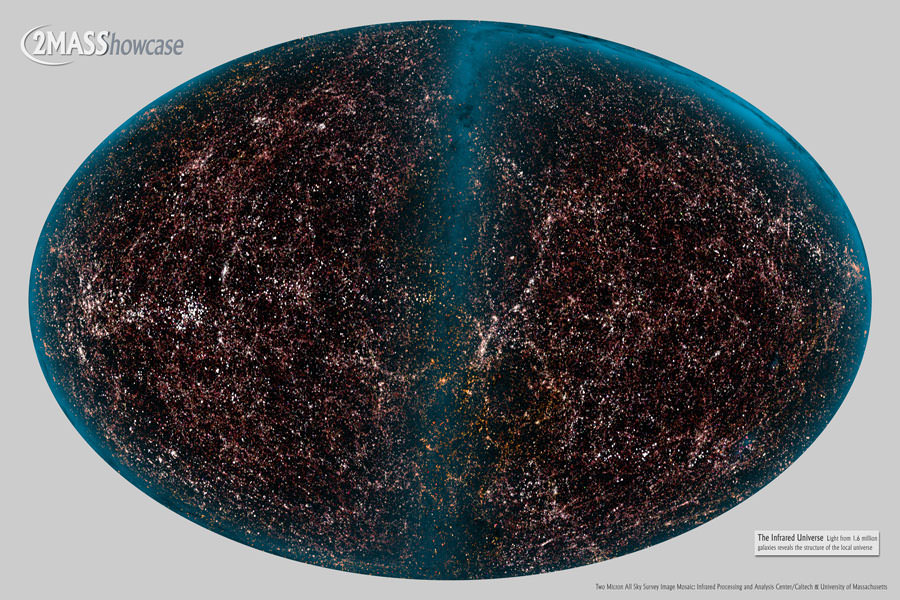
Image showing nearly 50,000 galaxies in the nearby universe detected by the Two Micron All Sky Survey (2MASS) in infrared light. Credit: 2MASS/ T. H. Jarrett/J. Carpenter/R. Hurt

Scientists have known for some time that the Milky Way Galaxy is not alone in the Universe. In addition to our galaxy being part of the Local Group – a collection of 54 galaxies and dwarf galaxies – we are also part of the larger formation known as the Virgo Supercluster. So you could say the Milky Way has a lot of neighbors.

Of these, most people consider the Andromeda Galaxy to be our closest galactic cohabitant. But in truth, Andromeda is the closest spiral galaxy, and not the closest galaxy by a long shot. This distinction falls to a formation that is actually within the Milky Way itself, a dwarf galaxy that we’ve only known about for a little over a decade.

Closest Galaxy:

At present, the closet known galaxy to the Milky Way is the Canis Major Dwarf Galaxy – aka. the Canis Major Overdensity. This stellar formation is about 42,000 light years from the galactic center, and a mere 25,000 light years from our Solar System. This puts it closer to us than the center of our own galaxy, which is 30,000 light years away from the Solar System.
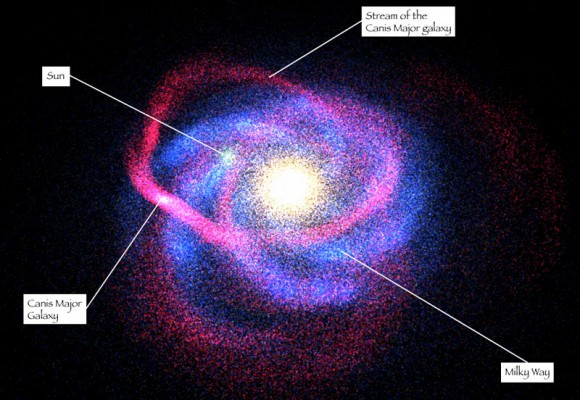
Illustration of the Canis Dwarf Dwarf Galaxy, Credit: R. Ibata (Strasbourg Observatory, ULP) et al./2MASS/NASA
Illustration of the Canis Dwarf Galaxy and its associated tidal (shown in red) in relation to our Milky Way. Credit: R. Ibata (Strasbourg Observatory, ULP) et al./2MASS/NASA

Characteristics:

The Canis Major Dwarf Galaxy Dwarf Galaxy is believed to contain one billion stars in all, a relatively high-percentage of which are in the Red Giant Branch phase of their lifetimes. It has a roughly elliptical shape and is thought to contain as many stars as the Sagittarius Dwarf Elliptical Galaxy, the previous contender for closest galaxy to our location in the Milky Way.

In addition to the dwarf galaxy itself, a long filament of stars is visible trailing behind it. This complex, ringlike structure – which is sometimes referred to as the Monoceros Ring – wraps around the galaxy three times. The stream was first discovered in the early 21st century by astronomers conducting the Sloan Digital Sky Survey (SDSS).

It was in the course of investigating this ring of stars, and a closely spaced group of globular clusters similar to those associated with the Sagittarius Dwarf Elliptical Galaxy, that the Canis Major Dwarf Galaxy was first discovered. The current theory is that this galaxy was accreted (or swallowed up) by the Milky Way Galaxy.

Other globular clusters that orbit the center of our Milky Way as a satellite – i.e. NGC 1851, NGC 1904, NGC 2298 and NGC 2808 – are thought to have been part of the Canis Major Dwarf Galaxy before its accretion. It also has associated open clusters, which are thought to have formed as a result of the dwarf galaxy’s gravity perturbing material in the galactic disk and stimulating star formation.
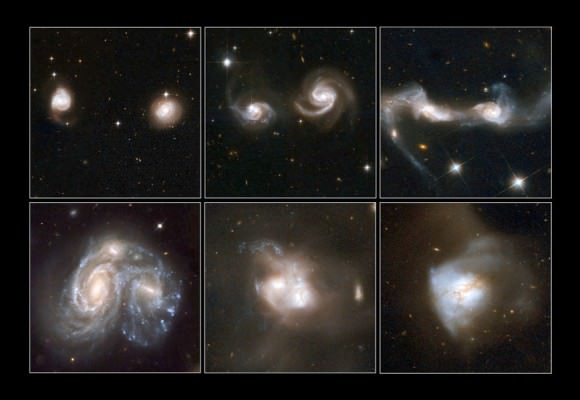
Images of a few examples of merging galaxies taken by the Hubble Space Telescope. Credit: NASA/ESA/STScI/A. Evans/NRAO/Caltech

Discovery:

Prior to its discovery, astronomers believed that the Sagittarius Dwarf Galaxy was the closest galactic formation to our own. At 70,000 light years from Earth, this galaxy was determined in 1994 to be closer to us than the Large Magellanic Cloud (LMC), the irregular dwarf galaxy that is located 180,000 light years from Earth, and which previously held the title of the closest galaxy to the Milky Way.

All of that changed in 2003 when The Canis Major Dwarf Galaxy was discovered by the Two Micron All-Sky Survey (2MASS). This collaborative astronomical mission, which took place between 1997 and 2001, relied on data obtained by the Mt. Hopkins Observatory in Arizona (for the Northern Hemisphere) and the Cerro Tololo Inter-American Observatory in Chile (for the southern hemisphere).

From this data, astronomers were able to conduct a survey of 70% of the sky, detecting about 5,700 celestial sources of infrared radiation. Infrared astronomy takes advantage of advances in astronomy that see more of the Universe, since infrared light is not blocked by gas and dust to the same extent as visible light.

Because of this technique, the astronomers were able to detect a very significant over-density of class M giant stars in a part of the sky occupied by the Canis Major constellation, along with several other related structures composed of this type of star, two of which form broad, faint arcs (as seen in the image close to the top).
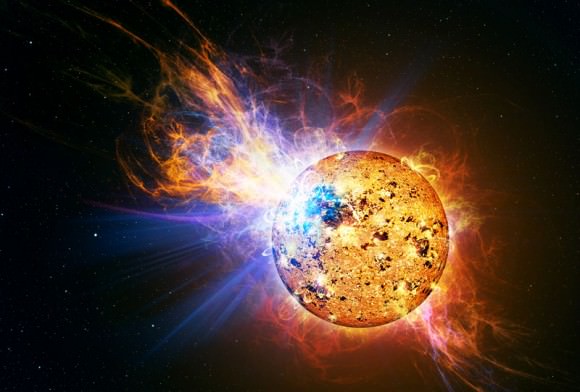
An artist depicts the incredibly powerful flare that erupted from the red dwarf star EV Lacertae. Credit: Casey Reed/NASA

The prevalence of M-class stars is what made the formation easy to detect. These cool, “Red Dwarfs” are not very luminous compared to other classes of stars, and cannot even be seen with the naked eye. However, they shine very brightly in the infrared, and appeared in great numbers.

The discovery of this galaxy, and subsequent analysis of the stars associated with it, has provided some support for the current theory that galaxies may grow in size by swallowing their smaller neighbors. The Milky Way became the size it is now by eating up other galaxies like Canis Major, and it continues to do so today. And since stars from the Canis Major Dwarf Galaxy are technically already part of the Milky Way, it is by definition the nearest galaxy to us.

As already noted, it was the Sagittarius Dwarf Elliptical Galaxy that held the position of closest galaxy to our own prior to 2003. At 75,000 light years away. This dwarf galaxy, which consists of four globular clusters that measure some 10,000 light-years in diameter, was discovered in 1994. Prior to that, the Large Magellanic Cloud was thought to be our closest neighbor.

The Andromeda Galaxy (M31) is the closest spiral galaxy to us, and though it’s gravitationally bound to the Milky Way, it’s not the closest galaxy by far – being 2 million light years away. Andromeda is currently approaching our galaxy at a speed of about 110 kilometers per second. In roughly 4 billion years, the Andromeda Galaxy is expected to merge with out own, forming a single, super-galaxy.

Future of the Canis Major Dwarf Galaxy:

Astronomers also believe that the Canis Major Dwarf Galaxy is in the process of being pulled apart by the gravitational field of the more massive Milky Way Galaxy. The main body of the galaxy is already extremely degraded, a process which will continue as it travels around and through our Galaxy.

In time, the accretion process will likely culminate with the Canis Major Dwarf Galaxy merging entirely with the Milky Way, thus depositing its 1 billion stars to the 200 t0 400 billion that are already part of our galaxy.

We have written many interesting articles on galaxies here at Universe Today. Here’s Closest Galaxy Discovered, How did the Milky Way Form?, How Many Galaxies are there in the Universe?, What is the Milky Way Collision, Spiral Galaxies Could eat Dwarfs all over the Universe and The Canis Major Constellation.

For more information, check out this article from the Spitzer Space Telescope‘s website about the galaxies that are closest to the Milky Way Galaxy. And here is a video by the same author on the subject.

Astronomy Cast has some interesting episodes on the subject. Here’s Episode 97: Galaxies and Episode 99: The Milky Way.

Sources:

Somebody Get This Supermassive Black Hole A Towel

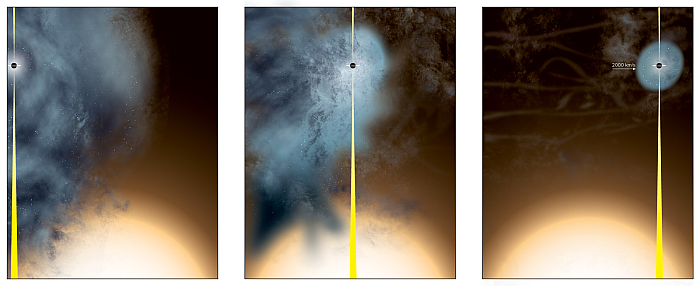
Artist's conception of how the "nearly naked" supermassive black hole originated. On the left panel, the black hole begins its encounter with another, larger black hole. In the middle panel, the stars are stripped away. On the right, the black hole emerges from the encounter with only the remnants of its galaxy intact. Credit: Bill Saxton, NRAO/AUI/NSF.

Most galaxies have a super-massive black hole at their centre. As galaxies collide and merge, the black holes merge too, creating the super-massives we see in the universe today. But one team of astronomers went looking for super-massives that aren’t at the heart of galaxies. They looked at over 1200 galaxies, using the National Science Foundation’s (NSF) Very Long Baseline Array (VLBA), and almost all of them had a black hole right where it should be, in the middle of the galaxy itself.

But they did find one hole, in a cluster of galaxies more than two billion light years away from Earth, that was not at the centre of a galaxy. They were surprised too see that this black hole had been stripped naked of surrounding stars. Once they identified this black hole, now called B3 1715+425, they used the Hubble and the Spitzer to follow up. And what they found tells an unusual story.

“We’ve not seen anything like this before.” – James Condon

The super-massive black hole in question, which we’ll call B3 for short, was a curiosity. It was far brighter than anything near it, and it was also more distant than most of the holes they were studying. But a black hole this bright is typically situated at the heart of a large galaxy. B3 had only a remnant of a galaxy surrounding it. It was naked.

James Condon, of the National Radio Astronomy Observatory (NRAO) described what happened.

“We were looking for orbiting pairs of supermassive black holes, with one offset from the center of a galaxy, as telltale evidence of a previous galaxy merger,” said Condon. “Instead, we found this black hole fleeing from the larger galaxy and leaving a trail of debris behind it,” he added.

“We concluded that our fleeing black hole was incapable of attracting that many stars on the way out to make it look like it does now.” – James Condon

Condon and his team concluded that B3 was once a super-massive black hole at the heart of a large galaxy. B3 collided with another, larger galaxy, one with an even larger black hole. During this collision B3 had most of its stars stripped away, except for the ones closest to it. B3 is still speeding away, at more than 2000 km per second.

Nearly Naked Black Hole from NRAO Outreach on Vimeo.

B3 and what’s left of its stars will continue to move through space, escaping their encounter with the other galaxy. It probably won’t escape from the cluster of galaxies it’s in though.

“What happens to a galaxy when most of its stars have been stripped away, but it still has an active super-massive black hole at the middle?” – James Condon

Condon outlines the likely end for B3. It won’t have enough stars and gas surrounding it to trigger new star birth. It also won’t be able to attract new stars. So eventually, the remnant stars of B3’s original galaxy will travel with it, growing progressively dimmer over time.

B3 itself will also grow dimmer, since it has no new material to “feed” on. It will eventually be nearly impossible to see. Only its gravitational effect will betray its position.

“In a billion years or so, it probably will be invisible.” – James Condon

How many B3s are there? If B3 itself will eventually become invisible, how many other super-massive black holes like it are there, undetectable by our instruments? How often does it happen? And how important is it in understanding the evolution of galaxies, and of clusters of galaxies. Condon asks these questions near the end of the clip. For now, at least, we have no answers.

Condon and his team used the NRAO‘s VLBA to search for these lonely holes. The VLBA is a radio astronomy instrument made up of 10 identical 25m antennae around the world, and controlled at a center in New Mexico. The array provides super sharp detail in the radio wave part of the spectrum.

Their black hole search is a long term project, making use of filler time available at the VLBA. Future telescopes, like the Large Synoptic Survey Telescope being built in Chile, will make Condon’s work easier.

Condon worked with Jeremy Darling of the University of Colorado, Yuri Kovalev of the Astro Space Center of the Lebedev Physical Institute in Moscow, and Leonid Petrov of the Astrogeo Center in Falls Church, Virginia. They will report their findings in the Astrophysical Journal.

How Many Galaxies Are There in the Universe?

How Many Galaxies Are There in the Universe?


The wonderful thing about science is that it’s constantly searching for new evidence, revising estimates, throwing out theories, and sometimes discovering aspects of the Universe that we never realized existed.

The best science is skeptical of itself, always examining its own theories to find out where they could be wrong, and seriously considering new ideas to see if they better explain the observations and data.

What this means is that whenever I state some conclusion that science has reached, you can’t come back a few years later and throw that answer in my face. Science changes, it’s not my fault.

I get it, VY Canis Majoris isn’t the biggest star any more, it’s whatever the biggest star is right now. UY Scuti? That what it is today, but I’m sure it’ll be a totally different star when you watch this in a few years.

What I’m saying is, the science changes, numbers update, and we don’t need to get concerned when it happens. Change is a good thing. And so, it’s with no big surprise that I need to update the estimate for the number of galaxies in the observable Universe. Until a couple of weeks ago, the established count for galaxies was about 200 billion galaxies.

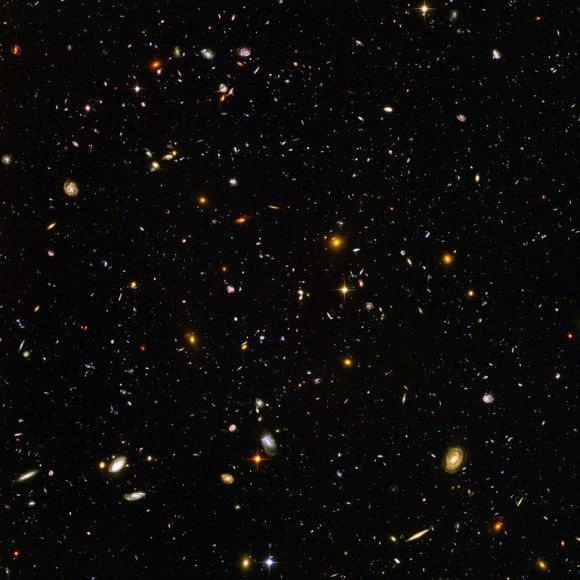
Jacinta studies distant galaxies like those shown in this image from the Hubble Space Telescope, using the new 'stacking' technique to gather information only available through radio telescope observations. Credit: NASA, STScI, and ESA.
Jacinta studies distant galaxies like those shown in this image from the Hubble Space Telescope, using the new ‘stacking’ technique to gather information only available through radio telescope observations. Credit: NASA, STScI, and ESA.

But a new paper published in the Astrophysics Journal revised the estimate for the number of galaxies, by a factor of 10, from 200 billion to 2 trillion. 200 billion, I could wrap my head around, I say billion all the time. But 2 trillion? That’s just an incomprehensible number.

Does that throw all the previous estimates for the number of stars up as well? Actually, it doesn’t.

The observable Universe measures 13.8 billion light-years in all directions. What this means is that at the very edge of what we can see, is the light left that region 13.8 billion years ago. Furthermore, the expansion of the Universe has carried to those regions 46 billion light-years away.

Does that make sense? The light you’re seeing is 13.8 billion light-years old, but now it’s 46 billion light-years away. What this means is that the expansion of space has stretched out the light from all the photons trying to reach us.

What might have been visible or ultraviolet radiation in the past, has shifted into infrared, and even microwaves at the very edge of the observable Universe.

Since astronomers know the volume of the observable Universe, and they can calculate the density of the Universe, they know the mass of the entire Universe. 3.4 x 10^54 kilograms including regular matter and dark matter.  They also know the ratio of regular matter to dark matter, so they can calculate the total amount of regular mass in the Universe.

In the past, astronomers divided that total mass by the number of galaxies they could see in the original Hubble data and determined there were about 200 billion galaxies.

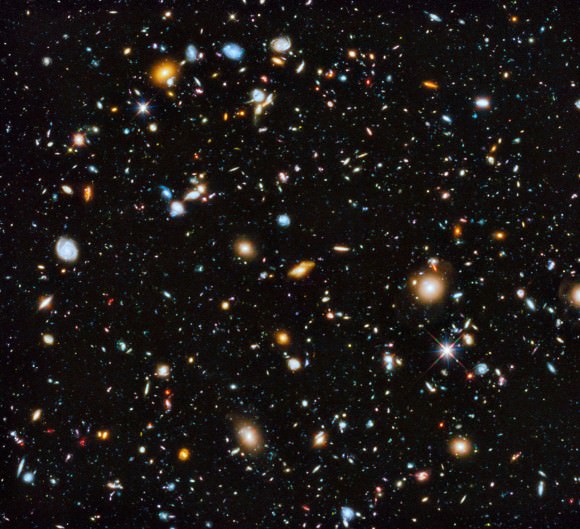
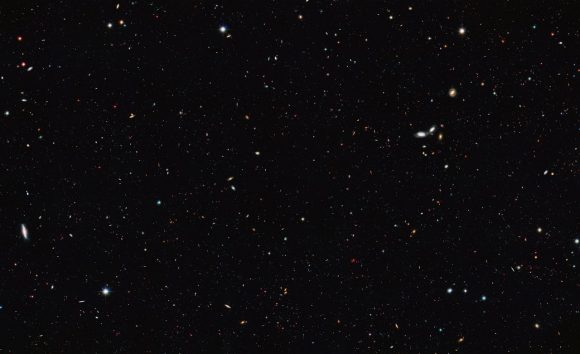
Now, astronomers used a new technique to estimate the galaxies and it’s pretty cool. Astronomers used the Hubble Space Telescope to peer into a seemingly empty part of the sky and identified all the galaxies in it. This is the Hubble Ultra Deep Field, and it’s one of the most amazing pictures Hubble has ever captured.

The Hubble Ultra Deep Field seen in ultraviolet, visible, and infrared light. Image Credit: NASA, ESA, H. Teplitz and M. Rafelski (IPAC/Caltech), A. Koekemoer (STScI), R. Windhorst (Arizona State University), and Z. Levay (STScI)

Astronomers painstakingly converted this image of galaxies into a 3-dimensional map of galaxy size and locations. Then, they used their knowledge of galaxy structure closer to home to provide a more accurate estimate of what the galaxies must look like, out there, at the very edge of our observational ability.

For example, the Milky Way is surrounded by about 50 satellite dwarf galaxies, each of which has a fraction of the mass of the Milky Way.

By recognizing which were the larger main galaxies, they could calculate the distribution of smaller, dimmer dwarf galaxies that weren’t visible in the Hubble images.

In other words, if the distant Universe is similar to the nearby Universe, and this is one of the principles of modern astronomy, then the distant galaxies have the same structure as nearby galaxies.

It doesn’t mean that the Universe is bigger than we thought, or that there are more stars, it just means that the Universe contains more galaxies, which have less stars in them. There are the big main galaxies, and then a smooth distribution curve of smaller and smaller galaxies down to the tiny dwarf galaxies. The total number of stars comes out to be the same number.

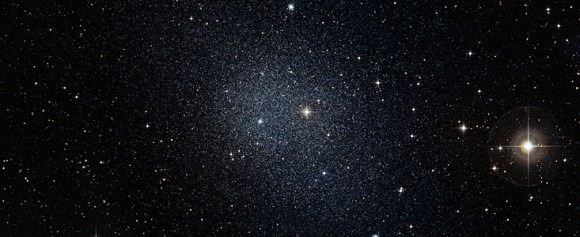
The Fornax dwarf galaxy is one of our Milky Way’s neighbouring dwarf galaxies. The Milky Way is, like all large galaxies, thought to have formed from smaller galaxies in the early days of the Universe. These small galaxies should also contain many very old stars, just as the Milky Way does, and a team of astronomers has now shown that this is indeed the case. This image was composed from data from the Digitized Sky Survey 2. Credit: ESO
The Fornax dwarf galaxy is one of our Milky Way’s neighbouring dwarf galaxies. Credit: ESO

The galaxies we can see are just the tip of the galactic iceberg. For every galaxy we can see, there are another 9, smaller fainter galaxies that we can’t see.

Of course, we’re just a few years away from being able to see these dimmer galaxies. When NASA’s James Webb Space Telescope launches in October, 2018, it’s going to be carrying a telescope mirror with 25 square meters of collecting surface, compared to Hubble’s 4.5 square meters.

Furthermore, James Webb is an infrared telescope, a specialized tool for looking at cooler objects, and galaxies which are billions of light-years away. The kinds of galaxies that Hubble can only hint at, James Webb will be able to see directly.

So, why don’t we see galaxies in all directions with our eyeballs?  This is actually an old conundrum, proposed by Wilhelm Olbers in the 1700, appropriately named Olber’s Paradox.  We did a whole article on it, but the basic idea is that if you look in any direction, you’ll eventually hit a star. It could be close, like the Sun, or very far away, but whatever the case, it should be stars in all directions. Which means that the entire night sky should be as bright as the surface of a star. Clearly it isn’t, but why isn’t it?

In fact, with 10 times the number of galaxies, you could restate the paradox and say that in every direction, you should be looking at a galaxy, but that’s not what you see.

A partial map of the distribution of galaxies in the SDSS, going out to a distance of 7 billion light years. The amount of galaxy clustering that we observe today is a signature of how gravity acted over cosmic time, and allows as to test whether general relativity holds over these scales. (M. Blanton, SDSS)

Except you are. Everywhere you look, in all directions, you’re seeing galaxies. It’s just that those galaxies are red-shifted from the visible spectrum into the infrared spectrum, so your eyeballs can’t perceive them. But they’re there.

When you see the sky in microwaves, it does indeed glow in all directions. That’s the Cosmic Microwave Background Radiation, shining behind all those galaxies.

It turns out the Universe has 10 times more galaxies than previously estimated – 2 trillion galaxies. Not 10 times the stars or mass, those numbers have stayed the same.

And, once James Webb launches, those numbers will be fine-tuned again to be even more precise. 1.5 trillion? 3.4 trillion? Stay tuned for the better number.

What Are Cosmic Voids?

What Are Cosmic Voids?


Clearly I need to learn to be more specific when I write these articles. Everything time I open my mouth, I need to prepare for the collective imagination of the viewers.

We did a whole article about the biggest things in the Universe, and identified superclusters of galaxies as the best candidate. Well, the part of superclusters actually gravitationally bound enough to eventually merge together in the future. But you had other ideas, including dark energy, or the Universe itself as the biggest thing. Even love? Aww.

One intriguing suggestion, though, is the idea of the vast cosmic voids between galaxies. Hmm, is the absence of something a thing? Whoa, time to go to art school and talk about negative space.

Ah well, who cares? It’s a super interesting topic, so let’s go ahead and talk about voids.

When most people imagine the expansion of the Universe after the Big Bang, they probably envision an equally spaced smattering of galaxies zipping away from one another. And that’s pretty accurate at the smallest scales.

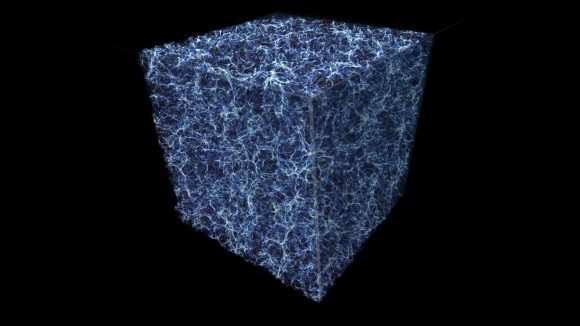
Credit: NASA, ESA, and E. Hallman (University of Colorado, Boulder)

But at the largest scales, like when you can see billions of light-years in a cube that fits on your computer screen, then a larger structure starts to take shape.

It looks less like an explosion, and more like a tasty tasty sponge cake, with huge filaments, walls, and the vast gaps in between. The gaps, the voids, the supervoids, are the point of today’s article, but to understand the gaps, we’ve got to understand why the Universe is clumped up the way it is.

Run the Universe clock backwards, all the way to the beginning, to a fraction of a second after the Big Bang. When the entire cosmos was compressed down into a tiny region of superheated plasma.

Although it was mostly uniform in density, there were slight variations – quantum fluctuations in spacetime itself. And as the Universe expanded, those differences were magnified. What started out as tiny differences in the density of matter at the smallest scale, turned into regions of higher and lower density of matter in the Universe.

Here we are, 13.8 billion years after the Big Bang, and we can see how the microscopic variations at the beginning of time were magnified to the largest scales. Instead of individual galaxies, we see huge walls containing thousands of galaxies; filaments of galaxies connect in nodes. These structures are huge; hundreds of millions of light-years across, containing thousands of galaxies. But the gaps, the voids, between these clusters can be even larger.

Astronomers first started thinking about these voids back in the 1970s, when the first large-scale surveys of the Universe were made. By measuring the redshift of galaxies, and determining how fast they were speeding away from us, astronomers started to realize that the distribution of galaxies wasn’t even.

Red-shifted galaxies. Credit: ESO

Some galaxies were relatively close, but then there were huge gaps in distance, and then another cluster of galaxies collected together.

Over the last few decades, astronomers have built sophisticated 3-dimensional models that map out the Universe in the largest scales. The Sloan Digital Sky Survey, updated in 2009, has provided the most accurate map so far. The Large Synoptic Survey Telescope, destined for first light in a few years will take this to the next level.

The largest void that we currently know of is known as the Giant Void (original, I know), and it’s located about 1.5 billion light-year away. It has a diameter of 1 billion to 1.3 billion light-years across.

To be fair, these regions aren’t really completely empty. They just have less density than the regions with galaxies. In general, they’ve got about a tenth the density of matter that’s average for the Universe.

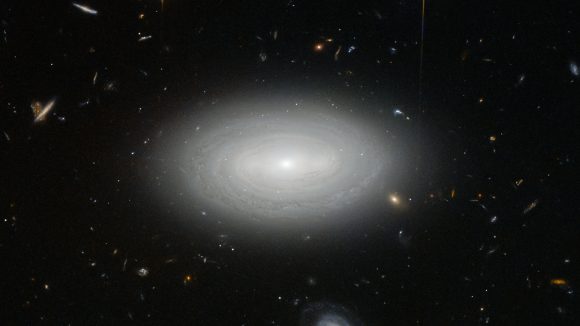
Galaxy MCG+01-02-015 is so isolated that if our galaxy, the Milky Way, were to be situated in the same way, we would not have known of the existence of other galaxies until the 1960s Credit: ESA/Hubble & NASA and N. Gorin (STScI). Acknowledgement: Judy Schmidt
Galaxy MCG+01-02-015 is so isolated that if our galaxy, the Milky Way, were to be situated in the same way, we would not have known of the existence of other galaxies until the 1960s
Credit: ESA/Hubble & NASA and N. Gorin (STScI). Acknowledgement: Judy Schmidt

Which means that there’s still gas and dust in these regions, as well as dark matter. There will still be stars and galaxies out in the middle of those voids. Even the Giant Void has 17 separate galaxy clusters inside it.

You might imagine continuing to scale outward. Maybe you’re wondering if the this spongy distribution of matter is actually just the next step to an even larger structure, and so on, and so on. But it isn’t. In fact, astronomers call this “the End of Greatness”, because it doesn’t seem like there’s any larger structure to the Universe.

As the expansion of the Universe continues, these voids are going to get even larger. The walls and filaments connecting clusters of galaxies will stretch and break. The voids will merge with each other, and only gravitationally bound galaxy clusters will remain as islands, adrift in the expanding emptiness.

The full scale of the observable Universe is truly mind boggling. We’re here in this tiny corner of the Local Group, which is part of the Virgo Supercluster, which is perched on the precipice of vast cosmic voids. So much to explore, so let’s get to work.

The Universe’s Galaxy Population Just Grew Tenfold

New research indicates that there could be as many as 2 trillion galaxies in the known Universe. Credit: 2MASS/Caltech

Ever since human beings learned that the Milky Way was not unique or alone in the night sky, astronomers and cosmologists have sought to find out just how many galaxies there are in the Universe. And until recently, our greatest scientific minds believed they had a pretty good idea  – between 100 and 200 billion.

However, a new study produced by researchers from the UK has revealed something startling about the Universe. Using Hubble’s Deep Field Images and data from other telescopes, they have concluded that these previous estimates were off by a factor of about 10. The Universe, as it turns out, may have had up to 2 trillion galaxies in it during the course of its history.

Led by Prof. Christopher Conselice of the University of Nottingham, U.K., the team combined images taken by the Hubble Space Telescope with other published data to produced a 3-D map of the Universe. They then incorporated a series of new mathematical models that allowed them to infer the existence of galaxies which are not bright enough to be observed by current instruments.

Scientists believe they have found the missing matter of the universe, thus confirming our current cosmological models. Credit: NASA/Chandra
Scientists from the UK have produced new estimates on the number of galaxies in the Universe, which could shed light on cosmic evolution as well. Credit: NASA/Chandra

Using these, they then began reviewing how galaxies have evolved over the past 13 billion years. What they learned was quite fascinating. For one, they observed that the distribution of galaxies throughout the history of the Universe was not even. What’s more, they found that in order for everything in their calculations to add up, there had to be 10 times more galaxies in the early Universe than previously thought.

Most of these galaxies would be similar in mass to the satellite galaxies that have been observed around the Milky Way, and would be too faint to be spotted by today’s instruments. In other words, astronomers have only been able to see about 10% of the early Universe until now, because most of its galaxies were too small and faint to be visible.

As Prof. Conselice explained in a Hubble Science Release, while may help resolve a lingering debate about the structure of the Universe:

“These results are powerful evidence that a significant galaxy evolution has taken place throughout the universe’s history, which dramatically reduced the number of galaxies through mergers between them — thus reducing their total number. This gives us a verification of the so-called top-down formation of structure in the universe.”

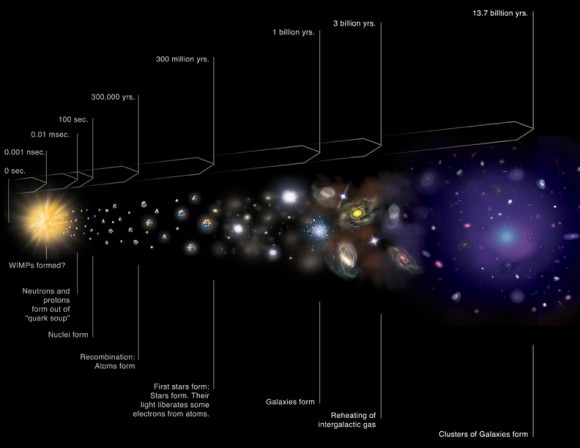
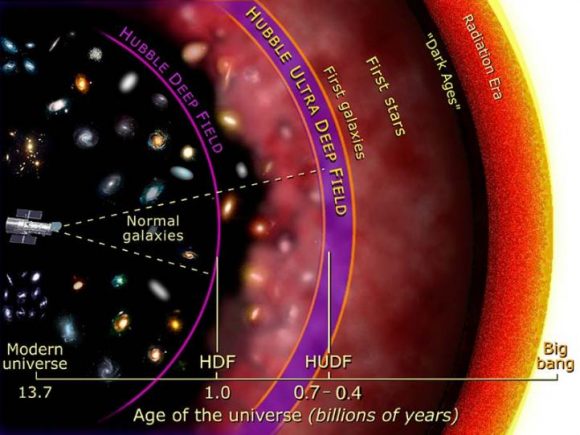
Illustration of the depth by which Hubble imaged galaxies in prior Deep Field initiatives, in units of the Age of the Universe. The goal of the Frontier Fields is to peer back further than the Hubble Ultra Deep Field and get a wealth of images of galaxies as they existed in the first several hundred million years after the Big Bang. Note that the unit of time is not linear in this illustration. Illustration Credit: NASA and A. Feild (STScI)
Illustration of the depth by which Hubble imaged galaxies in prior Deep Field initiatives, in units of the Age of the Universe. Credit: NASA and A. Feild (STScI)

To break it down, the “top-down model” of galaxy formation states that galaxies formed from huge gas clouds larger than the resulting galaxies. These clouds began collapsing because their internal gravity was stronger than the pressures in the cloud. Based on the speed at which the gas clouds rotated, they would either form a spiral or an  elliptical galaxy.

In contrast, the “bottom-up model” states that galaxies formed during the early Universe due to the merging of smaller clumps that were about the size globular clusters. These galaxies could then have been drawn into clusters and superclusters by their mutual gravity.

In addition to helping to resolve this debate, this study also offers a possible solution to the Olbers’ Paradox (aka. “the dark night sky paradox”). Named after the 18th/19th century German astronomer Heinrich Wilhelm Olbers, this paradox addresses the question of why – given the expanse of the Universe and all the luminous matter in it – is the sky dark at night?

Based on their results, the UK team has surmised that while every point in the night sky contains part of a galaxy, most of them are invisible to the human eye and modern telescopes. This is due to a combination of factors, which includes the effects of cosmic redshift, the fact that the Universe is dynamic (i.e. always expanding) and the absorption of light by cosmic dust and gas.

Among other data, scientists used the galaxies visible in the Great Observatories Origins Deep Survey (GOODS) to recalculate the total number of galaxies in the observable Universe. The image was taken by the NASA/ESA Hubble Space Telescope and covers a portion of the southern field of GOODS. This is a large galaxy census, a deep-sky study by several observatories to trace the formation and evolution of galaxies.
Image was taken by the NASA/ESA Hubble Space Telescope which covers a portion of the southern field of Great Observatories Origins Deep Survey (GOODS). Credit: NASA/ESA/HST

Needless to say, future missions will be needed to confirm the existence of all these unseen galaxies. And in that respect, Conselice and his colleagues are looking to future missions – ones that are capable of observing stars and galaxies in the non-visible spectrum – to make that happen.

“It boggles the mind that over 90 percent of the galaxies in the universe have yet to be studied,” he added. “Who knows what interesting properties we will find when we discover these galaxies with future generations of telescopes? In the near future, the James Webb Space Telescope will be able to study these ultra-faint galaxies.”

Understanding how many galaxies have existed over time is a fundamental aspect of understanding the Universe as a whole. With every passing study that attempts to resolve what we can see with our current cosmological models, we are getting that much closer!

And be sure to enjoy this video about some of Hubble’s most stunning images, courtesy of HubbleESA:

Further Reading: HubbleSite, Hubble Space Telescope

Weekly Space Hangout – October 14, 2016: Europe Crashes the Mars Party

Host: Fraser Cain (@fcain)

Special Guest:

Guests:
Tyler Finlay of the Sally Ride EarthKAM project

Guests:
Morgan Rehnberg (MorganRehnberg.com / @MorganRehnberg)

Their stories this week:
Two trillion galaxies?

Obama reaffirms NASA’s Mars plan

ExoMars arrives in the coming week

CosmoQuest Survey for Citizen Scientists – how can we make citizen science more available?

CosmoQuest Survey for Parents who have kids doing Science Fair Projects – how can we help you?

CosmoQuest Survey for Teachers assigning Science Fair Projects – how can we help you?

We use a tool called Trello to submit and vote on stories we would like to see covered each week, and then Fraser will be selecting the stories from there. Here is the link to the Trello WSH page (http://bit.ly/WSHVote), which you can see without logging in. If you’d like to vote, just create a login and help us decide what to cover!

If you would like to join the Weekly Space Hangout Crew, visit their site here and sign up. They’re a great team who can help you join our online discussions!

If you would like to sign up for the AstronomyCast Solar Eclipse Escape, where you can meet Fraser and Pamela, plus WSH Crew and other fans, visit our site linked above and sign up!

We record the Weekly Space Hangout every Friday at 12:00 pm Pacific / 3:00 pm Eastern. You can watch us live on Universe Today, or the Universe Today YouTube page.

Best Picture Yet Of Milky Way’s Formation 13.5 Billion Years Ago

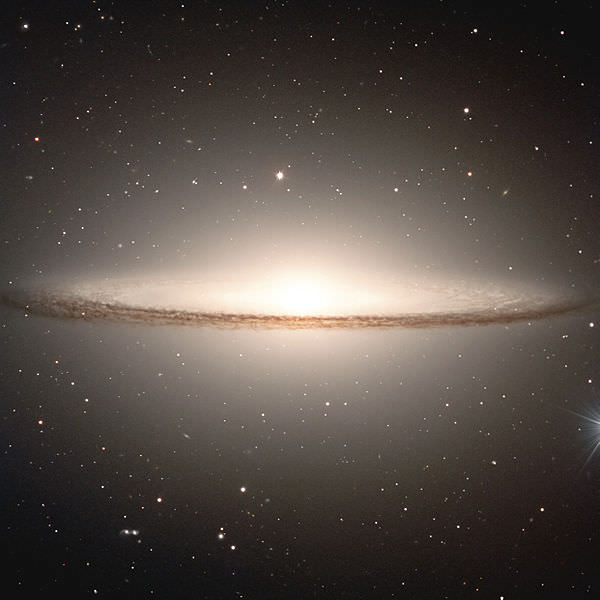
The Milky Way is like NGC 4594 (pictured), a disc shaped spiral galaxy with around 200 billion stars. The three main features are the central bulge, the disk, and the halo. Credit: ESO

Maybe we take our beloved Milky Way galaxy for granted. As far as humanity is concerned, it’s always been here. But how did it form? What is its history?

Our Milky Way galaxy has three recognized stellar components. They are the central bulge, the disk , and the halo. How these three were formed and how they evolved are prominent, fundamental questions in astronomy. Now, a team of researchers have used the unique property of a certain type of star to help answer these fundamental questions.

The type of star in question is called the blue horizontal-branch star (BHB star), and it produces different colors depending on its age. It’s the only type of star to do that. The researchers, from the University of Notre Dame, used this property of BHB’s to create a detailed chronographic (time) map of the Milky Way’s formation.

This map has confirmed what theories and models have predicted for some time: the Milky Way galaxy formed through mergers and accretions of small haloes of gas and dust. Furthermore, the oldest stars in our galaxy are at the center, and younger stars and galaxies joined the Milky Way over billions of years, drawn in by the galaxy’s growing gravitational pull.

The team who produced this study includes astrophysicist Daniela Carollo, research assistant professor in the Department of Physics at the University of Notre Dame, and Timothy Beers, Notre Dame Chair of Astrophysics. Research assistant professor Vinicius Placco, and other colleagues rounded out the team.

“We haven’t previously known much about the age of the most ancient component of the Milky Way, which is the Halo System,” Carollo said. “But now we have demonstrated conclusively for the first time that ancient stars are in the center of the galaxy and the younger stars are found at longer distances. This is another piece of information that we can use to understand the assembly process of the galaxy, and how galaxies in general formed.”

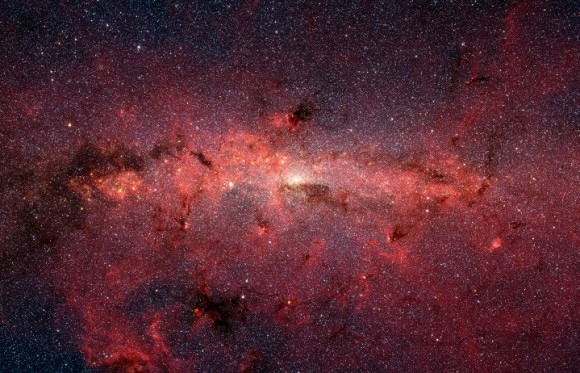
This dazzling infrared image from NASA's Spitzer Space Telescope shows hundreds of thousands of stars crowded into the swirling core of our spiral Milky Way galaxy. Credit: NASA/JPL-Caltech
This dazzling infrared image from NASA’s Spitzer Space Telescope shows hundreds of thousands of stars crowded into the swirling core of our spiral Milky Way galaxy. Credit: NASA/JPL-Caltech

The Sloan Digital Sky Survey (SDSS) played a key role in these findings. The team used data from the SDSS to identify over 130,000 BHB’s. Since these stars literally “show their age”, mapping them throughout the Milky Way produced a chronographic map which clearly shows the oldest stars near the center of the galaxy, and youngest stars further away.

“The colors, when the stars are at that stage of their evolution, are directly related to the amount of time that star has been alive, so we can estimate the age,” Beers said. “Once you have a map, then you can determine which stars came in first and the ages of those portions of the galaxy. We can now actually visualize how our galaxy was built up and inspect the stellar debris from some of the other small galaxies being destroyed by their interaction with ours during its assembly.”

Astronomers infer, from various data-driven approaches, that different structural parts of the galaxy have different ages. They’ve assigned ages to different parts of the galaxy, like the bulge. That makes sense, since everything can’t be the same age. Not in a galaxy that’s this old. But this map makes it even clearer.

As the authors say in their paper, “What has been missing, until only recently, is the ability to assign ages to individual stellar populations, so that the full chemo-dynamical history of the Milky Way can be assessed.”

This new map, with over 130,000 stars as data points, is a pretty important step in understanding the evolution of the Milky Way. It takes something that was based more on models and theory, however sound they were, and reinforces it with more constrained data.

Update: The chronographic map, as well as a .gif, can be viewed here.

6 Million Years Ago The Milky Way’s Supermassive Black Hole Raged

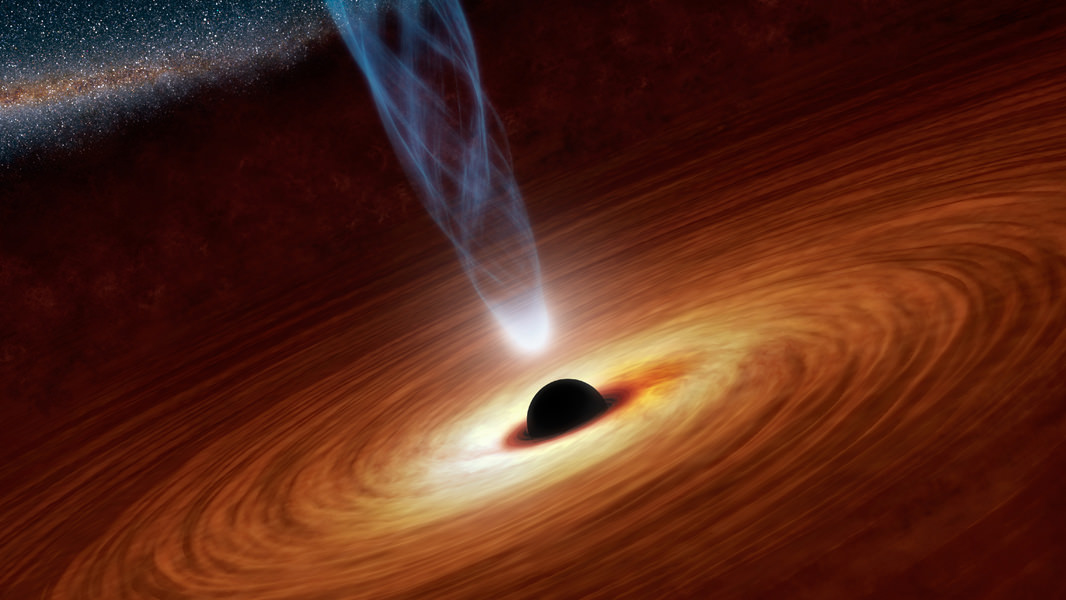
Artist's concept of Sagittarius A, the supermassive black hole at the center of our galaxy. Credit: NASA/JPL

6 million years ago, when our first human ancestors were doing their thing here on Earth, the black hole at the center of the Milky Way was a ferocious place. Our middle-aged, hibernating black hole only munches lazily on small amounts of hydrogen gas these days. But when the first hominins walked the Earth, Sagittarius A was gobbling up matter and expelling gas at speeds reaching 1,000 km/sec. (2 million mph.)

The evidence for this hyperactive phase in Sagittarius’ life, when it was an Active Galactic Nucleus (AGN), came while astronomers were searching for something else: the Milky Way’s missing mass.

There’s a funny problem in our understanding of our galactic environment. Well, it’s not that funny. It’s actually kind of serious, if you’re serious about understanding the universe. The problem is that we can calculate how much matter we should be able to see in our galaxy, but when we go looking for it, it’s not there. This isn’t just a problems in the Milky Way, it’s a problem in other galaxies, too. The entire universe, in fact.

Our measurements show that the Milky Way has a mass about 1-2 trillion times greater than the Sun. Dark matter, that mysterious and invisible hobgoblin that haunts cosmologists’ nightmares, makes up about five sixths of that mass. Regular, normal matter makes up the last sixth of the galaxy’s mass, about 150-300 billion solar masses. But we can only find about 65 billion solar masses of that normal matter, made up of the familiar protons, neutrons, and electrons. The rest is missing in action.

Astrophysicists at the Harvard-Smithsonian Center for Astrophysics have been looking for that mass, and have written up their results in a new paper.

“We played a cosmic game of hide-and-seek. And we asked ourselves, where could the missing mass be hiding?” says lead author Fabrizio Nicastro, a research associate at the Harvard-Smithsonian Center for Astrophysics (CfA) and astrophysicist at the Italian National Institute of Astrophysics (INAF).

“We analyzed archival X-ray observations from the XMM-Newton spacecraft and found that the missing mass is in the form of a million-degree gaseous fog permeating our galaxy. That fog absorbs X-rays from more distant background sources,” Nicastro continued.

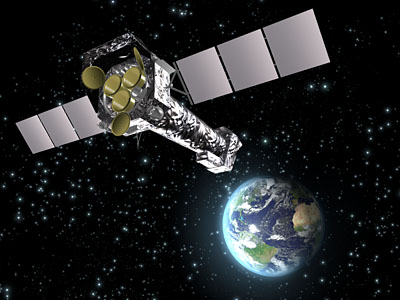
Artist's impression of the ESA's XMM Newton Spacecraft.  Image credit:  ESA
Artist’s impression of the ESA’s XMM Newton Spacecraft. Image credit: ESA

Nicastro and the other scientists behind the paper analyzed how the x-rays were absorbed and were able to calculate the amount and distribution of normal matter in that fog. The team relied heavily on computer models, and on the XMM-Newton data. But their results did not match up with a uniform distribution of the gaseous fog. Instead, there is an empty “bubble”, where this is no gas. And that bubble extends from the center of the galaxy two-thirds of the way to Earth.

What can explain the bubble? Why would the gaseous fog not be spread more uniformly through the galaxy?

Clearing gas from an area that large would require an enormous amount of energy, and the authors point out that an active black hole would do it. They surmise that Sagittarius A was very active at that time, both feeding on gas falling into itself, and pumping out streams of hot gas at up to 1000 km/sec.

Which brings us to present day, 6 million years later, when the shock-wave caused by that activity has travelled 20,000 light years, creating the bubble around the center of the galaxy.

Another piece of evidence corroborates all this. Near the galactic center is a population of 6 million year old stars, formed from the same material that at one time flowed toward the black hole.

“The different lines of evidence all tie together very well,” says Smithsonian co-author Martin Elvis (CfA). “This active phase lasted for 4 to 8 million years, which is reasonable for a quasar.”

The numbers all match up, too. The gas accounted for in the team’s models and observations add up to 130 billion solar masses. That number wraps everything up pretty nicely, since the missing matter in the galaxy is thought to be between 85 billion and 235 billion solar masses.

This is intriguing stuff, though it’s certainly not the final word on the Milky Way’s missing mass. Two future missions, the European Space Agency’s Athena X-ray Observatory, planned for launch in 2028, and NASA’s proposed X-Ray Surveyor could provide more answers.

Who knows? Maybe not only will we learn more about the missing matter in the Milky Way and other galaxies, we may learn more about the activity at the center of the galaxy, and what ebbs and flows it has gone through, and how that has shaped galactic evolution.

Stars Are The Universe’s Neat Freaks

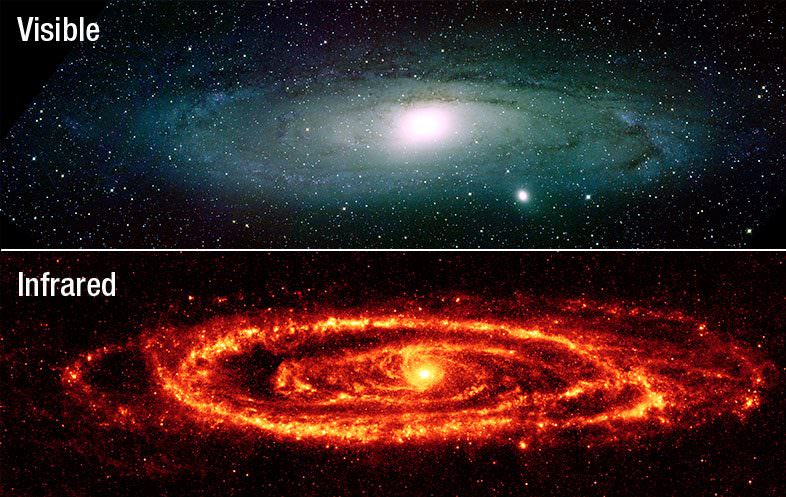
The Andromeda Galaxy, viewed using conventional optics and IR. Credit: Kitt Peak National Observatory

Imagine, if you will, that the Universe was once a much dirtier place than it is today. Imagine also that what we see around us, a relatively clean and unobscured Universe, is the result of billions of years of stars behaving like giant celestial Roombas, cleaning up the space around them in preparation for our arrival. According to a set of recently published catalogues, which detail the latest findings from the ESA’s Herschel Space Observatory, this description is actually quite fitting.

These catalogues represents the work of an international team of over 100 astronomers who have spent the past seven years analyzing the infrared images taken by the Herschel Astrophysical Terahertz Large Area Survey (Herschel-ATLAS). Presented earlier this week at the National Astronomy Meeting in Nottingham, this catalogue revealed that 1 billion years after the Big Bang, the Universe looked much different than it does today.

In order to put this research into context, it is important to understand the important of infrared astronomy. Prior to the deployment of missions like Herschel (which was launched in 2009), astronomers were unable to see a good portion of the light emitted by stars and galaxies. With roughly half of this light being absorbed by interstellar dust grains, research into the birth and lives of galaxies was difficult.

But thanks to surveys like Herschel ATLAS – as well NASA’s Spitzer Space Telescope and the Wide-field Infrared Survey Explorer (WISE) – astronomers have been able to account for this missing energy. And what they have seen (especially from this latest survey) has been quite remarkable, presenting a Universe that is far denser than previously expected.

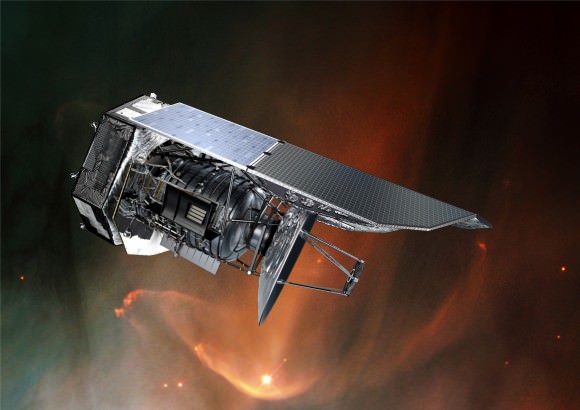
Artist's impression of the Herschel Space Telescope. Credit: ESA/AOES Medialab/NASA/ESA/STScI
Artist’s impression of the Herschel Space Telescope. Credit: ESA/AOES Medialab/NASA/ESA/STScI

Professor Haley Gomez of Cardiff University presented this catalogue during the third day of the National Astronomy Meeting (which ran from June 27th to July 1st). As she told Universe Today via email:

“The Herschel survey is the largest one of the sky in these special infrared light. Because of this we see rare objects that we might not see in a smaller patch of sky, but also we now see hundreds of thousands of dusty galaxies, compared to the few hundred we saw in previous telescopes. So this is a massive improvement in terms of knowing what kinds of galaxies there are. Some of these are so covered in dust we might never had seen them using visible light telescopes. Because of the unprecedented large area we have with this Herschel survey, we see a huge variety in the type of objects too, from nearby dusty star forming clouds, to nearby dusty galaxies like Andromeda, to galaxies that shone their infrared light more than 12 billion years ago.  We can also use this survey to understand the structure of galaxies in the universe – the so-called cosmic web in a way we’ve never been able to do in the far infrared.”

The images they showed gave all those present a glimpse of the unseen stars and galaxies that have existed over the last 12 billion years of cosmic history. In sum,  over half-a-million far-infrared sources have been spotted by the Herschel-ATLAS survey. Many of these sources were galaxies that are nearby and similar to our own, and which are detectable using using conventional telescopes.

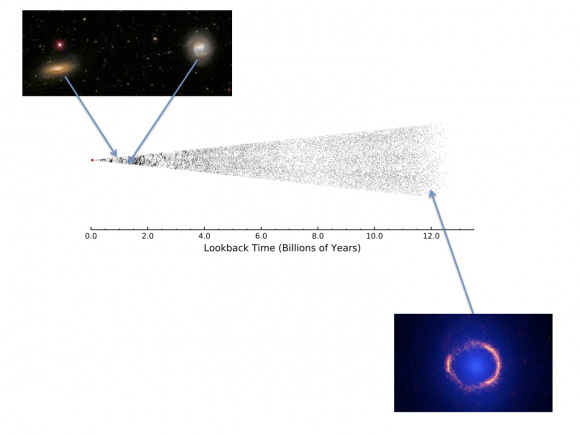
The others were much more distant, their light taking billions of years to reach us, and were obscured by concentrations of cosmic dust. The most distant of these galaxies were roughly 12 billion light-years away, which means that they appeared as they would have 12 billion years ago.

Herschel fig2smallAn illustration of the time reach of the Herschel ATLAS and the kinds of objects it has discovered. Credit: Herschel-ATLAS/ESA/ALMA/ NRAO

Ergo, astronomers now know that 12 billion years ago (i.e. shortly after the Big Bang)., stars and galaxies were much dustier than they are now. They further concluded that the evolution of our galaxies since shortly after the Big Bang has essentially been a major clean-up effort, as stars gradually absorbed the dust that obscured their light, thus making it the more “visible” place it is today.

The data released by the survey includes several maps and additional files which were described in an article produced by Dr. Elisabetta Valiante and a research team from Cardiff University – titled “The Herschel-ATLAS Data Release 1 Paper I: Maps, Catalogues and Number Counts“. As Dr. Valiante told Universe Today via email:

“Gas and dust are the main components of stars: they collapse to form stars and they are ejected at the end of stars’ life. The interesting thing that has been discovered thanks to the Herschel data is that the two phenomena are not in equilibrium. We knew this was true 10 billion years ago, but we expected, according to the current models, that some equilibrium was reached at more recent times. Instead, the amount of dust in galaxies 5 billion years ago was much larger than the amount we see in galaxies today: this was unexpected.”

Until recently, such a survey would have been impossible due to the fact that many of these infrared sources would have  been invisible to astronomers. The reason for this, which was revealed by the survey, was that these galaxies were so dusty that they would have been virtually impossible to detect with conventional optics. What’s more, their light would have been gravitationally magnified by intervening galaxies.

"This dazzling infrared image from NASA's Spitzer Space Telescope shows hundreds of thousands of stars crowded into the swirling core of our spiral Milky Way galaxy. In visible-light pictures, this region cannot be seen at all because dust lying between Earth and the galactic center blocks our view. Credit: NASA/JPL-Caltech
Infrared images (like the one captured by NASA’s Spitzer Space Telescope here) show countless stars and galaxies that are obscured in visible-light by cosmic dust. Credit: NASA/JPL-Caltech

The huge size of the survey has also meant that changes that have occurred in galaxies – relatively recent in cosmic history – can be studied for the first time. For instance, the survey showed that even only one billion years in the past, a small fraction of the age of the universe, galaxies were forming stars at a faster rate and contained more dust than they do today.

Dr. Nathan Bourne – from the University of Edinburgh – is the lead author of another other paper describing the catalogues. As he told Universe Today via email:

“We can think of galaxies as big recycling machines. When they form, they accrete gas (mostly hydrogen and helium, with traces of lithium and a couple of other elements) from the universe around them, and they turn it into stars. As time goes on, the stars pump this gas back out into the galaxy, into the interstellar medium. Due to the nuclear processes within the stars, the gas is now enriched by heavy elements (what we call metals, though they include both metals and non-metals), and some of these form microscopic solid particles of dust, as a sort of by-product.

“But there are still stars forming, and the next generations of stars recycle this interstellar material, and now that it contains heavy elements and dust, things are a bit different, and planets can also form around the new stars, from accumulations of this heavy material. So, if you look at the big picture, when the first galaxies started forming within the first billion years after the Big Bang, they began using up the gas around them, and then while they are active they fill their interstellar medium up with gas and dust, but by the end of a galaxy’s lifecycle, it has used up all this gas and dust, and you could say that it has cleaned itself.”

The catalogues and maps of the hidden universe are a triumph for the Herschel team. Despite the fact that the last information obtained by the Herschel observatory was back in 2013, the maps and catalogues produced from its years of service have become vital to astronomers. In addition to showing the Universe’s hidden energy, they are also laying the groundwork for future research.

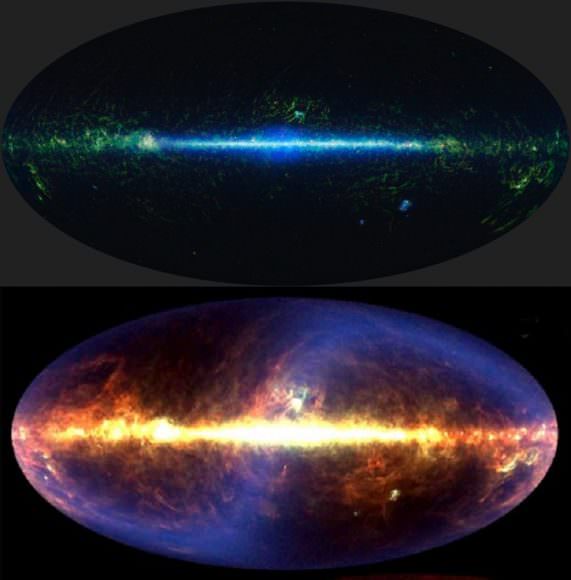
. Credit: NASA/JPL-Caltech/UCLA (top), NASA/DIRBE Team/COBE/ (bottom)
IR images of the entire sky take by the WISE All-Sky Data Release (top), and a projection of the IR sky created by images taken by the COBE spacecraft (bottom). Credit: NASA/JPL-Caltech/UCLA (top), NASA/DIRBE Team/COBE/ (bottom)

“Now we need to explain why there is dust where we did not expect to find it.” said Valiante. “And to explain this, we need to change our theories about how the Universe evolves. Our data poses a challenge we have accepted, but we haven’t overcome it yet!”

“[W]e understand a lot more about how galaxies evolve,” added Bourne, “about when most of the stars formed, what happens to the gas and dust as galaxies evolve, and how rapidly the star-forming activity in the Universe as a whole has faded in the latter half of the Universe’s history. It’s fair to say that this understanding comes from having a whole suite of different types of instruments studying different aspects of galaxies in complementary ways, but Herschel has certainly contributed a major part of that effort and will have a lasting legacy.”

Ensuring Herschel’s lasting legacy is one of the main aims of the Herschel Extragalactic Project (HELP) program, which is overseen by the EU Research Executive Agency. Other projects they oversee include the Herschel Multi-tiered Extragalactic Survey (HerMES), which also released survey data late last month. All of this has left a lasting mark on the field of astronomy, despite the fact that Herschel is no longer in operation. As Professor Gomez said of the Herschel Observatory’s enduring contributions:

“The Herschel Space Observatory stopped taking data in 2013, yet our understanding of the dusty universe is really only just starting with the release of large surveys and galaxy catalogues in recent months. Ultimately, once astronomers have gone through all the valuable data, Herschel will have provided a view of the infrared universe covering 1000 square degrees of the sky.”

The implications of these findings are also likely to have a far-reaching effect, ranging from cosmology and astronomy, to perhaps shedding some light on that tricky Fermi paradox. Could it be intelligent life that emerged billions of years ago didn’t venture to other star systems because they couldn’t see them? Just a thought…

Further Reading: Royal Astronomical Society, ESA

New ‘Einstein Ring’ Discovered By Dark Energy Camera

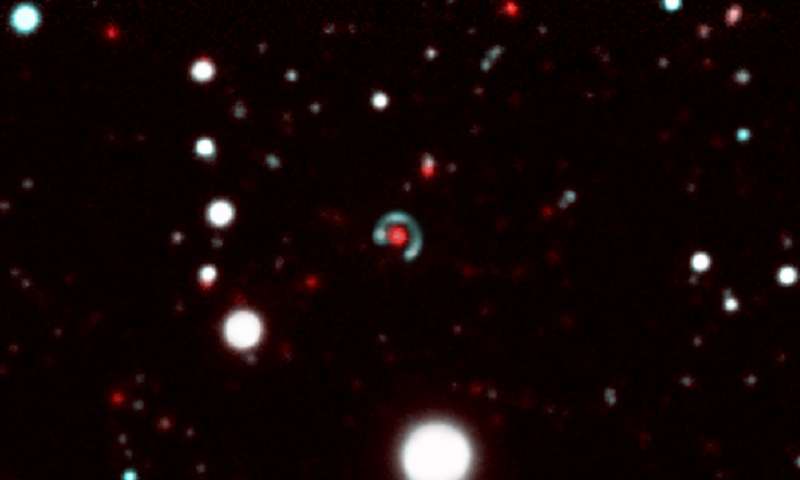
The "Canarias Einstein Ring." The green-blue ring is the source galaxy, the red one in the middle is the lens galaxy. The lens galaxy has such strong gravity, that it distorts the light from the source galaxy into a ring. Because the two galaxies are aligned, the source galaxy appears almost circular. Image: This composite image is made up from several images taken with the DECam camera on the Blanco 4m telescope at the Cerro Tololo Observatory in Chile.

A rare object called an Einstein Ring has been discovered by a team in the Stellar Populations group at the Instituto de Astrofísica de Canarias (IAC) in Spain. An Einstein Ring is a specific type of gravitational lensing.

Einstein’s Theory of General Relativity predicted the phenomena of gravitational lensing. Gravitational lensing tells us that instead of travelling in a straight line, light from a source can be bent by a massive object, like a black hole or a galaxy, which itself bends space time.

Einstein’s General Relativity was published in 1915, but a few years before that, in 1912, Einstein predicted the bending of light. Russian physicist Orest Chwolson was the first to mention the ring effect in scientific literature in 1924, which is why the rings are also called Einstein-Chwolson rings.

Gravitational lensing is fairly well-known, and many gravitational lenses have been observed. Einstein rings are rarer, because the observer, source, and lens all have to be aligned. Einstein himself thought that one would never be observed at all. “Of course, there is no hope of observing this phenomenon directly,” Einstein wrote in 1936.

The team behind the recent discovery was led by PhD student Margherita Bettinelli at the University of La Laguna, and Antonio Aparicio and Sebastian Hidalgo of the Stellar Populations group at the Instituto de Astrofísica de Canarias (IAC) in Spain. Because of the rarity of these objects, and the strong scientific interest in them, this one was given a name: The Canarias Einstein Ring.

There are three components to an Einstein Ring. The first is the observer, which in this case means telescopes here on Earth. The second is the lens galaxy, a massive galaxy with enormous gravity. This gravity warps space-time so that not only are objects drawn to it, but light itself is forced to travel along a curved path. The lens lies between Earth and the third component, the source galaxy. The light from the source galaxy is bent into a ring form by the power of the lens galaxy.

When all three components are aligned precisely, which is very rare, the light from the source galaxy is formed into a circle with the lens galaxy right in the centre. The circle won’t be perfect; it will have irregularities that reflect irregularities in the gravitational force of the lens galaxy.

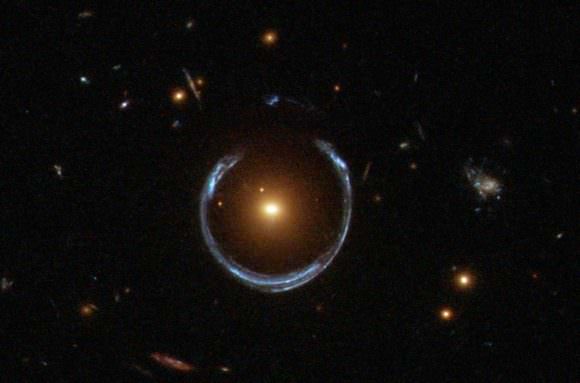
Another Einstein Ring. This one is named LRG 3-757. This one was discovered by the Sloan Digital Sky Survey, but this image was captured by Hubble's Wide Field Camera 3. Image: NASA/Hubble/ESA
Another Einstein Ring. This one is named LRG 3-757. This one was discovered by the Sloan Digital Sky Survey, but this image was captured by Hubble’s Wide Field Camera 3. Image: NASA/Hubble/ESA

The objects are more than just pretty artifacts of nature. They can tell scientists things about the nature of the lens galaxy. Antonio Aparicio, one of the IAC astrophysicists involved in the research said, “Studying these phenomena gives us especially relevant information about the composition of the source galaxy, and also about the structure of the gravitational field and of the dark matter in the lens galaxy.”

Looking at these objects is like looking back in time, too. The source galaxy is 10 billion light years from Earth. Expansion of the Universe means that the light has taken 8.5 billion light years to reach us. That’s why the ring is blue; that long ago, the source galaxy was young, full of hot blue stars.

The lens itself is much closer to us, but still very distant. It’s 6 billion light years away. Star formation in that galaxy likely came to a halt, and its stellar population is now old.

The discovery of the Canarias Einstein Ring was a happy accident. Bettinelli was pouring over data from what’s known as the Dark Energy Camera (DECam) of the 4m Blanco Telescope at the Cerro Tololo Observatory, in Chile. She was studying the stellar population of the Sculptor dwarf galaxy for her PhD when the Einstein Ring caught her attention. Other members of the Stellar Population Group then used OSIRIS spectrograph on the Gran Telescopio CANARIAS (GTC) to observe and analyze it further.