Solved: The Mystery of Earth’s Theta Aurora

From the ground, aurora have mystified humans since we began to question the world. The space age revealed more mystery - the Theta Auroral Oval (inset) and the challenge of understanding the phenomena. (Photo Credit: NASA/APOD)

The mystery of the northern lights – aurora – spans time beyond history and to cultures of both the southern and northern hemispheres. The mystery involves the lights, fantastic patterns and mystical changes. Ancient men and women stood huddled under them wondering what it meant. Was it messages from the gods, the spirits of loved ones, warnings or messages to comfort their souls?

Aurora reside literally at the edge of space. While we know the basics and even more, we are still learning. A new published work has just added to our understanding by explaining how one type of aurora – the Theta Aurora – is created from the interaction of the charged particles, electric and magnetic fields surrounding the Earth. Their conclusions required the coordination of simultaneous observations of two missions.
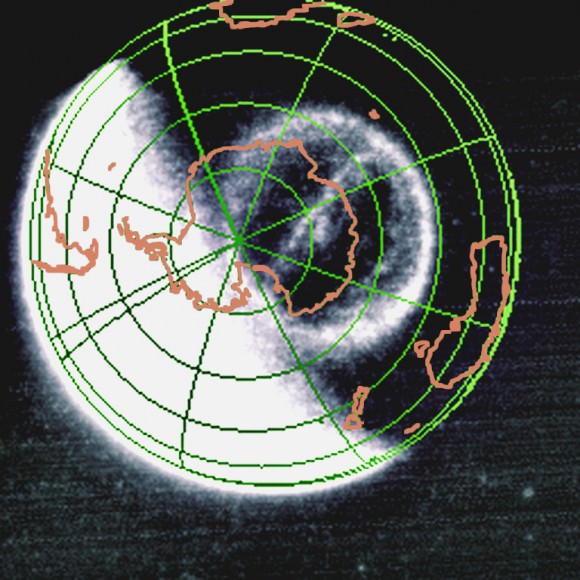
The Theta Auroral Oval as observed by the NASA IMAGE FUV camera on September 15, 2005. (Credit: NASA/SWRI)
The Theta Auroral Oval as observed by the NASA IMAGE FUV camera on September 15, 2005 and anlayzed using Cluster data in the paper by Fear et al. (Credit: NASA/SWRI)

We were not aware of Thetas until the advent of the space age and our peering back at Earth. They cannot be recognized from the ground. The auroras that bystanders see from locales such as Norway or New Zealand are just arcs and subsets of the bigger picture which is the auroral ovals atop the polar regions of the Earth. Ground based all-sky cameras and polar orbiting probes had seen what were deemed “polar cap arcs.” However, it was a spacecraft Dynamics Explorer I (DE-1) that was the first to make global images of the auroral ovals and observed the first “transpolar arcs”, that is, the Theta aurora.

They are named Theta after the Greek letter that they resemble. Thetas are uncommon and do not persist long. Early on in the exploration of this phenomenon, researchers have been aware that they occur when the Sun’s magnetic field, called the Interplanetary Magnetic Field (IMF) turns northward. Most of the time the IMF in the vicinity of the Earth points south. It is a critical aspect of the Sun-Earth interaction. The southerly pointing field is able to dovetail readily with the normal direction of the Earth’s magnetic field. The northward IMF interacting with the Earth’s field is similar to two bar magnets turned head to head, repelling each other. When the IMF flips northward locally, a convolution takes place that will, at times, but not always, produce a Theta aurora.

A group of researchers led by Dr. Robert Fear from the Department of Physics & Astronomy, University of Leicester, through analysis of simultaneous spacecraft observations, has identified how the particles and fields interact to produce Theta aurora. Their study, “Direct observation of closed magnetic flux trapped in the high-latitude magnetosphere” in the Journal Science (December 19, 2014, Vol 346) utilized a combination of data from ESA’s Cluster spacecraft mission and the IMAGE spacecraft of NASA. The specific event in the Earth’s magnetosphere on September 15, 2005 was observed simultaneously by the spacecraft of both missions.
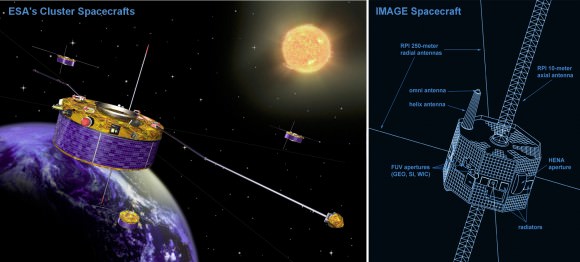
Illustrations of the Cluster II spacecraft in orbit and formation around the Earth and the NASA IMAGE spacecraft vehicle design. The two mission's observations were combined to correlate numerous auroral and magnetospheric events. Cluster II remains in operation as of December 2014 (14 yr lifespan). (Credit: ESA, NASA)
Illustrations of the Cluster II spacecraft in orbit and formation around the Earth and the NASA IMAGE spacecraft vehicle design. The two mission’s observations were combined to correlate numerous auroral and magnetospheric events. Cluster II remains in operation as of December 2014 (14 yr lifespan). (Credit: ESA, NASA)

Due to the complexity of the Sun-Earth relationship involving neutral and charged particles and electric and magnetic fields, space scientists have long attempted to make simultaneous measurements with multiple spacecraft. ISEE-1, 2 and 3 were one early attempt. Another was the Dynamics Explorer 1 & 2 spacecraft. DE-2 was in a low orbit while DE-1 was in an elongated orbit taking it deeper into the magnetosphere. At times, the pair would align on the same magnetic field lines. The field lines are like rails that guide the charged particles from far out in the magneto-tail to all the way down to the upper atmosphere – the ionosphere. Placing two or more spacecraft on the same field lines presented the means of making coordinated observations of the same event. Dr. Fear and colleagues analyzed data when ESA’s Cluster resided in the southern lobe of the magnetotail and NASA’s IMAGE (Imager for Magnetopause-to-Aurora Global Exploration) spacecraft resided above the south polar region of the Earth.

Cluster is a set of four spacecraft, still in operation after 14 years. Together with IMAGE, five craft were observing the event. Fear, et al utilized ESA spacecraft Cluster 1 (of four) and NASA’s IMAGE. On that fateful day, the IMF turned north. As described in Dr. Fear’s paper, on that day, the north and south lobes of the magnetosphere were closed. The magnetic field lines of the lobes were separated from the Solar wind and IMF due to what is called magnetic reconnection. The following diagram shows how complex Earth’s magnetosphere is; with regions such as the bow shock, magnetopause, cusps, magnetotail, particle belts and the lobes.
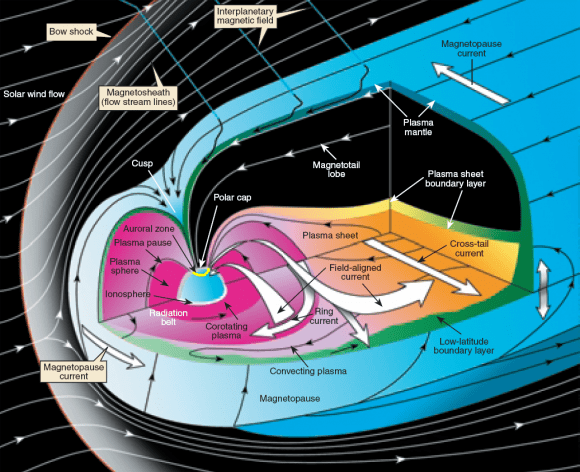
Illustration of the Earth's magnetosphere showing it complexity. The Theta Aurora are now confidently linked to magnetic reconnection events in the lobes of the magnetotail. (Credit: NASA)
Illustration of the Earth’s magnetosphere showing it complexity. The Theta Aurora are now confidently linked to magnetic reconnection events in the lobes of the magnetotail. (Credit: NASA)

The science paper explains that what was previously observed by only lower altitude spacecraft was captured by Cluster within the magnetotail lobes. The southerly lobe’s plasma – ionized particles – was very energetic. The measurements revealed that the southern lobe of the magnetotail was acting as a bottle and the particles were bouncing between two magnetic mirrors, that is, the lobes were close due to reconnection. The particles were highly energetic.

The presence of what is called a double loss cone signature in the electron energy distribution was a clear indicator that the particles were trapped and oscillating between mirror points. The consequences for the Earth’s ionosphere was that highly energetic particles flooded down the field lines from the lobes and impacted the upper atmosphere transferring their energy and causing the magnificent light show that we know as the Northern Lights (or Southern) in the form of a Theta Auroral Oval. This strong evidence supports the theory that Theta aurora are produced by energized particles from within closed field lines and not by energetic particles directly from the Solar Wind that find a path into the magnetosphere and reach the upper atmosphere of the Earth.

A video of an observed major geomagnetic storm (July 15, 2000) taken by the Far Ultraviolet Imaging System (FUV) on IMAGE. IMAGE operated from 2000 to December 2005 when communications were lost. (Credit: NASA/SWRI)  [click to view the animated gif]
A video of an observed major geomagnetic storm (July 15, 2000, southward IMF) taken by the Far Ultraviolet Imaging System (FUV) on the spacecraft IMAGE. IMAGE operated from 2000 until December 2005 when communications were inexplicably lost. (Credit: NASA/SWRI) [click to view the animated gif]
Without the coordination of the observations and the collective analysis, the Theta aurora phenomenon would continue to be debated. The analysis by Dr. Fear, while not definitive, is strong proof that Theta aurora are generated from particles trapped within closed field lines.

The analysis of the Cluster mission data as well as that of many other missions takes years. Years after observations are made researchers can achieve new understanding through study of arduous details or sometimes by a ha-ha moment. Aurora represent the signature of the interaction of two magnetic fields and two populations of particles – the Sun’s field and energetic particles streaming at millions of miles per hour from its surface reaching the Earth’s magnetic field. The Earth’s field is transformed by the interaction and receives energetic particles that it bottles up and energizes further. Ultimately, the Earth’s magnetic field directs some of these particles to the topside of our atmosphere. For thousands and likely tens of thousands of years, humans have questioned what it all means. Now another piece of the puzzle has been laid down with a good degree of certainty; one that explains the Theta aurora.

Reference:

Direct observation of closed magnetic flux trapped in the high-latitude magnetosphere

Transpolar arc evolution and associated potential patterns

Transpolar aurora: time evolution, associated convection patterns, and a possible cause

Related articles at Universe Today:

Guide to Space –

Earth’s Magnetic Field,

Aurora Borealis

Making Cubesats do Astronomy

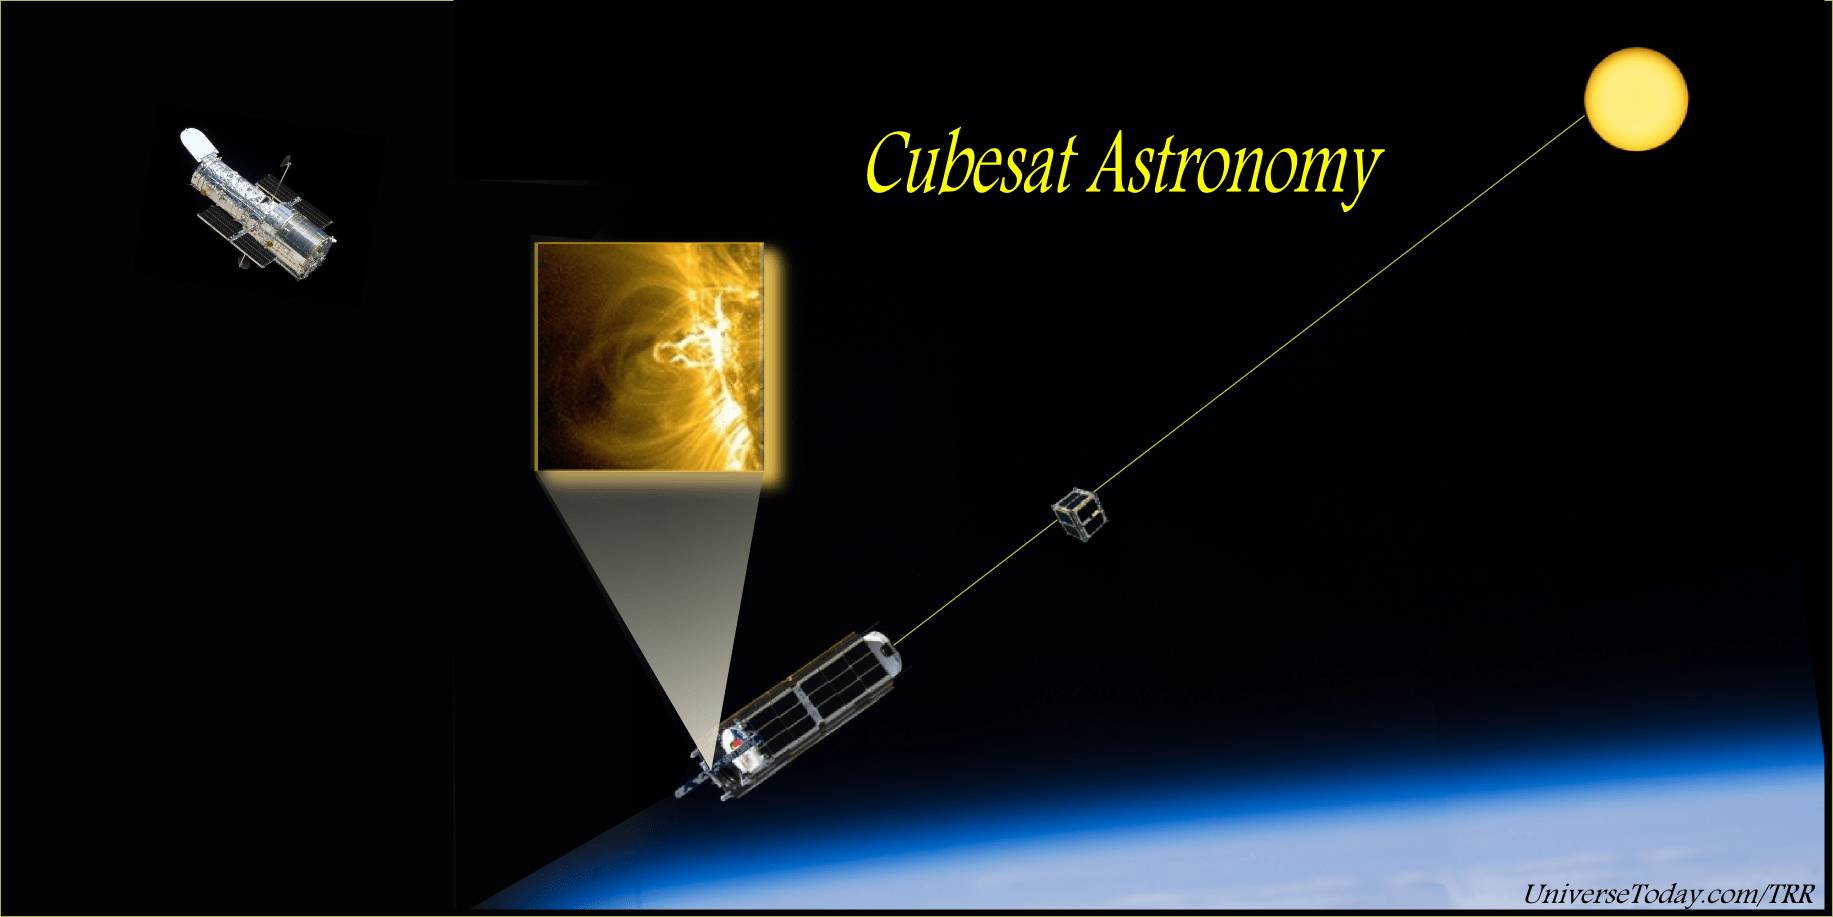
Will cubesats develop a new technological branch of astronomy? Goddard engineers are taking the necessary steps to make cubesat sized telescopes a reality. (Credit: NASA, UniverseToday/TRR)

One doesn’t take two cubesats and rub them together to make static electricity. Rather, you send them on a brief space voyage to low-earth orbit (LEO) and space them apart some distance and voilà, you have a telescope. That is the plan of NASA’s Goddard Space Flight Center engineers and also what has been imagined by several others.

Cubesats are one of the big crazes in the new space industry. But nearly all that have flown to-date are simple rudderless cubes taking photos when they are oriented correctly. The GSFC engineers are planning to give two cubes substantial control of their positions relative to each other and to the Universe surrounding them. With one holding a telescope and the other a disk to blot out the bright sun, their cubesat telescope will do what not even the Hubble Space Telescope is capable of and for far less money.

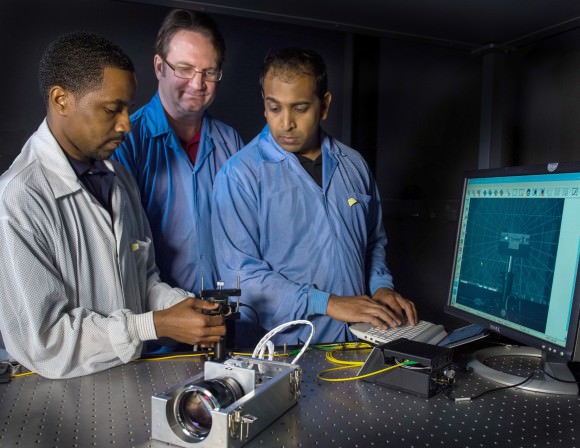
Semper (left), Calhoun, and Shah are advancing the technologies needed to create a virtual telescope that they plan to demonstrate on two CubeSats. (Image/Caption Credit: NASA/W. Hrybyk)

The 1U, the 3U, the 9U – these are all cubesats of different sizes. They all have in common the unit size of 1. A 1U cubesat is 10 x 10 x 10 centimeters cubed. A cube of this size will hold one liter of water (about one quart) which is one kilogram by weight. Or replace that water with hydrazine and you have very close to 1 kilogram of mono-propellent rocket fuel which can take a cubestat places.

GSFC aerospace engineers, led by Neerav Shah, don’t want to go far, they just want to look at things far away using two cubesats. Their design will use one as a telescope – some optics and a good detector –and the other cubesat will stand off about 20 meters, as they plan, and function as a coronagraph. The coronagraph cubesat will function as a sun mask, an occulting disk to block out the bright rays from the surface of the Sun so that the cubesat telescope can look with high resolution at the corona and the edge of the Sun. To these engineers, the challenge is keeping the two cubesats accurately aligned and pointing at their target.

Only dedicated Sun observing space telescopes such as SDO, STEREO and SOHO are capable of blocking out the Sun, but their coronagraphs are limited. Separating the coronagraph farther from the optics markedly improves how closely one can look at the edge of a bright object. With the corongraph mask closer to the optics, more bright light will still reach the optics and detectors and flood out what you really want to see. The technology Shah and his colleagues develop can be a pathfinder for future space telescopes that will search for distant planets around other stars – also using a coronagraph to reveal the otherwise hidden planets.

The engineers have received a $8.6-million investment from the Defense Advanced Research Project Agency (DARPA) and are working in collaboration with the Maryland-based Emergent Space Technologies.

An example of a 3U cubesat - 3 1U cubes stacked. This cubesat size  could function as the telescope of a two cubesat telescope system. It could be a simple 10 cm diameter optic system or use fancier folding optics to improve its resolving power. (Credit: LLNL)
An example of a 3U cubesat – 3 1U cubes stacked. This cubesat size could function as the telescope of a two cubesat telescope system. It could be a simple 10 cm diameter optic system or use fancier folding optics to improve its resolving power. (Credit: LLNL)

The challenge of GSFC engineers is giving two small cubesats guidance, navigation, and control (GN&C) as good as any standard spacecraft that has flown. They plan on using off-the-shelf technology and there are many small and even large companies developing and selling cubesat parts.

This is a sorting out period for the cubesat sector, if you will, of the new space industry. Sorting through the off-the-shelf components, the GSFC engineers led by Shah will pick the best in class. The parts they need are things like tiny sun sensors and star sensors, laser beams and tiny detectors of those beams, accelerometers, tiny gyroscopes or momentum wheels and also small propulsion systems. The cubesat industry is pretty close to having all these ready as standard issue. The question then is what do you do with tiny satellites in low-Earth orbit (LEO). Telescopes for earth-observing are already making headway and scopes for astronomy are next. There are also plans to venture out to interplanetary space with tiny and capable cubesat space probes.

Whether one can sustain a profit for a company built on cubesats remains a big question. Right now those building cubesats to customer specs are making a profit and those making the tiny picks and shovels for cubesats are making profits. The little industry may be overbuilt which in economic parlance might be only natural. Many small startups will fail. However, for researchers at universities and research organizations like NASA, cubesats have staying power because they reduce cost by their low mass and size, and the low cost of the components to make them function. The GSFC effort will determine how quickly cubesats begin to do real work in the field of astronomy. Controlling attitude and adding propulsion is the next big thing in cubesat development.

References:

NASA Press Release

Unusual Distributions of Organics Found in Titan’s Atmosphere

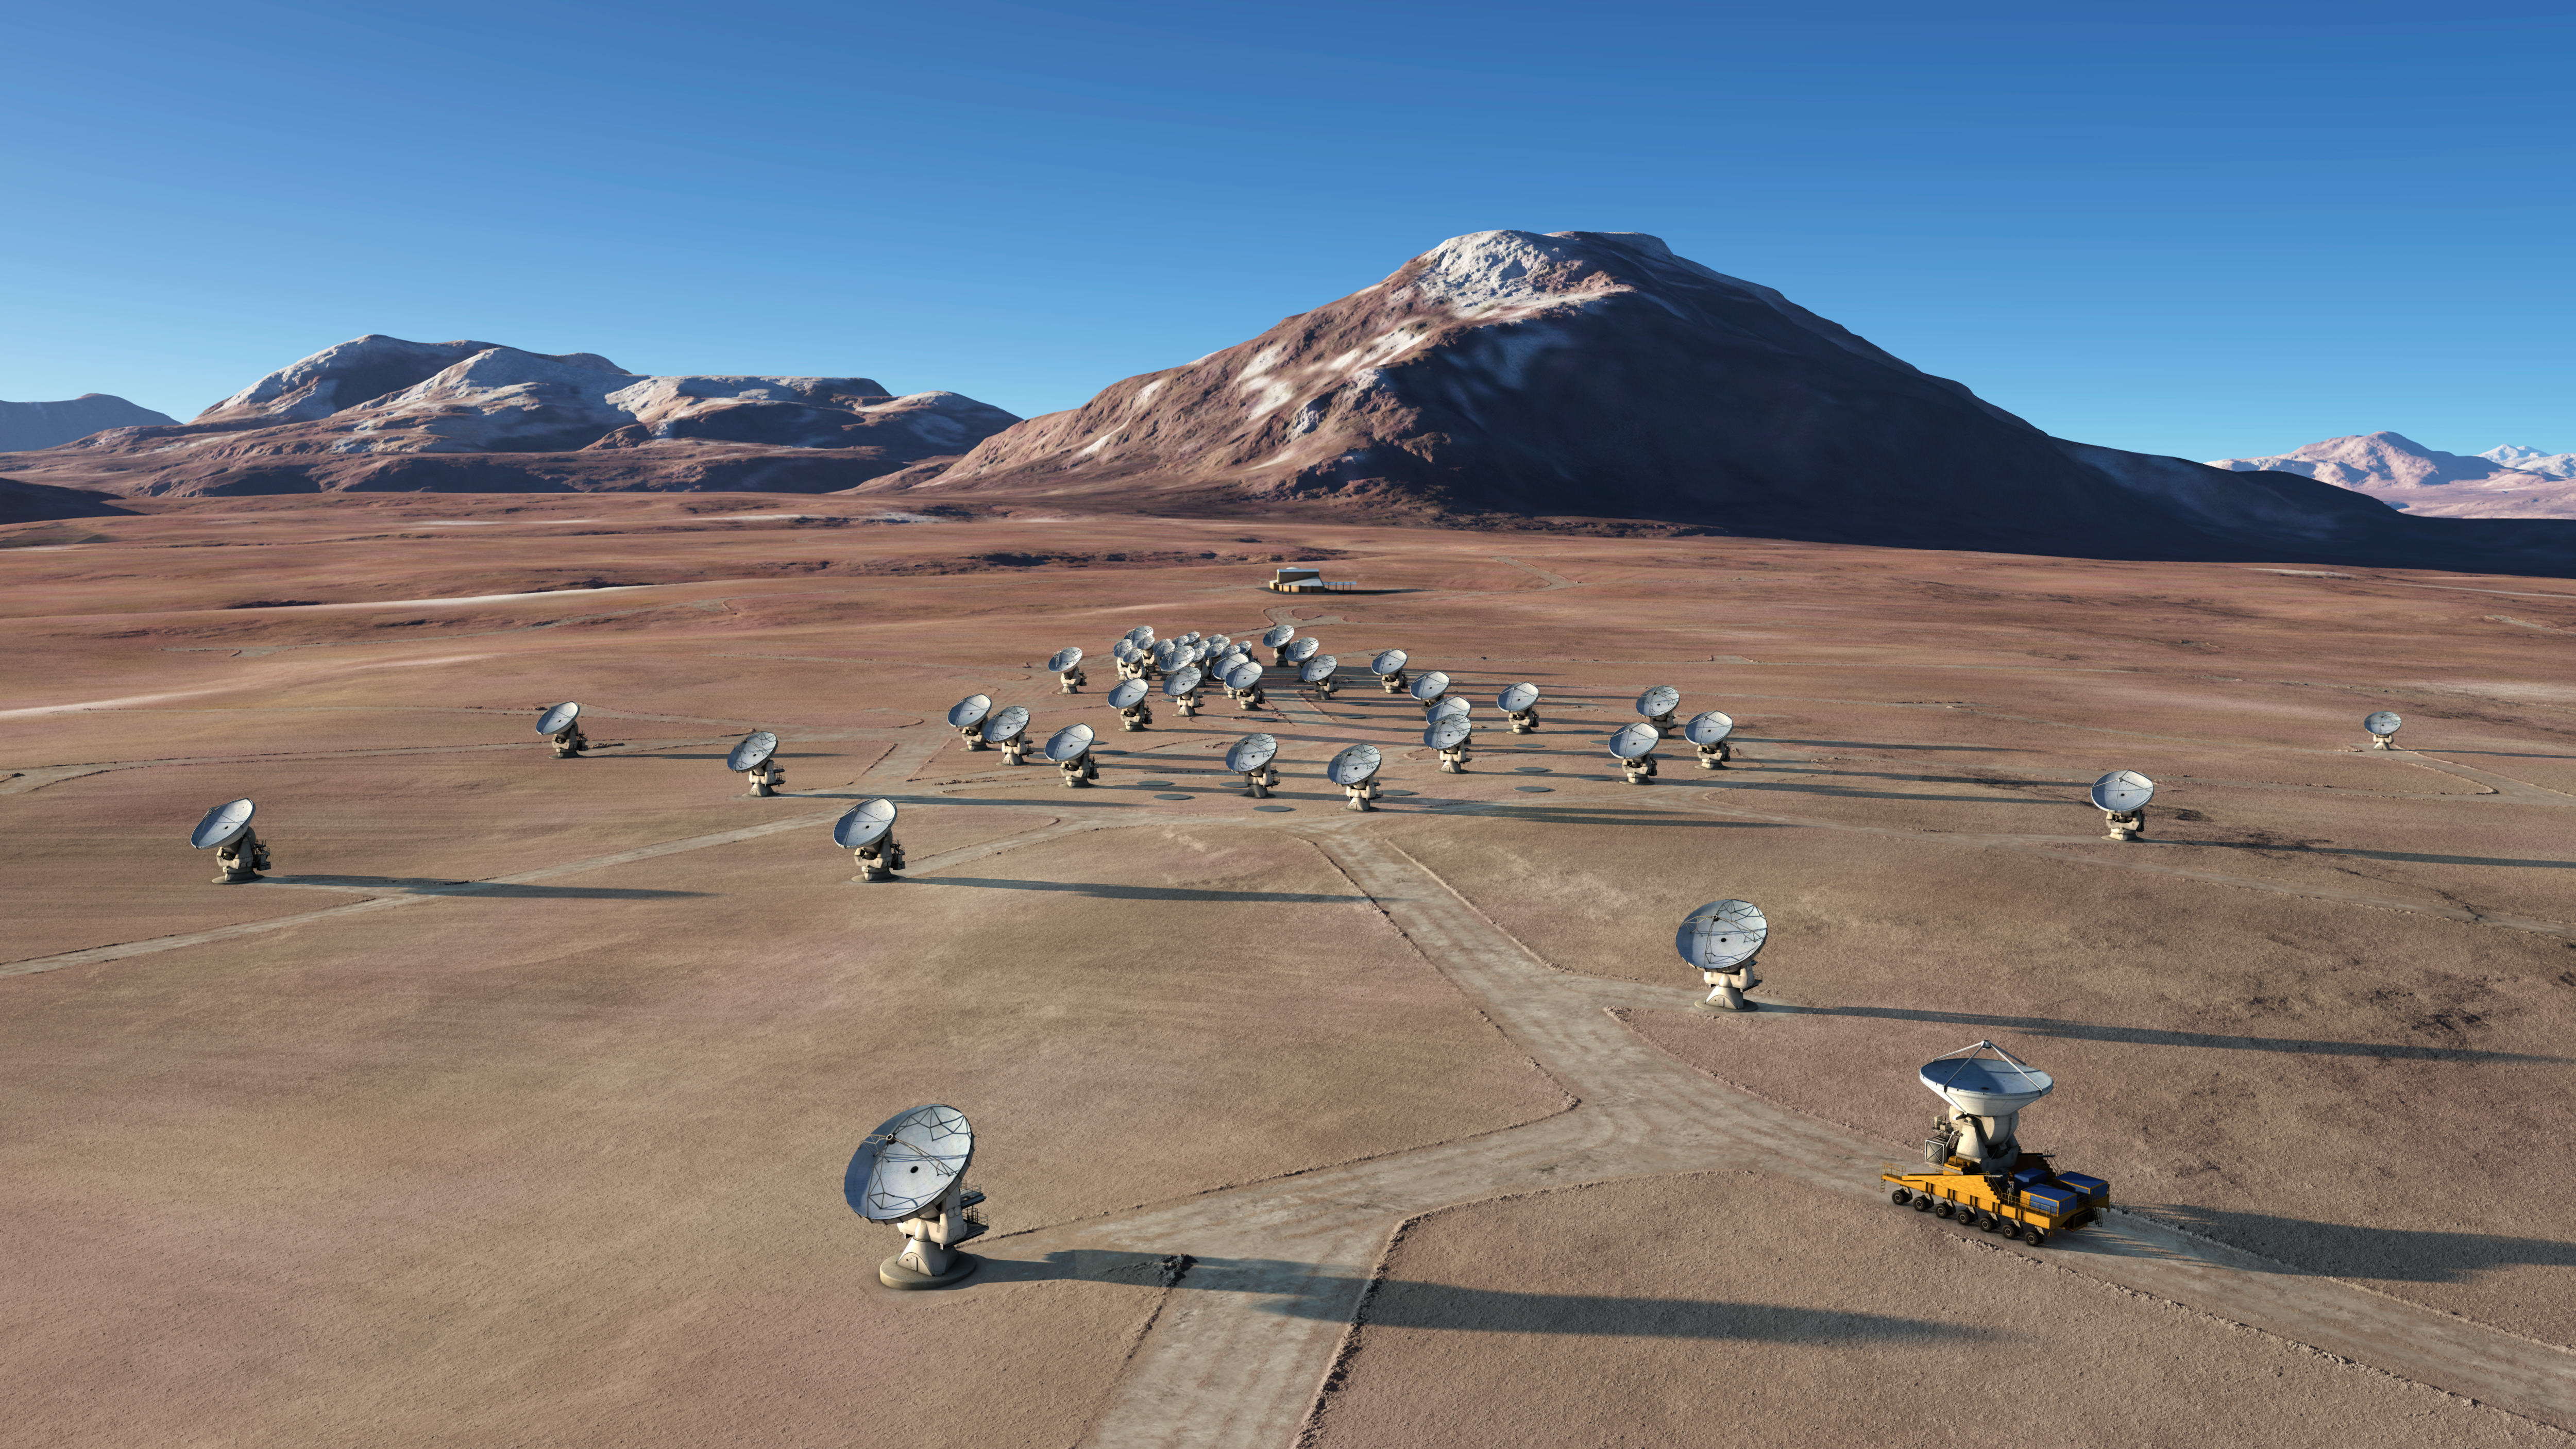
The ALMA array, as it looks now completed and standing on a Chilean high plateau at 5000 meters (16,400 ft) altitude. The first observations with ALMA of Titan have added to the Saturn moon's list of mysteries. {Credit: ALMA (ESO/NAOJ/NRAO) / L. Calçada (ESO)}

A new mystery of Titan has been uncovered by astronomers using their latest asset in the high altitude desert of Chile. Using the now fully deployed Atacama Large Millimeter Array (ALMA) telescope in Chile, astronomers moved from observing comets to Titan. A single 3 minute observation revealed organic molecules that are askew in the atmosphere of Titan. The molecules in question should be smoothly distributed across the atmosphere, but they are not.

The Cassini/Huygens spacecraft at the Saturn system has been revealing the oddities of Titan to us, with its lakes and rain clouds of methane, and an atmosphere thicker than Earth’s. But the new observations by ALMA of Titan underscore how much more can be learned about Titan and also how incredible the ALMA array is.

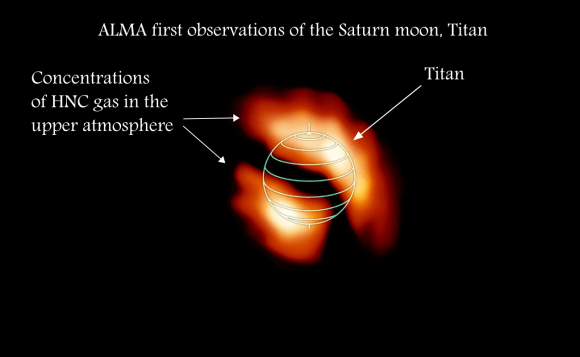
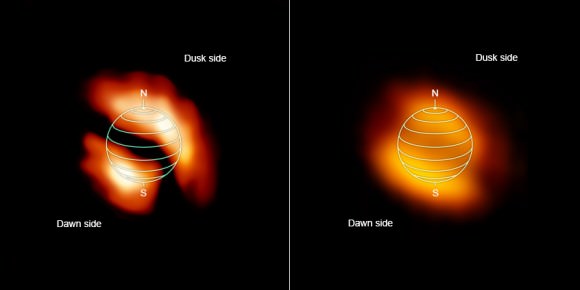
ALMA first obserations of the atmospher of Saturn's moon Titan. The image shows the distribution of the organic molecule HNC. Red to White representing low to high concenrations. The offset locations of the molecules relative to the poles suprised the researchers lead by NASA/GSFC astrochemist M. Cordiner.(Credit: NRAO/AUI/NSF; M. Cordiner (NASA) et at.)
ALMA’s first observations of the atmosphere of Saturn’s moon Titan. The image shows the distribution of the organic molecule HNC. Red to White representing low to high concentrations. The offset locations of the molecules relative to the poles surprised the researchers led by NASA/GSFC astrochemist M. Cordiner. (Credit: NRAO/AUI/NSF; M. Cordiner (NASA) et at.)

The ALMA astronomers called it a “brief 3 minute snapshot of Titan.” They found zones of organic molecules offset from the Titan polar regions. The molecules observed were hydrogen isocyanide (HNC) and cyanoacetylene (HC3N). It is a complete surprise to the astrochemist Martin Cordiner from NASA Goddard Space Flight Center in Greenbelt, Maryland. Cordiner is the lead author of the work published in the latest release of Astrophysical Journal Letters.

The NASA Goddard press release states, “At the highest altitudes, the gas pockets appeared to be shifted away from the poles. These off-pole locations are unexpected because the fast-moving winds in Titan’s middle atmosphere move in an east–west direction, forming zones similar to Jupiter’s bands, though much less pronounced. Within each zone, the atmospheric gases should, for the most part, be thoroughly mixed.”

When one hears there is a strange, skewed combination of organic compounds somewhere, the first thing to come to mind is life. However, the astrochemists in this study are not concluding that they found a signature of life. There are, in fact, other explanations that involve simpler forces of nature. The Sun and Saturn’s magnetic field deliver light and energized particles to Titan’s atmosphere. This energy causes the formation of complex organics in the Titan atmosphere. But how these two molecules – HNC and HC3N – came to have a skewed distribution is, as the astrochemists said, “very intriguing.” Cordiner stated, “This is an unexpected and potentially groundbreaking discovery… a fascinating new problem.”

The press release from the National Radio Astronomy Observatory states, “studying this complex chemistry may provide insights into the properties of Earth’s very early atmosphere.” Additionally, the new observations add to understanding Titan – a second data point (after Earth) for understanding organics of exo-planets, which may number in the hundreds of billions beyond our solar system within our Milky Way galaxy. Astronomers need more data points in order to sift through the many exo-planets that will be observed and harbor organic compounds. With Titan and Earth, astronomers will have points of comparison to determine what is happening on distant exo-planets, whether it’s life or not.

High in the atmosphere of Titan, large patches of two trace gases glow near the north pole, on the dusk side of the moon, and near the south pole, on the dawn side. Brighter colors indicate stronger signals from the two gases, HNC (left) and HC3N (right); red hues indicate less pronounced signals. Image (Credit: NRAO/AUI/NSF)
High in the atmosphere of Titan, large patches of two trace gases glow near the north pole, on the dusk side of the moon, and near the south pole, on the dawn side. Brighter colors indicate stronger signals from the two gases, HNC (left) and HC3N (right); red hues indicate less pronounced signals.
(Image Credit: NRAO/AUI/NSF)

The report of this new and brief observation also underscores the new astronomical asset in the altitudes of Chile. ALMA represents the state of the art of millimeter and sub-millimeter astronomy. This field of astronomy holds a lot of promise. Back around 1980, at the Kitt Peak National Observatory in Arizona, alongside the great visible light telescopes, there was an oddity, a millimeter wavelength dish. That dish was the beginning of radio astronomy in the 1 – 10 millimeter wavelength range. Millimeter astronomy is only about 35 years old. These wavelengths stand at the edge of the far infrared and include many light emissions and absorptions from cold objects which often include molecules and particularly organics. The ALMA array has 10 times more resolving power than the Hubble space telescope.

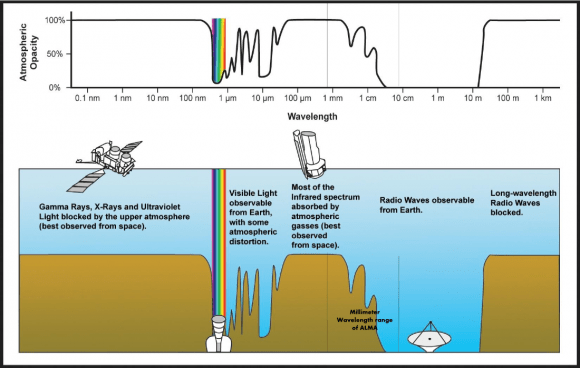
The Earth’s atmosphere stands in the way of observing the Universe in these wavelengths. By no coincidence our eyes evolved to see in the visible light spectrum. It is a very narrow band, and it means that there is a great, wide world of light waves to explore with different detectors than just our eyes.

The diagram shows the electromagnetic spectrum, the absorption of light by the Earth's atmosphere and illustrates the astronomical assets that focus on specific wavelengths of light. ALMA at the Chilean site and with modern solid state electronics is able to overcome the limitations placed by the Earth's atmosphere. (Credit: Wikimedia, T.Reyes)
The diagram shows the electromagnetic spectrum, the absorption of light by the Earth’s atmosphere, and illustrates the astronomical assets that focus on specific wavelengths of light. ALMA at the Chilean site, with modern solid state electronics, is able to overcome the limitations placed by the Earth’s atmosphere. (Credit: Wikimedia, T.Reyes)

In the millimeter range of wavelengths, water, oxygen, and nitrogen are big absorbers. Some wavelengths in the millimeter range are completely absorbed. So there are windows in this range. ALMA is designed to look at those wavelengths that are accessible from the ground. The Chajnantor plateau in the Atacama desert at 5000 meters (16,400 ft) provides the driest, clearest location in the world for millimeter astronomy outside of the high altitude regions of the Antarctic.

At high altitude and over this particular desert, there is very little atmospheric water. ALMA consists of 66 12 meter (39 ft) and 7 meter (23 ft) dishes. However, it wasn’t just finding a good location that made ALMA. The 35 year history of millimeter-wavelength astronomy has been a catch up game. Detecting these wavelengths required very sensitive detectors – low noise in the electronics. The steady improvement in solid-state electronics from the late 70s to today and the development of cryostats to maintain low temperatures have made the new observations of Titan possible. These are observations that Cassini at 1000 kilometers from Titan could not do but ALMA at 1.25 billion kilometers (775 million miles) away could.

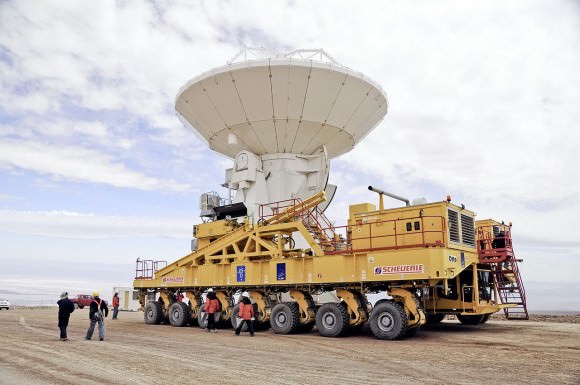
The 130 ton German Antenna Dish Transporter, nicknamed Otto. The ALMA transporter vehicle carefully carries the state-of-the-art antenna, with a diameter of 12 metres and a weight of about 100 tons, on the 28 km journey to the Array Operations Site, which is at an altitude of 5000 m. The antenna is designed to withstand the harsh conditions at the high site, where the extremely dry and rarefied air is ideal for ALMA’s observations of the universe at millimetre- and sub-millimetre-wavelengths. (Credit: ESO)

The ALMA telescope array was developed by a consortium of countries led by the United States’ National Science Foundation (NSF) and countries of the European Union though ESO (European Organisation for Astronomical Research in the Southern Hemisphere). The first concepts were proposed in 1999. Japan joined the consortium in 2001.

The prototype ALMA telescope was tested at the site of the VLA in New Mexico in 2003. That prototype now stands on Kitt Peak having replaced the original millimeter wavelength dish that started this branch of astronomy in the 1980s. The first dishes arrived in 2007 followed the next year by the huge transporters for moving each dish into place at such high altitude. The German-made transporter required a cabin with an oxygen supply so that the drivers could work in the rarefied air at 5000 meters. The transporter was featured on an episode of the program Monster Moves. By 2011, test observations were taking place, and by 2013 the first science program was undertaken. This year, the full array was in place and the second science program spawned the Titan observations. Many will follow. ALMA, which can operate 24 hours per day, will remain the most powerful instrument in its class for about 10 years when another array in Africa will come on line.

References:

NASA Goddard Press Release

NRAO Press Release

ALMA Observatory Website

Alma Measurements Of The Hnc And Hc3N Distributions In Titan’s Atmosphere“, M. A. Cordiner, et al., Astrophysical Journal Letters

The Sun Fires Off a Third X-Class Flare

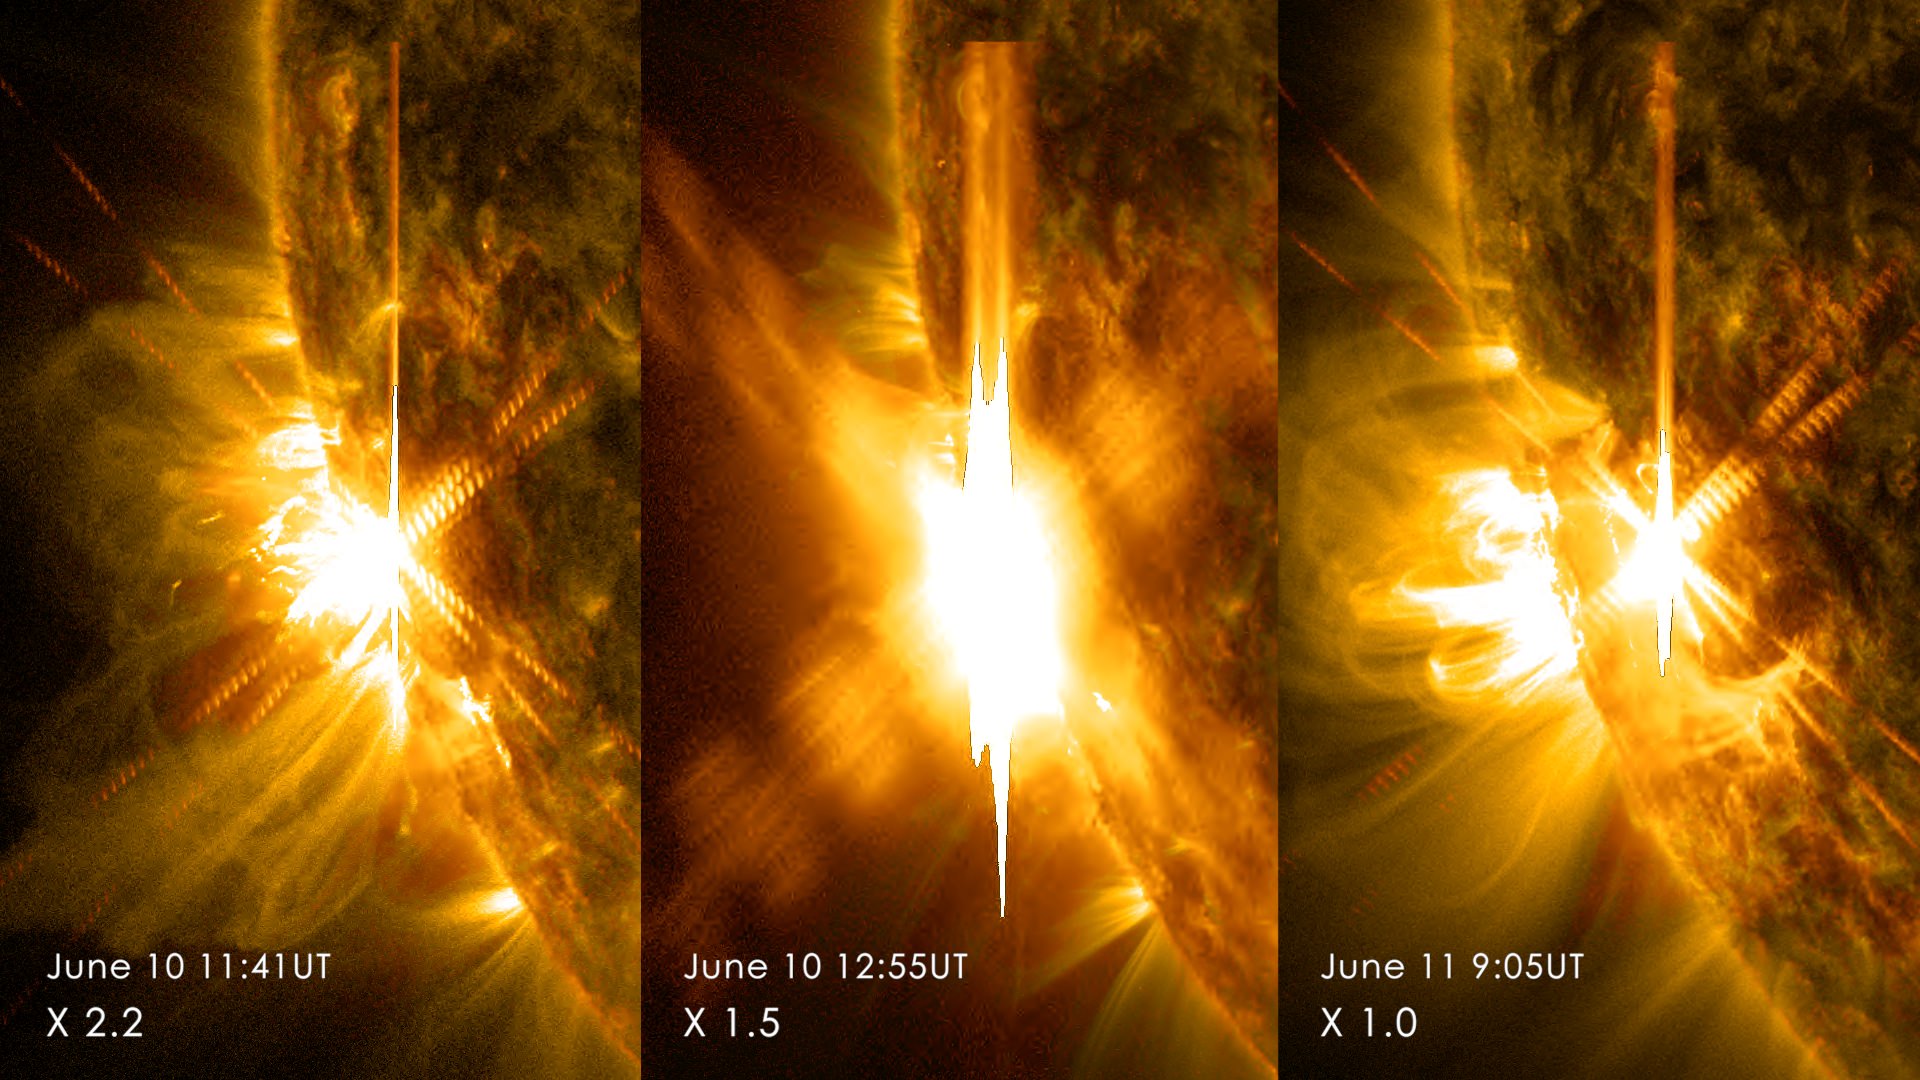
A "triple X" on June 10-11, 2014 with three flares from AR2087 (NASA/SDO/GSFC)

Remember yesterday when we mentioned two X-class flares erupting from the Sun within the space of about an hour? We probably should have waited a bit and gone for the trifecta: this morning the same active region flared yet again, making it three high-powered flares within a single 24-hour period.

(And to think this active region has only just come around the corner!)
On June 10, 2014, AR2087 announced its arrival around the southwestern limb of the Sun with an X2.2 flare at 11:41 UT (7:41 a.m. EDT). Then, just over an hour later, another eruption: an X1.5 flare at 12:55 UT. This got pretty much everyone’s attention… here comes 2087!

Perhaps figuring third time’s a charm, the active region blazed with a third flare this morning at 9:05 UT (5:05 a.m. EDT). “Only” an X1-class, it was the weakest of the three but AR2087 still has plenty of time for more as it makes its way around the Sun’s face — all the while aiming more and more our way, too.

Here’s a video of SDO observations showing the two June 10 flares:

X-class flares are the strongest in the letter-classification of solar flares, which send blasts of electromagnetic energy out into the Solar System. While these most recent three are low on the X-scale, they may result in increased auroral activity — especially since it appears that the first two were followed by a pair of CMEs that “cannibalized” each other on their way out. The resulting merged cloud of charged particles is expected to nick Earth’s magnetic field on Friday, June 13. (Source: Spaceweather.com)

No CME has been observed from the June 11 flare, but again: AR2087 hasn’t left the stage yet. Stay tuned!

Source: NASA. Learn more about how solar flares impact us on Earth here.

Selfies from Around the World Combine to Make a Portrait of Earth

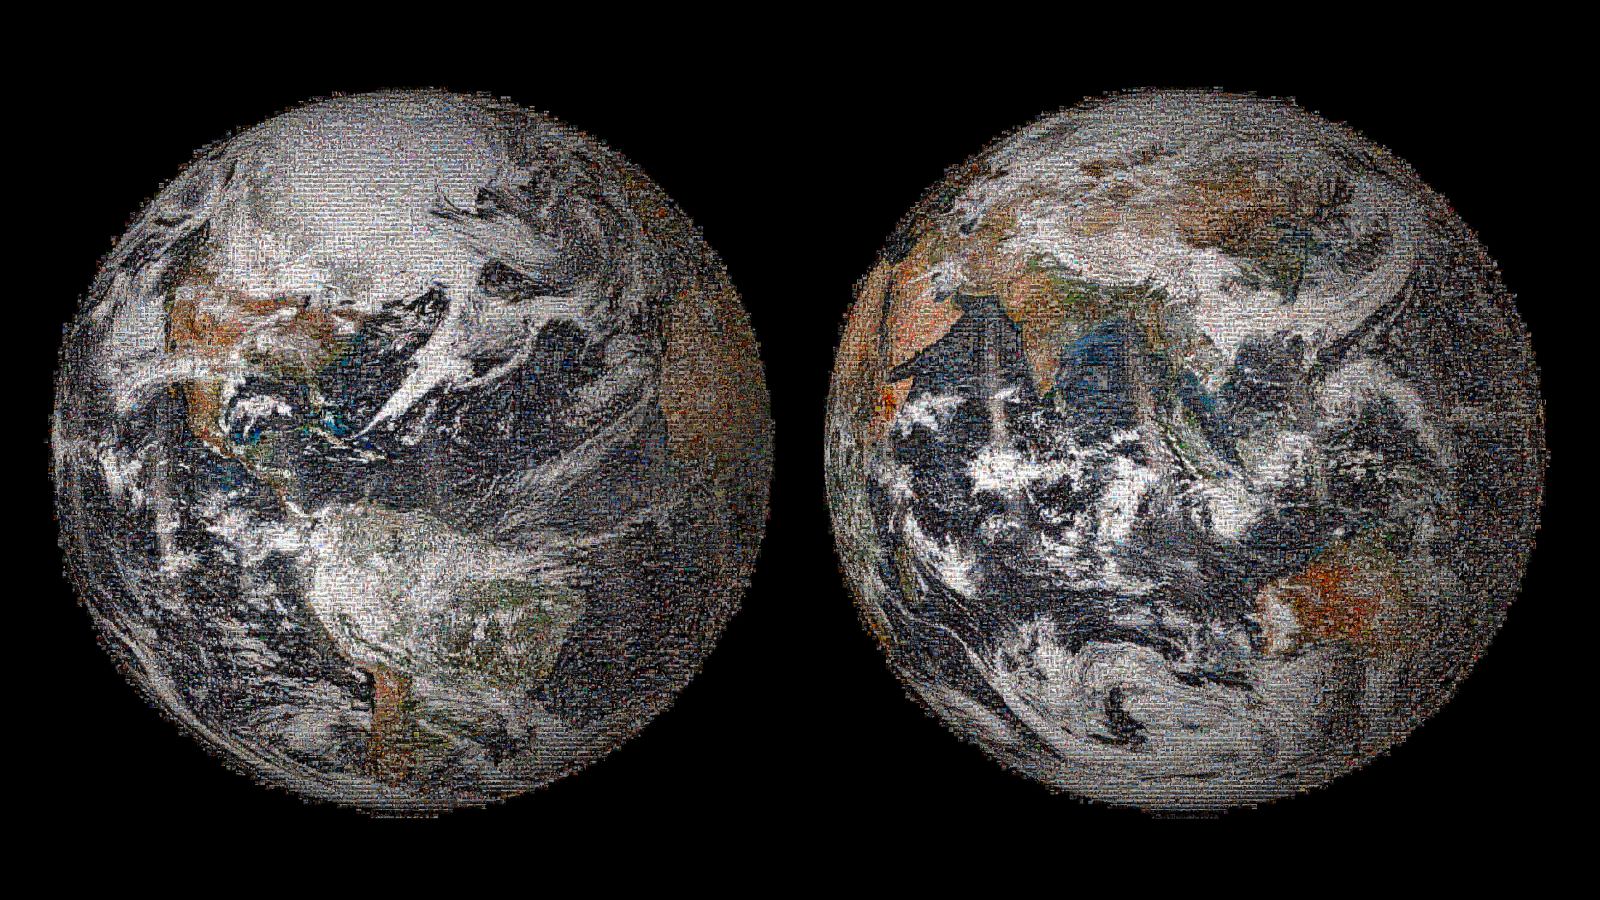
Images of Earth assembled from over 36,000 fan-submitted "selfless" on Earth Day, April 22, 2014 (NASA)

On Earth Day, April 22, NASA invited people around the world to share their “selfies” on social media sites like Twitter, Facebook, Google+, and Instagram, showing where on Earth they are and marking them with the hashtag #GlobalSelfie. Well, here we are a month later and the results have just been released… proof of what a beautiful world we all make up!

The image above was built using 36,422 fan-submitted self-portraits from 113 countries, and is based upon images of Earth acquired on April 22 by NASA/NOAA’s Visible Infrared Imaging Radiometer Suite instrument aboard the Suomi National Polar-orbiting Partnership (NPP) satellite. (See the original NPP images here.)

How cool is that? A picture of Earth, as seen from space, recomposed of pictures of people on Earth taken the very same day!

Did you send in a #GlobalSelfie? I’m in there somewhere too, but I haven’t located myself (yet). They’re organized by hue and tone, not location, so I could be representing a spot in the middle of the Peruvian jungle instead of along the Providence River.

View the full zoomable 3.2-gigapixel image on GigaPan here.

The GlobalSelfie campaign was more than just a PR gimmick. 2014 is a big year for NASA Earth observation, with five missions launched to monitor our planet’s wind, oceans, soil, and atmosphere. GlobalSelfie was used to kick off the Earth Right Now campaign, helping to raise awareness about these missions and the data they’ll gather to ultimately benefit people around the world.

Source: NASA/GSFC

Watch the Sun Split Apart

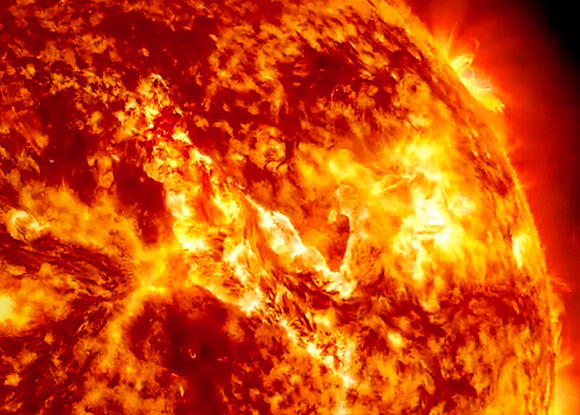
Canyon of Fire on the Sun, Credit: NASA/SDO/AIA)

Here’s your amazing oh-my-gosh-space-is-so-cool video of the day — a “canyon of fire” forming on the Sun after the liftoff and detachment of an enormous filament on September 29-30. A new video, created from images captured by the Solar Dynamics Observatory (SDO) and assembled by NASA’s Goddard Space Flight Center, shows the entire dramatic event unfolding in all its mesmerizing magnetic glory.

Watch it below:

Solarrific! (And I highly suggest full-screening it in HD.) That filament was 200,000 miles long, and the rift that formed afterwards was well over a dozen Earths wide!

Captured in various wavelengths of light by SDO’s Atmospheric Imaging Assembly (AIA) the video shows the solar schism in different layers of the Sun’s corona, which varies greatly in temperature at different altitudes.

According to the description from Karen Fox at GSFC:

“The red images shown in the movie help highlight plasma at temperatures of 90,000° F and are good for observing filaments as they form and erupt. The yellow images, showing temperatures at 1,000,000° F, are useful for observing material coursing along the sun’s magnetic field lines, seen in the movie as an arcade of loops across the area of the eruption. The browner images at the beginning of the movie show material at temperatures of 1,800,000° F, and it is here where the canyon of fire imagery is most obvious.”

Now, there’s not really any “fire” on the Sun — that’s just an illustrative term. What we’re actually seeing here is plasma contained by powerful magnetic fields that constantly twist and churn across the Sun’s surface and well up from its interior. The Sun is boiling with magnetic fields, and when particularly large ones erupt from deep below its surface we get the features we see as sunspots, filaments, and prominences.

When those fields break, the plasma they contained gets blasted out into space as coronal mass ejections… and this is what typically happens when one hits Earth. (But it could be much worse.)

Hey, that’s what it’s like living with a star!

Stay up to date on the latest solar events on the SDO mission page here.

This is the Moon, the Whole Moon and Nothing But the Moon

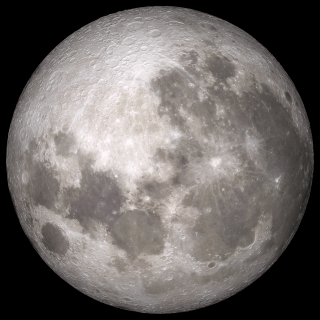
Synthetic view of the waxing Moon as viewed from Earth on 2013-10-15 17:00:00 UTC [NASA/GSFC/Arizona State University].

Take a look around the Moon… no, really, take a good look AROUND the Moon! This is a fantastic animation of our planetary partner in space made by the folks on the Lunar Reconnaissance Orbiter team at Arizona State University. Assembled from reflectance maps and digital terrain models created from data gathered by LRO’s wide-angle camera, this full 360-degree portrait of the Moon shows its surface as if it were receiving direct top-down sunlight on all points — a physical impossibility, yes, but it gives us a great view of pretty much everything (including the far side, which for obvious reasons most of us never get a good look at.)

In addition to shining a light on the lunar landscape (pun intended) the vast amounts of data used to create the view above can also be used to calculate the type of illumination that would be found on any point on the Moon, at any time, allowing for better targeted observation planning with LRO’s narrow-angle camera.

Read more about how this process was engineered here, and see a more recent result of these new capabilities below:

While the image above wouldn’t have been visible from anywhere on North America on October 15, 2013 at 2 p.m. EDT, it’s what would have been seen in the night sky above Mumbai — but no international calls to India were needed, as the view could simply be generated from the LRO WAC data and a ray-tracing algorithm that plots the angles of light and shadow across the lunar terrain. Voilà — it’s Insta-Moon*!

*Some assembly required.

Read more on the Arizona State University LROC site here (and to really blow your mind, watch the high-resolution version here.)

Want to explore the Moon on your Android or iPhone? Check out our Phases of the Moon app!

Bottoms Up! It’s a Year of Lunar Libration From Down Under

Full moon, south up (NASA/GSFC)


Do you live in the southern hemisphere? Are you tired of all those views of the Moon that favor celestial north as up? Well here’s a video just for you from the good folks at the GSFC Scientific Visualization Center — it shows the full 2013 year of lunar phases and libration as seen from Earth’s southern half using data gathered by NASA’s Lunar Reconnaissance Orbiter. (Because what’s so great about north, anyway?)

Each frame represents one hour. Side graphs indicate the Moon’s orbit position, sub-Earth and subsolar points, and distance from the Earth at true scale. Awesome! Um, I mean… bonzer!

And what’s up with all that wobbling around? Find out more below:

The Moon always keeps the same face to us, but not exactly the same face. Because of the tilt and shape of its orbit, we see the Moon from slightly different angles over the course of a month. When a month is compressed into 24 seconds, as it is in this animation, our changing view of the Moon makes it look like it’s wobbling. This wobble is called libration.

The word comes from the Latin for “balance scale” and refers to the way such a scale tips up and down on alternating sides.

The Moon is subject to other motions as well. It appears to roll back and forth around the sub-Earth point (the location on the Moon’s surface where the Earth appears directly overhead, at the zenith.) The roll angle is given by the position angle of the axis, which is the angle of the Moon’s north pole relative to celestial north. The Moon also approaches and recedes from us, appearing to grow and shrink. The two extremes, called perigee (near) and apogee (far), differ by more than 10%.

Read more and see the current phase of the Moon (bottom up) on the GSFC Dial-a-Moon page here.

Source: NASA Goddard Space Flight Center Scientific Visualization Studio

LRO Makes a Map of the Moon’s Water

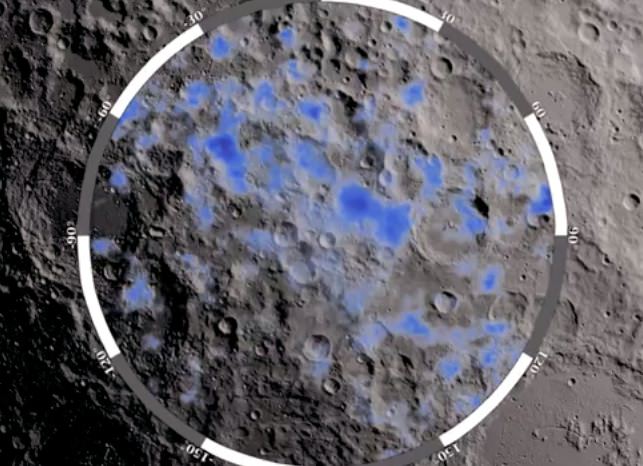
The blue areas show locations on the Moon's south pole where water ice is likely to exist (NASA/GSFC)

The Moon might seem like a poor place to hunt for water, but in fact there’s a decent amount of the stuff dispersed throughout the lunar soil — and even more of it existing as ice deposits in the dark recesses of polar craters. While the LCROSS mission crashed a rocket stage into one of these craters in October 2009 and confirmed evidence of water in the resulting plume of debris, there haven’t been any definitive maps made of water deposits across a large area on the Moon — until now.

Over the course of several years, NASA’s Lunar Reconnaissance Orbiter scanned the Moon’s south pole using its Lunar Exploration Neutron Detector (LEND) to measure how much hydrogen is trapped within the lunar soil. Areas exhibiting suppressed neutron activity — shown above in blue — indicate where hydrogen atoms are concentrated most, strongly suggesting the presence of water molecules… aka H2O.

The incredibly-sensitive LEND instrument measures the flux of neutrons from the Moon, which are produced by the continuous cosmic ray bombardment of the lunar surface. Even a fraction of hydrogen as small as 100 ppm can make a measurable change in neutron distribution from the surface of worlds with negligible atmospheres, and the hydrogen content can be related to the presence of water.

No other neutron instrument with LEND’s imaging capability has ever been flown in space.

Watch the video below for more details as to how LRO and LEND obtained these results:

“While previous lunar missions have observed indications of hydrogen at the Moon’s south pole, the LEND measurements for the first time pinpoint where hydrogen, and thus water, is likely to exist.”

What’s so important about finding water on the Moon? Well besides helping answer the question of where water on Earth and within the inner Solar System originated, it could also be used by future lunar exploration missions to produce fuel for rockets, drinking water, and breathable air. Read more here.

Video credit: NASA Goddard Space Flight Center

Multiple Dinosaur Tracks Confirmed at NASA Center

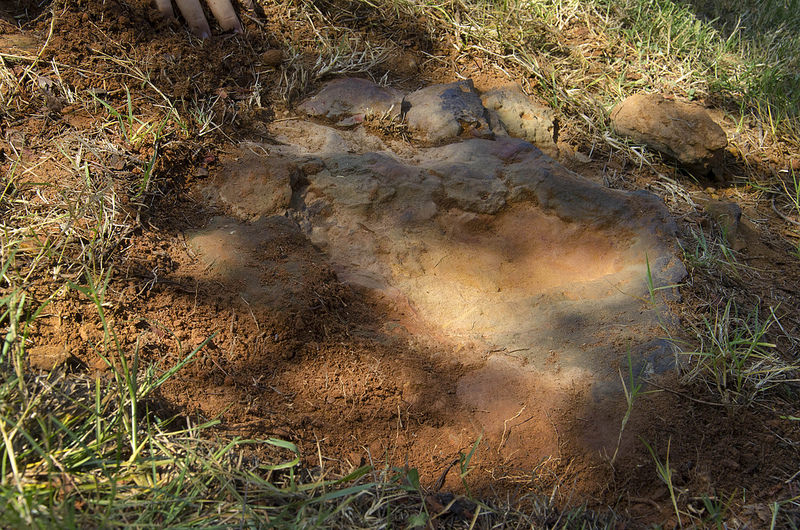
Fossilized nodosaur footprints discovered at NASA’s Goddard Space Flight Center in Maryland. (NASA/GSFC/Rebecca Roth)

At NASA’s Goddard Space Flight Center in Greenbelt, MD, where some of the world’s most advanced research in space technology is being performed on a daily basis, paleontologists have discovered ancient evidence of dinosaurs on the Center’s wooded campus — at least two, possibly a mother and child, crossed that way between 112 and 110 million years ago and left their muddy footprints as proof.

The tracks of two nodosaurs — short, stocky and heavily-armored herbivorous dinosaurs — have been confirmed by dinosaur tracker Ray Stanford and USGS emeritus paleontologist Dr. Robert Weems. The second track is a smaller version of the first.

The first, larger footprint was announced by Stanford on August 17. When Dr. Weems was called in to verify, the smaller print was discovered within the first, evidence that they were made around the same time and leading researchers to suggest it may have been a mother-and-child pair.

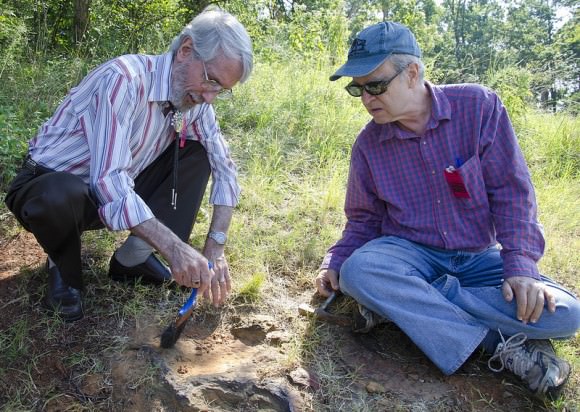
Dinosaur tracker Ray Stanford describes the cretaceous-era nodosaur track he found on the Goddard Space Flight Center campus with Dr. Robert Weems, emeritus paleontologist for the USGS who verified his discovery. (NASA/GSFC/Rebecca Roth)

“It looks to be a manus (front foot) print of a much smaller dinosaur than the first one, but it looks to be the same type,” Weems said of the second track. “If the one that came through was a female, it may have had one or more young ones following along. If you’ve seen a dog or cat walking with its young, they kind of sniff around and may not go in the same direction, but they end up in the same place.”

It’s thought that the nodosaurs were moving quickly since the tracks don’t show strong imprints of the animals’ heels. Still, the ruddy Cretaceous-era mud preserved their brief passage well — even as millions of years went by.

“This was a large, armored dinosaur,” Stanford said. “Think of it as a four-footed tank. It was quite heavy, there’s a quite a ridge or push-up here. Subsequently the sand was bound together by iron-oxide or hematite, so it gave us a nice preservation, almost like concrete.”

The next steps will be to have the site analyzed to determine whether further excavation is called for, and possibly to extract and preserve the existing footprints.

“Space scientists may walk along here, and they’re walking exactly where this big, bungling heavy armored dinosaur walked, maybe 110 to 112 million years ago.”

– Ray Stanford

Read more on the GSFC site here.