Precise New Measurements From Hubble Confirm the Accelerating Expansion of the Universe. Still no Idea Why it’s Happening

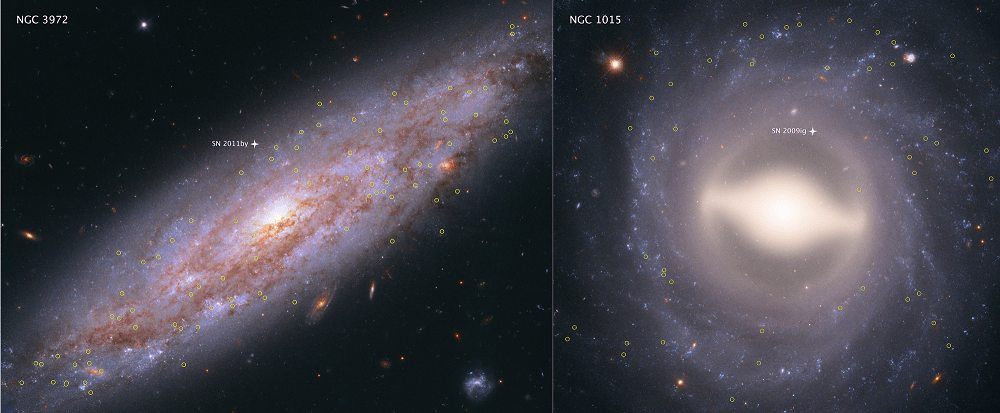
These Hubble Space Telescope images showcase two of the 19 galaxies analyzed in a project to improve the precision of the universe's expansion rate, a value known as the Hubble constant. The color-composite images show NGC 3972 (left) and NGC 1015 (right), located 65 million light-years and 118 million light-years, respectively, from Earth. The yellow circles in each galaxy represent the locations of pulsating stars called Cepheid variables. Credits: NASA, ESA, A. Riess (STScI/JHU)

In the 1920s, Edwin Hubble made the groundbreaking revelation that the Universe was in a state of expansion. Originally predicted as a consequence of Einstein’s Theory of General Relativity, this confirmation led to what came to be known as Hubble’s Constant. In the ensuring decades, and thanks to the deployment of next-generation telescopes – like the aptly-named Hubble Space Telescope (HST) – scientists have been forced to revise this law.

In short, in the past few decades, the ability to see farther into space (and deeper into time) has allowed astronomers to make more accurate measurements about how rapidly the early Universe expanded. And thanks to a new survey performed using Hubble, an international team of astronomers has been able to conduct the most precise measurements of the expansion rate of the Universe to date.

This survey was conducted by the Supernova H0 for the Equation of State (SH0ES) team, an international group of astronomers that has been on a quest to refine the accuracy of the Hubble Constant since 2005. The group is led by Adam Reiss of the Space Telescope Science Institute (STScI) and Johns Hopkins University, and includes members from the American Museum of Natural History, the Neils Bohr Institute, the National Optical Astronomy Observatory, and many prestigious universities and research institutions.
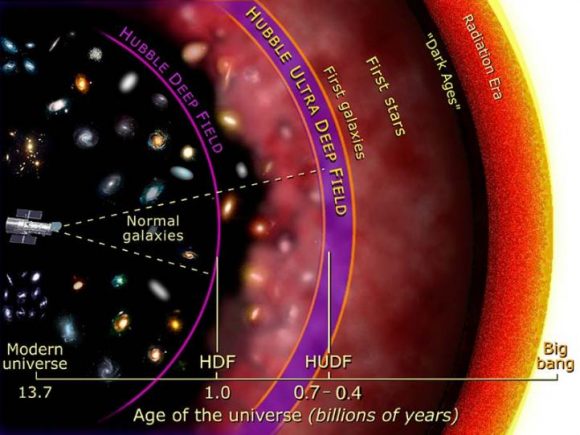
Illustration of the depth by which Hubble imaged galaxies in prior Deep Field initiatives, in units of the Age of the Universe. Credit: NASA and A. Feild (STScI)

The study which describes their findings recently appeared in The Astrophysical Journal under the title “Type Ia Supernova Distances at Redshift >1.5 from the Hubble Space Telescope Multi-cycle Treasury Programs: The Early Expansion Rate“. For the sake of their study, and consistent with their long term goals, the team sought to construct a new and more accurate “distance ladder”.

This tool is how astronomers have traditionally measured distances in the Universe, which consists of relying on distance markers like Cepheid variables – pulsating stars whose distances can be inferred by comparing their intrinsic brightness with their apparent brightness. These measurements are then compared to the way light from distance galaxies is redshifted to determine how fast the space between galaxies is expanding.

From this, the Hubble Constant is derived. To build their distant ladder, Riess and his team conducted parallax measurements using Hubble’s Wide Field Camera 3 (WFC3) of eight newly-analyzed Cepheid variable stars in the Milky Way. These stars are about 10 times farther away than any studied previously – between 6,000 and 12,000 light-year from Earth – and pulsate at longer intervals.

To ensure accuracy that would account for the wobbles of these stars, the team also developed a new method where Hubble would measure a star’s position a thousand times a minute every six months for four years. The team then compared the brightness of these eight stars with more distant Cepheids to ensure that they could calculate the distances to other galaxies with more precision.
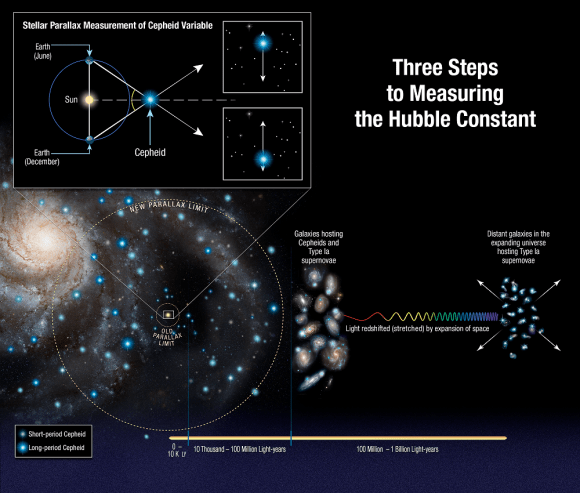
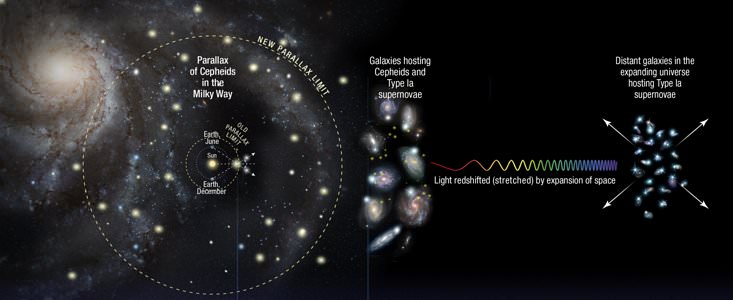
Illustration showing three steps astronomers used to measure the universe’s expansion rate (Hubble constant) to an unprecedented accuracy, reducing the total uncertainty to 2.3 percent. Credits: NASA/ESA/A. Feild (STScI)/and A. Riess (STScI/JHU)

Using the new technique, Hubble was able to capture the change in position of these stars relative to others, which simplified things immensely. As Riess explained in a NASA press release:

“This method allows for repeated opportunities to measure the extremely tiny displacements due to parallax. You’re measuring the separation between two stars, not just in one place on the camera, but over and over thousands of times, reducing the errors in measurement.”

Compared to previous surveys, the team was able to extend the number of stars analyzed to distances up to 10 times farther. However, their results also contradicted those obtained by the European Space Agency’s (ESA) Planck satellite, which has been measuring the Cosmic Microwave Background (CMB) – the leftover radiation created by the Big Bang – since it was deployed in 2009.

By mapping the CMB, Planck has been able to trace the expansion of the cosmos during the early Universe – circa. 378,000 years after the Big Bang. Planck’s result predicted that the Hubble constant value should now be 67 kilometers per second per megaparsec (3.3 million light-years), and could be no higher than 69 kilometers per second per megaparsec.
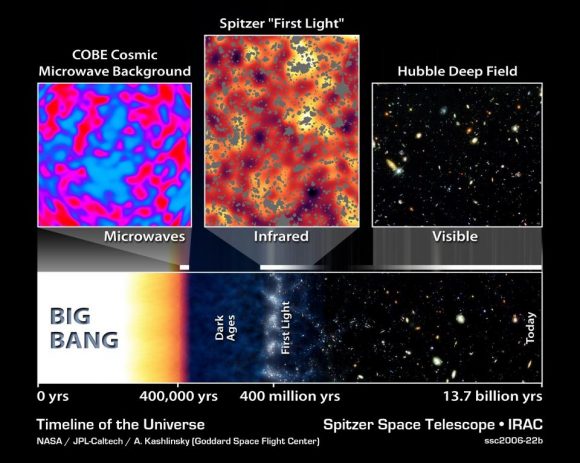
The Big Bang timeline of the Universe. Cosmic neutrinos affect the CMB at the time it was emitted, and physics takes care of the rest of their evolution until today. Credit: NASA/JPL-Caltech/A. Kashlinsky (GSFC).

Based on their sruvey, Riess’s team obtained a value of 73 kilometers per second per megaparsec, a discrepancy of 9%. Essentially, their results indicate that galaxies are moving at a faster rate than that implied by observations of the early Universe. Because the Hubble data was so precise, astronomers cannot dismiss the gap between the two results as errors in any single measurement or method. As Reiss explained:

“The community is really grappling with understanding the meaning of this discrepancy… Both results have been tested multiple ways, so barring a series of unrelated mistakes. it is increasingly likely that this is not a bug but a feature of the universe.”

These latest results therefore suggest that some previously unknown force or some new physics might be at work in the Universe. In terms of explanations, Reiss and his team have offered three possibilities, all of which have to do with the 95% of the Universe that we cannot see (i.e. dark matter and dark energy). In 2011, Reiss and two other scientists were awarded the Nobel Prize in Physics for their 1998 discovery that the Universe was in an accelerated rate of expansion.

Consistent with that, they suggest that Dark Energy could be pushing galaxies apart with increasing strength. Another possibility is that there is an undiscovered subatomic particle out there that is similar to a neutrino, but interacts with normal matter by gravity instead of subatomic forces. These “sterile neutrinos” would travel at close to the speed of light and could collectively be known as “dark radiation”.
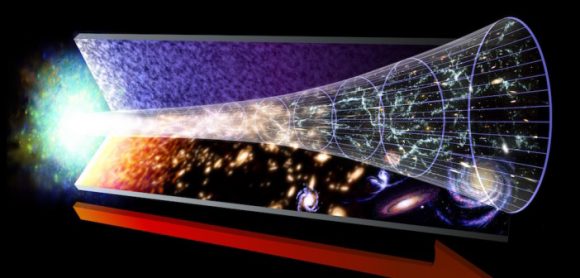
This illustration shows the evolution of the Universe, from the Big Bang on the left, to modern times on the right. Credit: NASA

Any of these possibilities would mean that the contents of the early Universe were different, thus forcing a rethink of our cosmological models. At present, Riess and colleagues don’t have any answers, but plan to continue fine-tuning their measurements. So far, the SHoES team has decreased the uncertainty of the Hubble Constant to 2.3%.

This is in keeping with one of the central goals of the Hubble Space Telescope, which was to help reduce the uncertainty value in Hubble’s Constant, for which estimates once varied by a factor of 2.

So while this discrepancy opens the door to new and challenging questions, it also reduces our uncertainty substantially when it comes to measuring the Universe. Ultimately, this will improve our understanding of how the Universe evolved after it was created in a fiery cataclysm 13.8 billion years ago.

Further Reading: NASA, The Astrophysical Journal

At the Largest Scales, Our Milky Way Galaxy is in the Middle of Nowhere

The Millenium Simulation created this image of the large-scale structure of the Universe, showing filaments and voids within the cosmic structure. According to a new study from the University of Wisconsin, our Milky Way is situated in a huge void in the cosmic structure. The Millennium Simulation is a project of the Max Planck Supercomputing Center in Germany. Image: Millennium Simulation Project
Image of the large-scale structure of the Universe, showing filaments and voids within the cosmic structure. Who knows how many other civilizations might be out there? Credit: Millennium Simulation Project

Ever since Galileo pointed his telescope at Jupiter and saw moons in orbit around that planet, we began to realize we don’t occupy a central, important place in the Universe. In 2013, a study showed that we may be further out in the boondocks than we imagined. Now, a new study confirms it: we live in a void in the filamental structure of the Universe, a void that is bigger than we thought.

In 2013, a study by University of Wisconsin–Madison astronomer Amy Barger and her student Ryan Keenan showed that our Milky Way galaxy is situated in a large void in the cosmic structure. The void contains far fewer galaxies, stars, and planets than we thought. Now, a new study from University of Wisconsin student Ben Hoscheit confirms it, and at the same time eases some of the tension between different measurements of the Hubble Constant.

The void has a name; it’s called the KBC void for Keenan, Barger and the University of Hawaii’s Lennox Cowie. With a radius of about 1 billion light years, the KBC void is seven times larger than the average void, and it is the largest void we know of.

The large-scale structure of the Universe consists of filaments and clusters of normal matter separated by voids, where there is very little matter. It’s been described as “Swiss cheese-like.” The filaments themselves are made up of galaxy clusters and super-clusters, which are themselves made up of stars, gas, dust and planets. Finding out that we live in a void is interesting on its own, but its the implications it has for Hubble’s Constant that are even more interesting.

Hubble’s Constant is the rate at which objects move away from each other due to the expansion of the Universe. Dr. Brian Cox explains it in this short video.

The problem with Hubble’s Constant, is that you get a different result depending on how you measure it. Obviously, this is a problem. “No matter what technique you use, you should get the same value for the expansion rate of the universe today,” explains Ben Hoscheit, the Wisconsin student who presented his analysis of the KBC void on June 6th at a meeting of the American Astronomical Society. “Fortunately, living in a void helps resolve this tension.”

There are a couple ways of measuring the expansion rate of the Universe, known as Hubble’s Constant. One way is to use what are known as “standard candles.” Supernovae are used as standard candles because their luminosity is so well-understood. By measuring their luminosity, we can determine how far away the galaxy they reside in is.

Another way is by measuring the CMB, the Cosmic Microwave Background. The CMB is the left over energy imprint from the Big Bang, and studying it tells us the state of expansion in the Universe.

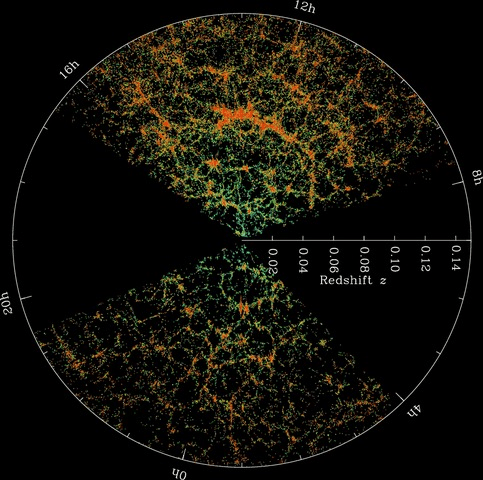
This is a map of the observable Universe from the Sloan Digital Sky Survey. Orange areas show higher density of galaxy clusters and filaments. Image: Sloan Digital Sky Survey.

The two methods can be compared. The standard candle approach measures more local distances, while the CMB approach measures large-scale distances. So how does living in a void help resolve the two?

Measurements from inside a void will be affected by the much larger amount of matter outside the void. The gravitational pull of all that matter will affect the measurements taken with the standard candle method. But that same matter, and its gravitational pull, will have no effect on the CMB method of measurement.

“One always wants to find consistency, or else there is a problem somewhere that needs to be resolved.” – Amy Barger, University of Hawaii, Dept. of Physics and Astronomy

Hoscheit’s new analysis, according to Barger, the author of the 2013 study, shows that Keenan’s first estimations of the KBC void, which is shaped like a sphere with a shell of increasing thickness made up of galaxies, stars and other matter, are not ruled out by other observational constraints.

“It is often really hard to find consistent solutions between many different observations,” says Barger, an observational cosmologist who also holds an affiliate graduate appointment at the University of Hawaii’s Department of Physics and Astronomy. “What Ben has shown is that the density profile that Keenan measured is consistent with cosmological observables. One always wants to find consistency, or else there is a problem somewhere that needs to be resolved.”

What are Cepheid Variables?

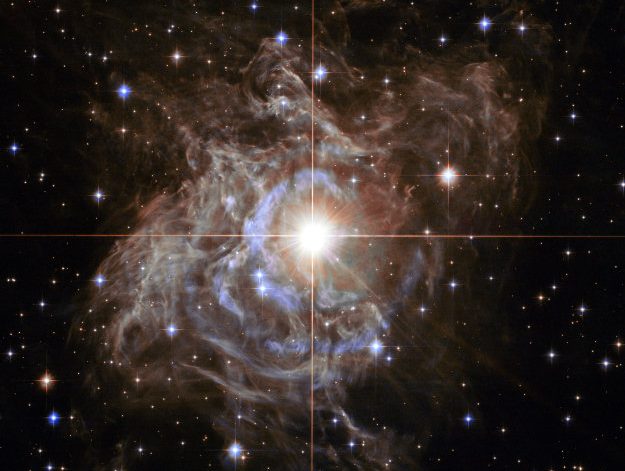
Hubble image of variable star RS Puppis (NASA, ESA, and the Hubble Heritage Team)

The Universe is a really, really big place. We’re talking… imperceptibly big! In fact, based on decades worth of observations, astronomers now believe that the observable Universe measures about 46 billion light years across. The key word there is observable, because when you take into account that which we cannot see, scientists think it’s actually more like 92 billion light years across.

The hardest part in all of this is making accurate measurements of the distances involved. But since the birth of modern astronomy, increasingly accurate methods have evolved. Aside from redshift and examining the light coming from distant stars and galaxies, astronomers also rely on a class of stars known as Cepheid Variables (CVs) to determine the distance of objects within and beyond our Galaxy.

Definition:

Variable stars are essentially stars that experience fluctuations in their brightness (aka. absolute luminosity). Cepheids Variables are special type of variable star in that they are hot and massive – five to twenty times as much mass as our Sun – and are known for their tendency to pulsate radially and vary in both diameter and temperature.

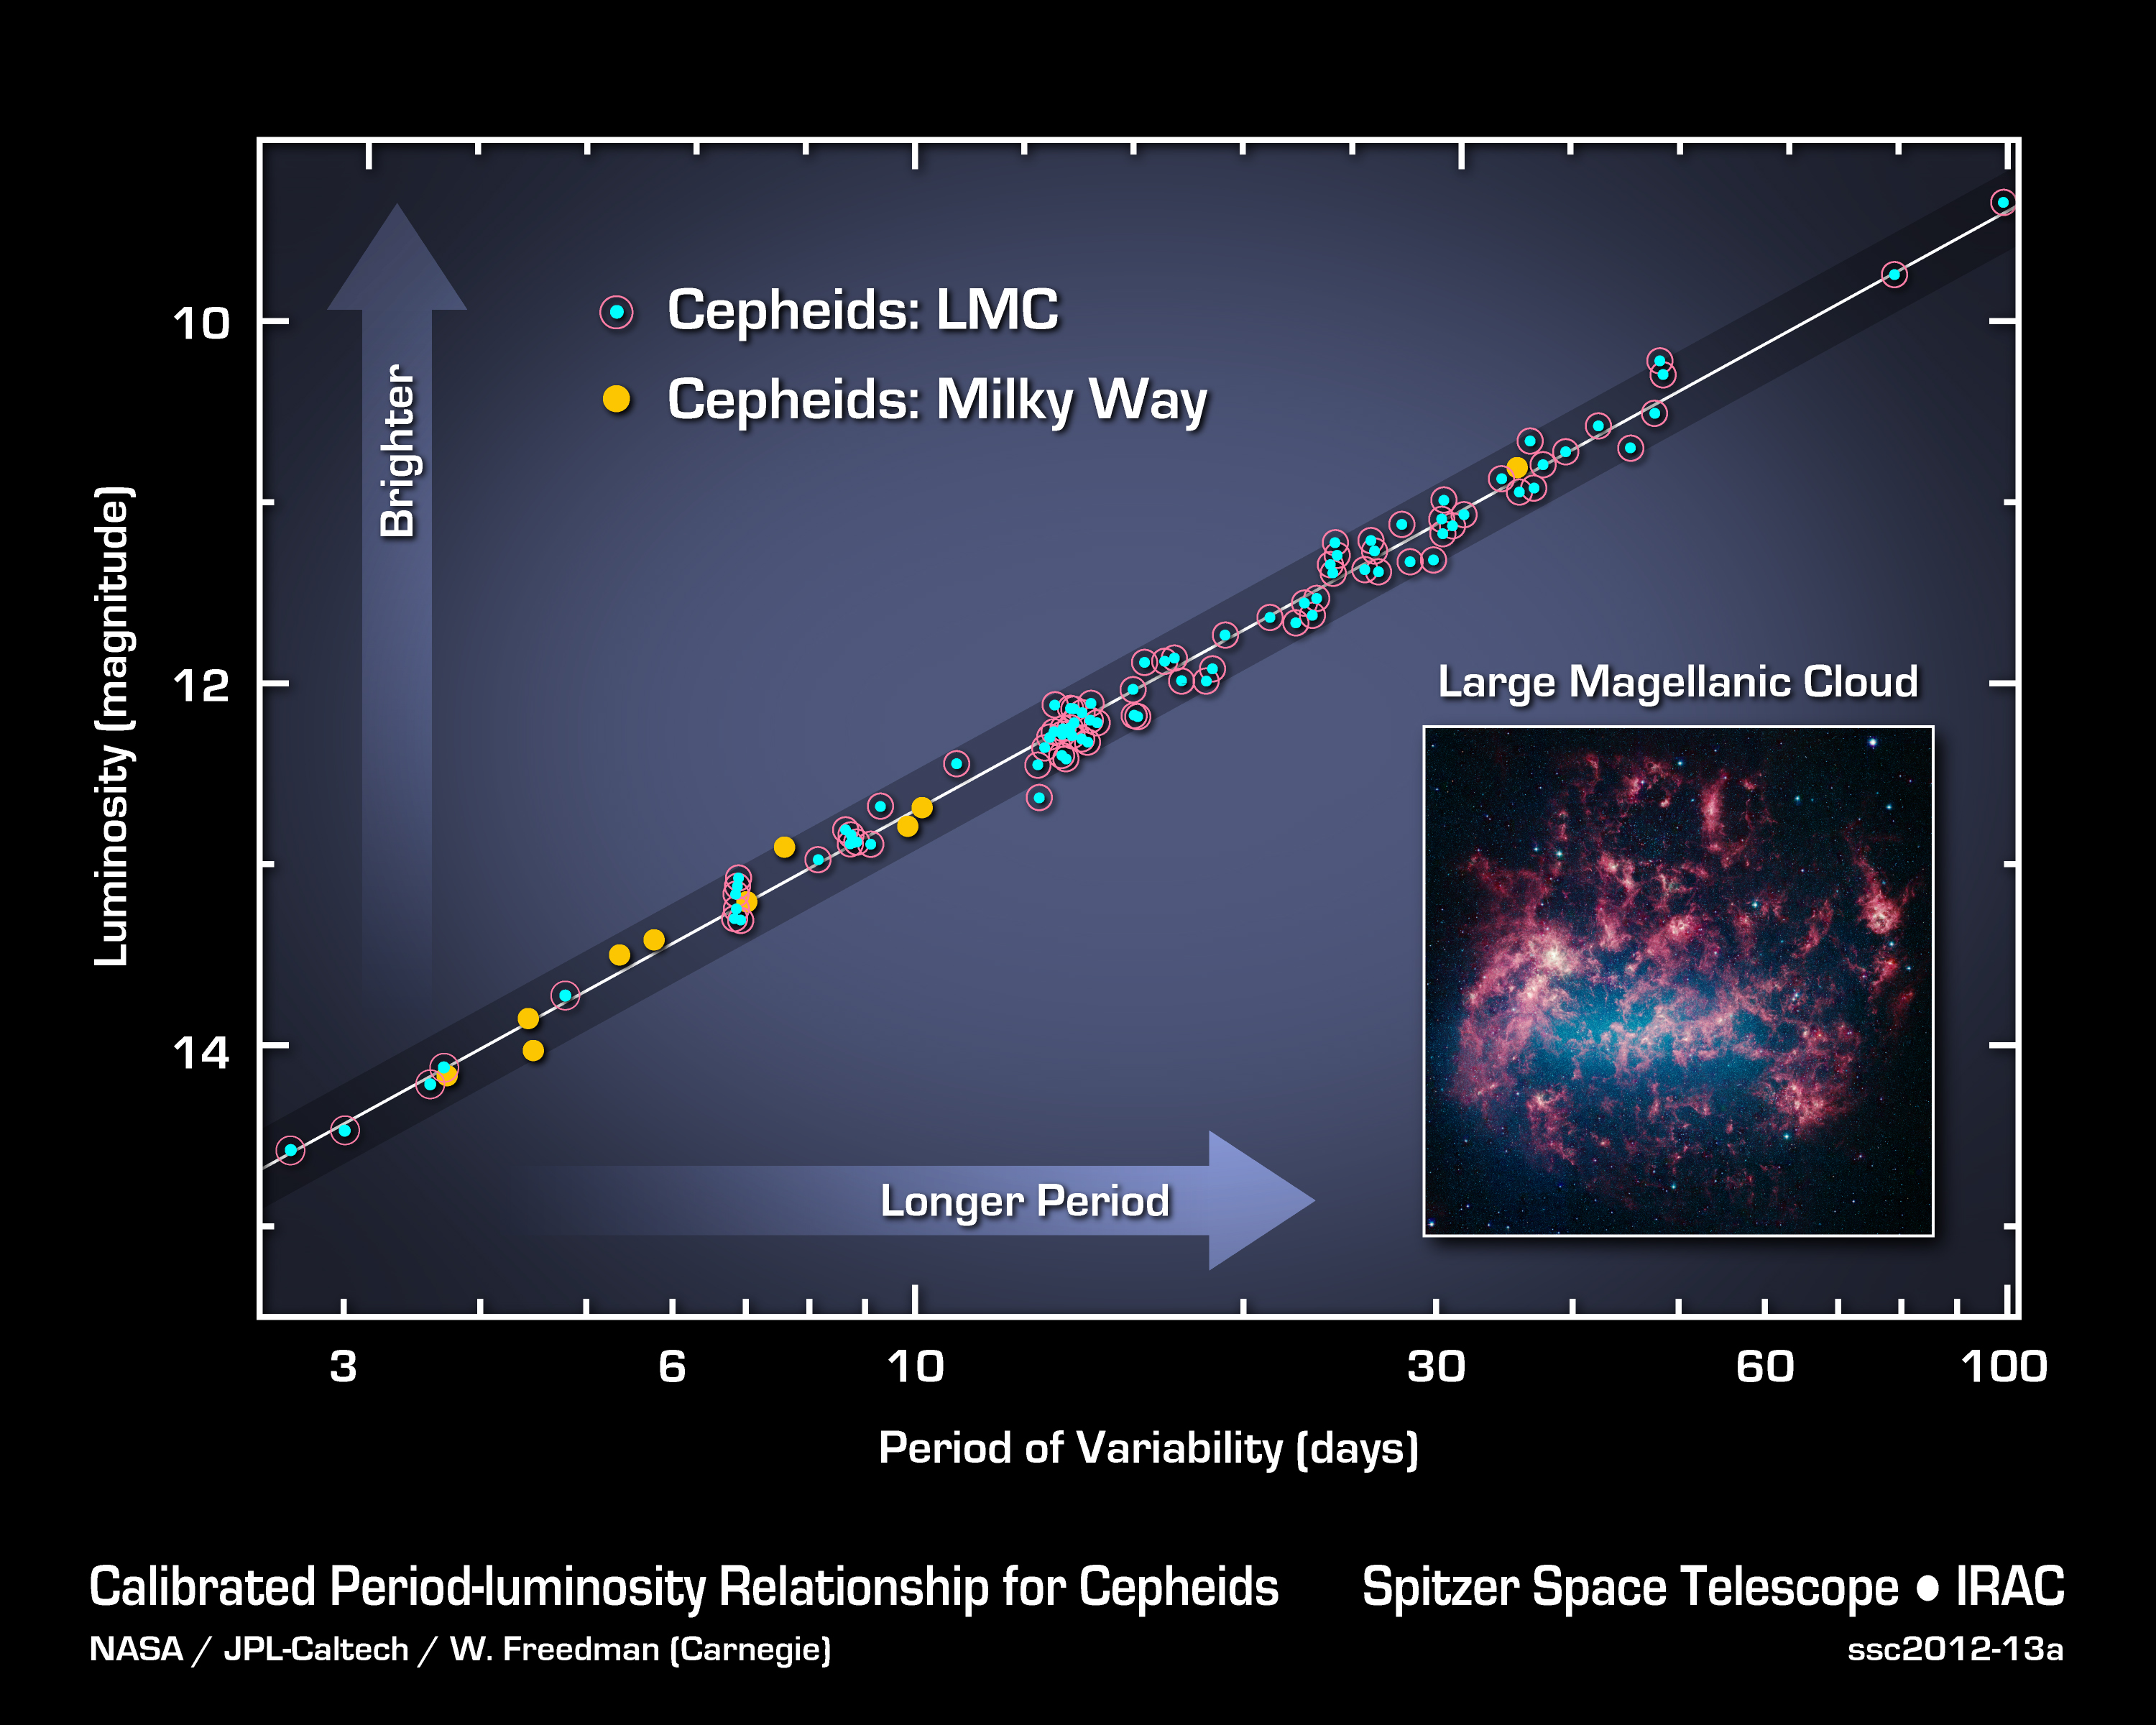
What’s more, these pulsations are directly related to their absolute luminosity, which occurs within well-defined and predictable time periods (ranging from 1 to 100 days). When plotted as a magnitude vs. period relationship, the shape of the Cephiad luminosity curve resembles that of a “shark fin” – do its sudden rise and peak, followed by a steadier decline.

The name is derived from Delta Cephei, a variable star in the Cepheus constellation that was the first CV to be identified. Analysis of this star’s spectrum suggests that CVs also undergo changes in terms of temperature (between 5500 – 66oo K) and diameter (~15%) during a pulsation period.

Use in Astronomy:

The relationship between the period of variability and the luminosity of CV stars makes them very useful in determining the distance of objects in our Universe. Once the period is measured, the luminosity can be determined, thus yielding accurate estimates of the star’s distance using distance modulus equation.

This equation states that: mM = 5 log d – 5 – where m is the apparent magnitude of the object, M is the absolute magnitude of the object, and d is the distance to the object in parsecs. Cepheid variables can be seen and measured to a distance of about 20 million light years, compared to a maximum distance of about 65 light years for Earth-based parallax measurements and just over 326 light years for the ESA’s Hipparcos mission.

Calibrated Period-luminosity Relationship for Cepheids
Calibrated Period-luminosity Relationship for Cepheids. Credit: NASA

Because they are bright, and can be clearly seen million of light years away, they can be easily distinguished from other bright stars in their vicinity. Combined with the relationship between their variability and luminosity, this makes them highly useful tools in deducing the size and scale of our Universe.

Classes:

Cepheid variables are divided into two subclasses – Classical Cepheids and Type II Cepheids – based on differences in their masses, ages, and evolutionary histories. Classical Cepheids are Population I (metal-rich) variable stars that are 4-20 times more massive than the Sun and up to 100,000 times more luminous. They undergo pulsations with very regular periods on the order of days to months.

These Cepheids are typically yellow bright giants and supergiants (spectral class F6 – K2) and they experience radius changes in the millions of kilometers during a pulsation cycle. Classical Cepheids are used to determine distances to galaxies within the Local Group and beyond, and are a means by which the Hubble Constant can be established (see below).

Type II Cepheids are Population II (metal-poor) variable stars which pulsate with periods of typically between 1 and 50 days. Type II Cepheids are also older stars (~10 billion years) that have around half the mass of our Sun.

Type II Cepheids are also subdivided based on their period into the BL Her, W Virginis, and RV Tauri subclasses (named after specific examples) – which have periods of 1-4 days, 10-20 days, and more than 20 days, respectively. Type II Cepheids are used to establish the distance to the Galactic Center, globular clusters, and neighboring galaxies.

There are also those that do not fit into either category, which are known as Anomalous Cepheids. These variables have periods of less than 2 days (similar to RR Lyrae) but have higher luminosities. They also have higher masses than Type II Cepheids, and have unknown ages.

A small proportion of Cepheid variables have also been observed which pulsate in two modes at the same time, hence the name Double-mode Cepheids. A very small number pulsate in three modes, or an unusual combination of modes.

History of Observation:

The first Cepheid variable to be discovered was Eta Aquilae, which was observed on September 10th, 1784, by English astronomer Edward Pigott. Delta Cephei, for which this class of star is named, was discovered a few months later by amateur English astronomer John Goodricke.

Hubble image of variable star RS Puppis (NASA, ESA, and the Hubble Heritage Team)
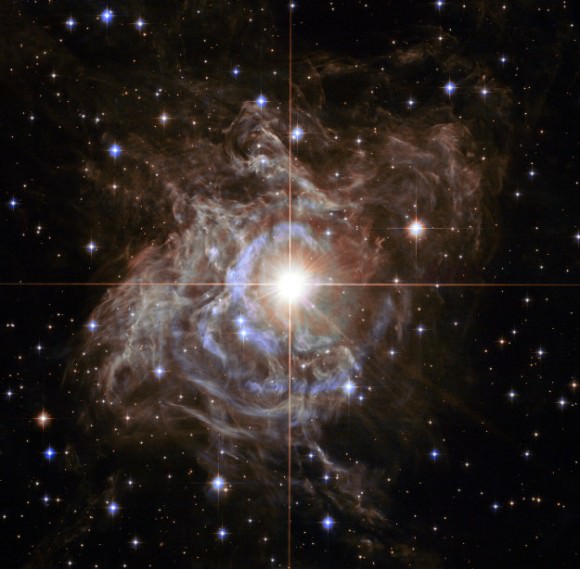
Hubble image of variable star RS Puppis, one of the brightest known Cepheid variable stars in the Milky Way galaxy. Credit: NASA/ ESA/Hubble Heritage Team

In 1908, during an investigation of variable stars in the Magellanic Clouds, American astronomer Henrietta Swan Leavitt discovered the relationship between the period and luminosity of Classical Cepheids. After recording the periods of 25 different variables stars, she published her findings in 1912.

In the following years, several more astronomers would conduct research on Cepheids. By 1925, Edwin Hubble was able to establish the distance between the Milky Way and the Andromeda Galaxy based on Cepheid variables within the latter. These findings were pivotal, in that they settled the Great Debate, where astronomers sought to established whether or not the Milky Way was unique, or one of many galaxies in the Universe.

By gauging the distance between the Milky Way and several other galaxies, and combining it with Vesto Slipher’s measurements of their redshift, Hubble and Milton L. Humason were able to formulate Hubble’s Law. In short, they were able to prove that the Universe is in a state of expansion, something that had been suggested years prior.

Further developments during the 20th century included dividing Cepheids into different classes, which helped resolve issues in determining astronomical distances. This was done largely by Walter Baade, who in the 1940s recognized the difference between Classical and Type II Cepheids based on their size, age and luminosities.

Limitations:

Despite their value in determining astronomical distances, there are some limitations with this method. Chief among them is the fact that with Type II Cepheids, the relationship between period and luminosity can be effected by their lower metallicity, photometric contamination, and the changing and unknown effect that gas and dust have on the light they emit (stellar extinction).

These unresolved issues have resulted in different values being cited for Hubble’s Constant – which range between 60 km/s per 1 million parsecs (Mpc) and 80 km/s/Mpc. Resolving this discrepancy is one of the largest problems in modern cosmology, since the true size and rate of expansion of the Universe are linked.

However, improvements in instrumentation and methodology are increasing the accuracy with which Cepheid Variables are observed. In time, it is hoped that observations of these curious and unique stars will yield truly accurate values, thus removing a key source of doubt about our understanding of the Universe.

We have written many interesting articles about Cepheid Variables here at Universe Today. Here’s Astronomers Find New Way to Measure Cosmic Distances, Astronomers Use Light Echo to Measure the Distance to a Star, and Astronomers Closing in on Dark Energy with Refined Hubble Constant.

Astronomy Cast has an interesting episode that explains the differences between Population I and II stars – Episode 75: Stellar Populations.

Sources:

The Hubble Constant Just Got Constantier

A team of astronomers using the Hubble Space Telescope have found that the current rate of expansion of the Universe could be almost 10 percent faster than previously thought. Image: NASA, ESA, A. Feild (STScI), and A. Riess (STScI/JHU)

Just when we think we understand the Universe pretty well, along come some astronomers to upend everything. In this case, something essential to everything we know and see has been turned on its head: the expansion rate of the Universe itself, aka the Hubble Constant.

A team of astronomers using the Hubble telescope has determined that the rate of expansion is between five and nine percent faster than previously measured. The Hubble Constant is not some curiousity that can be shelved until the next advances in measurement. It is part and parcel of the very nature of everything in existence.

“This surprising finding may be an important clue to understanding those mysterious parts of the universe that make up 95 percent of everything and don’t emit light, such as dark energy, dark matter, and dark radiation,” said study leader and Nobel Laureate Adam Riess of the Space Telescope Science Institute and The Johns Hopkins University, both in Baltimore, Maryland.

But before we get into the consequences of this study, let’s back up a bit and look at how the Hubble Constant is measured.

Measuring the expansion rate of the Universe is a tricky business. Using the image at the top, it works like this:

  1. Within the Milky Way, the Hubble telescope is used to measure the distance to Cepheid variables, a type of pulsating star. Parallax is used to do this, and parallax is a basic tool of geometry, which is also used in surveying. Astronomers know what the true brightness of Cepheids are, so comparing that to their apparent brightness from Earth gives an accurate measurement of the distance between the star and us. Their rate of pulsation also fine tunes the distance calculation. Cepheid variables are sometimes called “cosmic yardsticks” for this reason.
  2. Then astronomers turn their sights on other nearby galaxies which contain not only Cepheid variables, but also Type 1a supernova, another well-understood type of star. These supernovae, which are of course exploding stars, are another reliable yardstick for astronomers. The distance to these galaxies is obtained by using the Cepheids to measure the true brightness of the supernovae.
  3. Next, astronomers point the Hubble at galaxies that are even further away. These ones are so distant, that any Cepheids in those galaxies cannot be seen. But Type 1a supernovae are so bright that they can be seen, even at these enormous distances. Then, astronomers compare the true and apparent brightnesses of the supernovae to measure out to the distance where the expansion of the Universe can be seen. The light from the distant supernovae is “red-shifted”, or stretched, by the expansion of space. When the measured distance is compared with the red-shift of the light, it yields a measurement of the rate of the expansion of the Universe.
  4. Take a deep breath and read all that again.

The great part of all of this is that we have an even more accurate measurement of the rate of expansion of the Universe. The uncertainty in the measurement is down to 2.4%. The challenging part is that this rate of expansion of the modern Universe doesn’t jive with the measurement from the early Universe.

The rate of expansion of the early Universe is obtained from the left over radiation from the Big Bang. When that cosmic afterglow is measured by NASA’s Wilkinson Microwave Anisotropy Probe (WMAP) and the ESA’s Planck satellite, it yields a smaller rate of expansion. So the two don’t line up. It’s like building a bridge, where construction starts at both ends and should line up by the time you get to the middle. (Caveat: I have no idea if bridges are built like that.)

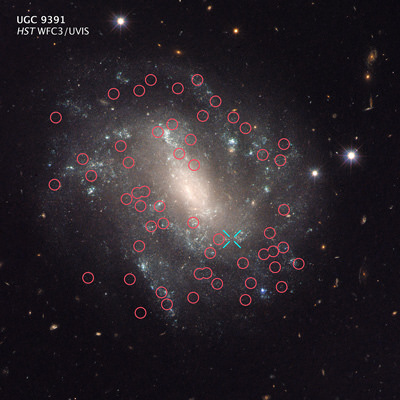
This Hubble Telescope image shows one of the galaxies used in the study. It contains two types of stars used to measure distances between galaxies. The red circles are pulsing Cepheid variable stars, and the blue X is a Type 1a supernova. Image: NASA, ESA, and A. Riess (STScI/JHU)

“You start at two ends, and you expect to meet in the middle if all of your drawings are right and your measurements are right,” Riess said. “But now the ends are not quite meeting in the middle and we want to know why.”

“If we know the initial amounts of stuff in the universe, such as dark energy and dark matter, and we have the physics correct, then you can go from a measurement at the time shortly after the big bang and use that understanding to predict how fast the universe should be expanding today,” said Riess. “However, if this discrepancy holds up, it appears we may not have the right understanding, and it changes how big the Hubble constant should be today.”

Why it doesn’t all add up is the fun, and maybe maddening, part of this.

What we call Dark Energy is the force that drives the expansion of the Universe. Is Dark Energy growing stronger? Or how about Dark Matter, which comprises most of the mass in the Universe. We know we don’t know much about it. Maybe we know even less than that, and its nature is changing over time.

“We know so little about the dark parts of the universe, it’s important to measure how they push and pull on space over cosmic history,” said Lucas Macri of Texas A&M University in College Station, a key collaborator on the study.

The team is still working with the Hubble to reduce the uncertainty in measurements of the rate of expansion. Instruments like the James Webb Space Telescope and the European Extremely Large Telescope might help to refine the measurement even more, and help address this compelling issue.

How Are Galaxies Moving Away Faster Than Light?

How Are Galaxies Moving Away Faster Than Light?

So, how can galaxies be traveling faster than the speed of light when nothing can travel faster than light?

I’m a little world of contradictions. “Not even light itself can escape a black hole”, and then, “black holes and they are the brightest objects in the Universe”. I’ve also said “nothing can travel faster than the speed of light”. And then I’ll say something like, “ galaxies are moving away from us faster than the speed of light.” There’s more than a few items on this list, and it’s confusing at best. Thanks Universe!

So, how can galaxies be traveling faster than the speed of light when nothing can travel faster than light? Warp speed galaxies come up when I talk about the expansion of the Universe. Perhaps it’s dark energy acceleration, or the earliest inflationary period of the Universe when EVERYTHING expanded faster than the speed of light.

Imagine our expanding Universe. It’s not an explosion from a specific place, with galaxies hurtling out like cosmic jetsam. It’s an expansion of space. There’s no center, and the Universe isn’t expanding into anything.

I’d suggested that this is a terribly oversimplified model for our Universe expanding. Unfortunately, it’s also terribly convenient. I can steal it from my children whenever I want.

Imagine you’re this node here, and as the toy expands, you see all these other nodes moving away from you. And if you were to move to any other node, you’d see all the other nodes moving away from you.

Here’s the interesting part, these nodes over here, twice as far away as the closer ones, appear to move more quickly away from you. The further out the node is, the faster it appears to be moving away from you.

This is our freaky friend, the Hubble Constant, the idea that for every megaparsec of distance between us and a distant galaxy, the speed separating them increases by about 71 kilometers per second.

Galaxies separated by 2 parsecs will increase their speed by 142 kilometers every second. If you run the mathatron, once you get out to 4,200 megaparsecs away, two galaxies will see each other traveling away faster than the speed of light. How big Is that, is it larger than the Universe?

The first light ever, the cosmic microwave background radiation, is 46 billion light-years away from us in all directions. I did the math and 4,200 megaparsecs is a little over 13.7 billion light-years.There’s mountains of room for objects to be more than 4,200 megaparsecs away from each other. Thanks Universe?!?

Most of the Universe we can see is already racing away at faster than the speed of light. So how it’s possible to see the light from any galaxies moving faster than the speed of light. How can we even see the Cosmic Microwave Background Radiation? Thanks Universe.

WMAP data of the Cosmic Microwave Background. Credit: NASA

Light emitted by the galaxies is moving towards us, while the galaxy itself is traveling away from us, so the photons emitted by all the stars can still reach us. These wavelengths of light get all stretched out, and duckslide further into the red end of the spectrum, off to infrared, microwave, and even radio waves. Given time, the photons will be stretched so far that we won’t be able to detect the galaxy at all.

In the distant future, all galaxies and radiation we see today will have faded away to be completely undetectable. Future astronomers will have no idea that there was ever a Big Bang, or that there are other galaxies outside the Milky Way. Thanks Universe.

I stand with Einstein when I say that nothing can move faster than light through space, but objects embedded in space can appear to expand faster than the speed of light depending on your perspective.

What aspects about cosmology still give you headaches? Give us some ideas for topics in the comments below.

Like a BOSS: How Astronomers are Getting Precise Measurements of the Universe’s Expansion Rate

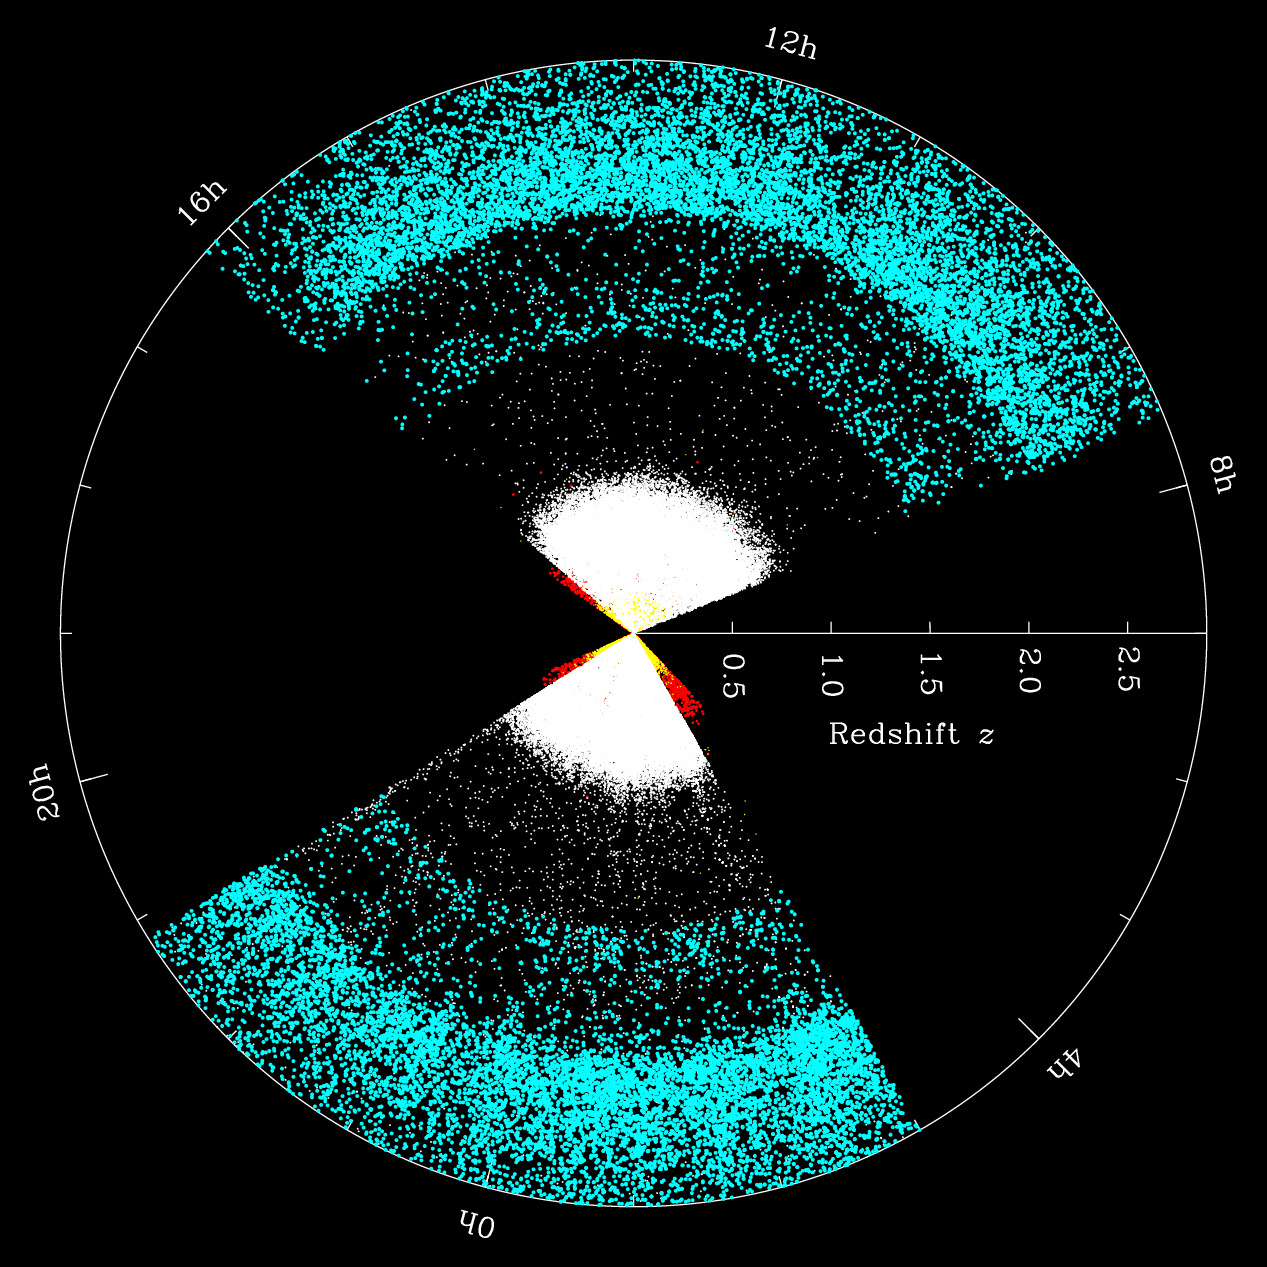
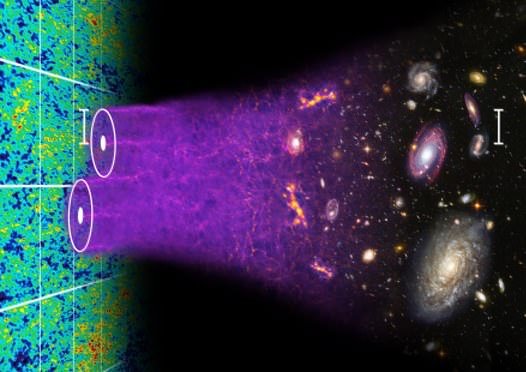
Distribution of galaxies and quasars in a slice of BOSS out to a redshift of 3, or 11 billion years in the past. Credit: SDSS-III

Astrophysicists studying the expansion of the Universe with the largest galaxy catalogs ever assembled are ushering in an exciting era of precision cosmology. Last week, the Sloan Digital Sky Survey (SDSS) issued its final public data release, and scientists working in its largest program, the Baryon Oscillation Spectroscopic Survey (BOSS) also presented their final results at the American Astronomical Society meeting in Seattle, Washington.

By mapping over 10,000 square degrees — 25% of the sky — BOSS is “measuring our universe’s accelerated expansion with the world’s largest extragalactic redshift survey,” according to SDSS-III Director Daniel Eisenstein of the Harvard-Smithsonian Center for Astrophysics. The BOSS results include new and precise measurements of the universe’s expansion rate (called the “Hubble constant”) and matter density, which includes dark matter, stars, gas, and dust.

BOSS conducted its observations at 2.5-meter Sloan Foundation Telescope at Apache Point Observatory in New Mexico, producing spectra and spatial positions for 1.5 million galaxies and 300,000 quasars in a volume equivalent to a cube with length 8.5 billion light-years on a side (see image above). Astronomers used this rich dataset to map the objects’ distributions and to detect the characteristic scale imprinted by baryon acoustic oscillations in the early universe. Sound waves propagate outward with time, like ripples spreading in a pond, and are indicated by a large-scale clustering signal in the positions of galaxies relative to each other (see illustration below). By analyzing this signal at different times, it is possible to study the behavior of the mysterious “dark energy” causing the accelerating expansion of the universe.

An illustration of the concept of baryon acoustic oscillations, imprinted in the early universe and seen today in galaxy surveys. (courtesy:  Chris Blake and Sam Moorfield)
An illustration of the concept of baryon acoustic oscillations, imprinted in the early universe and seen today in galaxy surveys. (courtesy: Chris Blake and Sam Moorfield)

In BOSS’s final results, hundreds of scientists in the international collaboration measured this scale with unprecedented precision. In particular, Ashley Ross from Ohio State University presented results that demonstrated the power of combining an analysis of the transverse and line-of-sight distributions of galaxies. In a paper by Eric Aubourg and collaborators, BOSS astronomers measured the cosmic distance scale of galaxies in the “local” universe and of quasars in the distance universe with impressively small systematic errors—at less than the 1% level—when combined with cosmic microwave background constraints. Their cosmological analysis yields a measurement of the Hubble constant and of the matter density of the universe consistent with a “flat” cold dark matter cosmology with a cosmological constant (see below). Cosmological models including curvature, evolving dark energy, or massive neutrinos are not completely ruled out but are less supported by the data than before. Other results from the collaboration will be submitted for publication in the coming months.

Cosmological constraints on the Hubble parameter h, matter density Ωm, and curvature parameter Ωk from BOSS's baryon acoustic oscillations (BAO) combined with supernovae (SN) and Planck results. (Courtesy: Aubourg et al. 2014)
Cosmological constraints on the Hubble parameter h, matter density Ωm, and curvature parameter Ωk from BOSS’s baryon acoustic oscillations (BAO) combined with supernovae (SN) and Planck results. (Courtesy: Aubourg et al. 2014)

The BOSS dataset “represents the gold standard in mapping out the network of galaxies that comprises the large-scale structure of the Universe…The data enables us to trace, with greater precision than ever before, the presence of dark energy, the behaviour of gravity on cosmic scales, and the effect of massive neutrinos,” says Chris Blake of Swinburne University, not affiliated with the collaboration.

Where will the BOSS team go from here? The collaboration has begun work on SDSS-IV, whose six-year mission includes an ambitious extended BOSS (eBOSS) survey. According to eBOSS Targeting Coordinator Jeremy Tinker of New York University, eBOSS observations of over 700,000 quasars will precisely measure the distance scale “at a much higher redshift regime that is not covered by current large-scale surveys.”

You can read more about BOSS and updates about the three other componenets of the SDSS in our previous article here.
SDSS website

(Full disclosure: Ramin Skibba had been a member of the BOSS collaboration during 2010-2012.)

Spitzer Provides Most Precise Measurement Yet of the Universe’s Expansion

Calibrated Period-luminosity Relationship for Cepheid variables.
Calibrated Period-luminosity Relationship for Cepheid variables. Courtesy Spitzer Space Telescope/IPAC.

This graph illustrates the Cepheid period-luminosity relationship, which scientists use to calculate the size, age and expansion rate of the Universe. Credit: NASA/JPL-Caltech/Carnegie

How fast is our Universe expanding? Over the decades, there have been different estimates used and heated debates over those approximations, but now data from the Spitzer Space Telescope have provided the most precise measurement yet of the Hubble constant, or the rate at which our universe is stretching apart. The result? The Universe is getting bigger a little bit faster than previously thought.

The newly refined value for the Hubble constant is 74.3 plus or minus 2.1 kilometers per second per megaparsec.

The most previous estimation came from a study from the Hubble Space Telescope, at 74.2 plus or minus 3.6 kilometers per second per megaparsec. A megaparsec is roughly 3 million light-years.

To make the new measurements, Spitzer scientists looked at pulsating stars called cephied variable stars, taking advantage of being able to observe them in long-wavelength infrared light. In addition, the findings were combined with previously published data from NASA’s Wilkinson Microwave Anisotropy Probe (WMAP) on dark energy. The new determination brings the uncertainty down to 3 percent, a giant leap in accuracy for cosmological measurements, scientists say.

WMAP obtained an independent measurement of dark energy, which is thought to be winning a battle against gravity, pulling the fabric of the universe apart. Research based on this acceleration garnered researchers the 2011 Nobel Prize in physics.

The Hubble constant is named after the astronomer Edwin P. Hubble, who astonished the world in the 1920s by confirming our universe has been expanding since it exploded into being 13.7 billion years ago. In the late 1990s, astronomers discovered the expansion is accelerating, or speeding up over time. Determining the expansion rate is critical for understanding the age and size of the universe.

“This is a huge puzzle,” said the lead author of the new study, Wendy Freedman of the Observatories of the Carnegie Institution for Science in Pasadena. “It’s exciting that we were able to use Spitzer to tackle fundamental problems in cosmology: the precise rate at which the universe is expanding at the current time, as well as measuring the amount of dark energy in the universe from another angle.” Freedman led the groundbreaking Hubble Space Telescope study that earlier had measured the Hubble constant.

Glenn Wahlgren, Spitzer program scientist at NASA Headquarters in Washington, said the better views of cepheids enabled Spitzer to improve on past measurements of the Hubble constant.

“These pulsating stars are vital rungs in what astronomers call the cosmic distance ladder: a set of objects with known distances that, when combined with the speeds at which the objects are moving away from us, reveal the expansion rate of the universe,” said Wahlgren.

Cepheids are crucial to the calculations because their distances from Earth can be measured readily. In 1908, Henrietta Leavitt discovered these stars pulse at a rate directly related to their intrinsic brightness.

To visualize why this is important, imagine someone walking away from you while carrying a candle. The farther the candle traveled, the more it would dim. Its apparent brightness would reveal the distance. The same principle applies to cepheids, standard candles in our cosmos. By measuring how bright they appear on the sky, and comparing this to their known brightness as if they were close up, astronomers can calculate their distance from Earth.

Spitzer observed 10 cepheids in our own Milky Way galaxy and 80 in a nearby neighboring galaxy called the Large Magellanic Cloud. Without the cosmic dust blocking their view, the Spitzer research team was able to obtain more precise measurements of the stars’ apparent brightness, and thus their distances. These data opened the way for a new and improved estimate of our universe’s expansion rate.

“Just over a decade ago, using the words ‘precision’ and ‘cosmology’ in the same sentence was not possible, and the size and age of the universe was not known to better than a factor of two,” said Freedman. “Now we are talking about accuracies of a few percent. It is quite extraordinary.”

“Spitzer is yet again doing science beyond what it was designed to do,” said project scientist Michael Werner at NASA’s Jet Propulsion Laboratory. Werner has worked on the mission since its early concept phase more than 30 years ago. “First, Spitzer surprised us with its pioneering ability to study exoplanet atmospheres,” said Werner, “and now, in the mission’s later years, it has become a valuable cosmology tool.”

The study appears in the Astrophysical Journal.

Paper on arXiv: A Mid-Infrared Calibration of the Hubble Constant

Source: JPL

Using Gravitational Lensing to Measure Age and Size of Universe

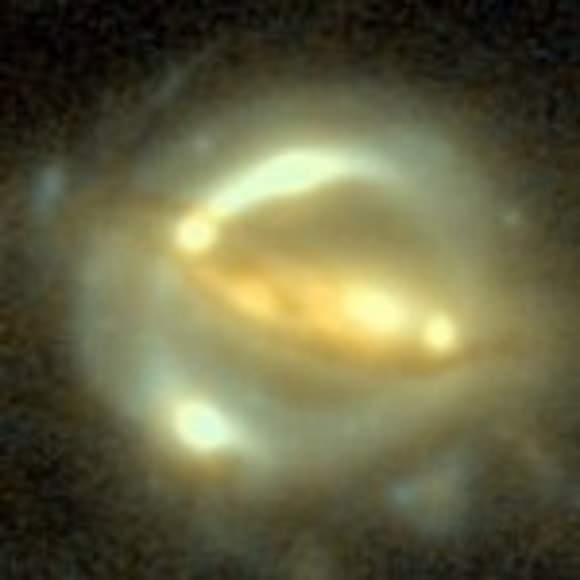
A graviational lens image of the B1608+656 system. Image courtesy Sherry Suyu of the Argelander Institut für Astronomie in Bonn, Germany. Click on image for larger version.

[/caption]

Handy little tool, this gravitational lensing! Astronomers have used it to measure the shape of stars, look for exoplanets, and measure dark matter in distant galaxies. Now its being used to measure the size and age of the Universe. Researchers say this new use of gravitation lensing provides a very precise way to measure how rapidly the universe is expanding. The measurement determines a value for the Hubble constant, which indicates the size of the universe, and confirms the age of Universe as 13.75 billion years old, within 170 million years. The results also confirm the strength of dark energy, responsible for accelerating the expansion of the universe.

Gravitational lensing occurs when two galaxies happen to aligned with one another along our line of sight in the sky. The gravitational field of the nearer galaxy distorts the image of the more distant galaxy into multiple arc-shaped images. Sometimes this effect even creates a complete ring, known as an “Einstein Ring.”
Researchers at the Kavli Institute for Particle Astrophysics and Cosmology (KIPAC) used gravitational lensing to measure the distances light traveled from a bright, active galaxy to the earth along different paths. By understanding the time it took to travel along each path and the effective speeds involved, researchers could infer not just how far away the galaxy lies but also the overall scale of the universe and some details of its expansion.

Distinguishing distances in space is difficult. A bright light far away and a dimmer source lying much closer can look like they are at the same distance. A gravitational lens circumvents this problem by providing multiple clues as to the distance light travels. That extra information allows them to determine the size of the universe, often expressed by astrophysicists in terms of a quantity called Hubble’s constant.

“We’ve known for a long time that lensing is capable of making a physical measurement of Hubble’s constant,” KIPAC’s Phil Marshall said. However, gravitational lensing had never before been used in such a precise way. This measurement provides an equally precise measurement of Hubble’s constant as long-established tools such as observation of supernovae and the cosmic microwave background. “Gravitational lensing has come of age as a competitive tool in the astrophysicist’s toolkit,” Marshall said.

When a large nearby object, such as a galaxy, blocks a distant object, such as another galaxy, the light can detour around the blockage. But instead of taking a single path, light can bend around the object in one of two, or four different routes, thus doubling or quadrupling the amount of information scientists receive. As the brightness of the background galaxy nucleus fluctuates, physicists can measure the ebb and flow of light from the four distinct paths, such as in the B1608+656 system that was the subject of this study. Lead author on the study Sherry Suyu, from the University of Bonn, said, “In our case, there were four copies of the source, which appear as a ring of light around the gravitational lens.”

Though researchers do not know when light left its source, they can still compare arrival times. Marshall likens it to four cars taking four different routes between places on opposite sides of a large city, such as Stanford University to Lick Observatory, through or around San Jose. And like automobiles facing traffic snarls, light can encounter delays, too.

“The traffic density in a big city is like the mass density in a lens galaxy,” Marshall said. “If you take a longer route, it need not lead to a longer delay time. Sometimes the shorter distance is actually slower.”

The gravitational lens equations account for all the variables such as distance and density, and provide a better idea of when light left the background galaxy and how far it traveled.

In the past, this method of distance estimation was plagued by errors, but physicists now believe it is comparable with other measurement methods. With this technique, the researchers have come up with a more accurate lensing-based value for Hubble’s constant, and a better estimation of the uncertainty in that constant. By both reducing and understanding the size of error in calculations, they can achieve better estimations on the structure of the lens and the size of the universe.

There are several factors scientists still need to account for in determining distances with lenses. For example, dust in the lens can skew the results. The Hubble Space Telescope has infra-red filters useful for eliminating dust effects. The images also contain information about the number of galaxies lying around the line of vision; these contribute to the lensing effect at a level that needs to be taken into account.

Marshall says several groups are working on extending this research, both by finding new systems and further examining known lenses. Researchers are already aware of more than twenty other astronomical systems suitable for analysis with gravitational lensing.

These results of this study was published in the March 1 issue of The Astrophysical Journal. The researchers used data collected by the NASA/ESA Hubble Space Telescope, and showed the improved precision they provide in combination with the Wilkinson Microwave Anisotropy Probe (WMAP).

Source: SLAC

Hubble’s Law

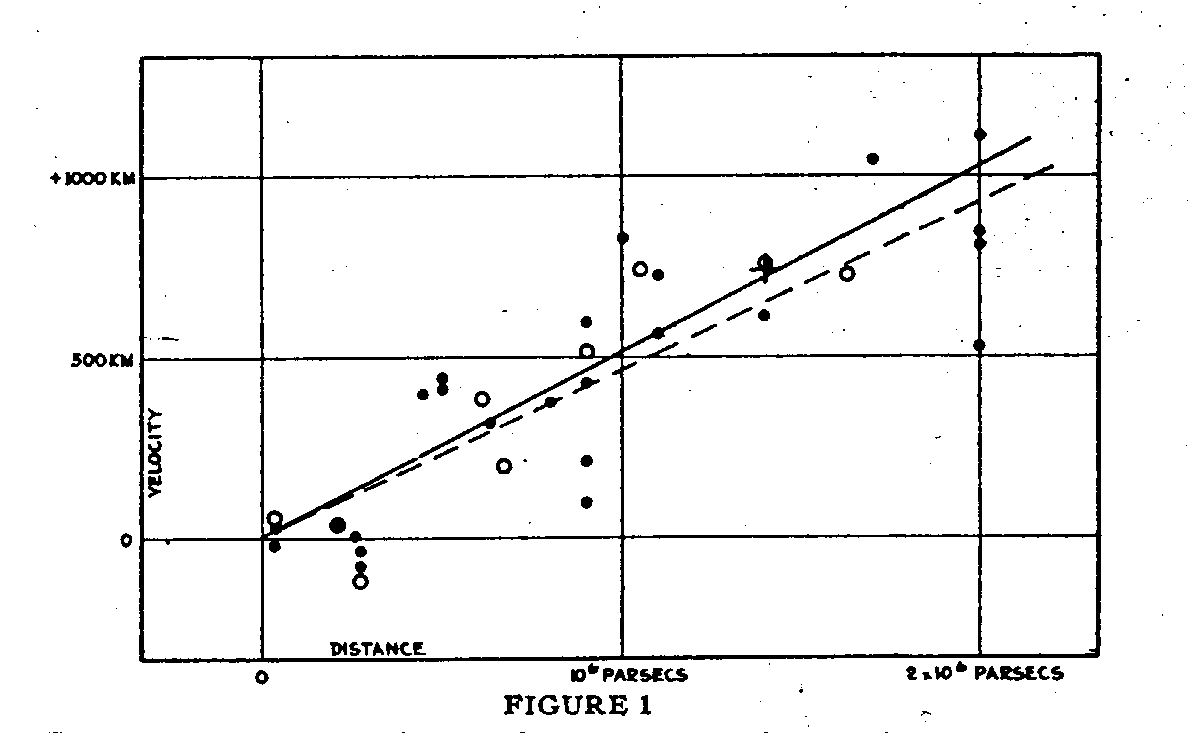
velocity vs distance, from Hubble's 1929 paper

[/caption]
“The distance to objects beyond the Local Group is closely related to how fast they seem to be receding from us,” that’s Hubble’s law in a nutshell.

Edwin Hubble, the astronomer the Hubble Space Telescope is named after, first described the relationship which later bore his name in a paper in 1929; here is one of the ways he described it, in that paper: “The data in the table [of “nebulae”, i.e. galaxies] indicate a linear correlation between distances and velocities“; in numerical form, v = Hd (v is the speed at which a distant object is receding from us, d is its distance, and H is the Hubble constant).

Today the Hubble law is usually expressed as a relationship between redshift and distance, partly because redshift is what astronomers can measure directly.

Hubble’s Law, which is an empirical relationship, was the first concrete evidence that Einstein’s theory of General Relativity applied to the universe as a whole, as proposed only two years earlier by Georges Lemaître (interestingly, Lemaître’s paper also includes an estimate of the Hubble constant!); the universal applicability of General Relativity is the heart of the Big Bang theory, and the way we see the predicted expansion of space is as the speed at which things seem to be receding being proportional to their distance, i.e. Hubble’s Law.

Although other astronomers, such as Vesto Silpher, did much of the work needed to measure the galaxy redshifts, Hubble was the one who developed techniques for estimating the distance to the galaxies, and who pulled it all together to show how distance and speed were related.

Hubble’s Law is not exact; the measured redshift of some galaxies is different from what Hubble’s Law says it should be, given their distances. This is particularly noticeable for galaxy clusters, and is explained as the motion of galaxies within their local groups or clusters, due to their mutual gravitation.

Because the exact value of the Hubble constant, H, is so important in extragalactic astronomy and cosmology – it leads to an estimate of the age of the universe, helps test theories of Dark Matter and Dark Energy, and much more – a great deal of effort has gone into working it out. Today it is estimated to be 71 kilometers per second per megaparsec, plus or minus 7; this is about 21 km/sec per million light-years. What does this mean? An object a million light-years away would be receding from us at 21 km/sec; an object 10 million light-years away, 210 km/sec, etc.

Perhaps the most dramatic revision to the Hubble Law came in 1998, when two teams independently announced that they’d discovered that the rate of expansion of the universe is accelerating; the shorthand name for this observation is Dark Energy.

Harvard University’s Professor of Cosmology John Huchra maintains a webpage on the history of the Hubble constant, and this page from Ned Wright’s Cosmology Tutorial explains how the Hubble law and cosmology are related.

There are several Universe Today stories about the Hubble relationship and the Hubble constant; for example Astronomers Closing in on Dark Energy with Refined Hubble Constant, and Cosmologists Improve on Standard Candles Measurement.

And we have done some Astronomy Casts on it too, How Old is the Universe? and, How Big is the Universe?

Sources:
UT-Knoxville
NASA
Cornell Astronomy