Hubble Finds a Dead Galaxy that was Finished Making Stars Just a Few Billion Years After the Big Bang

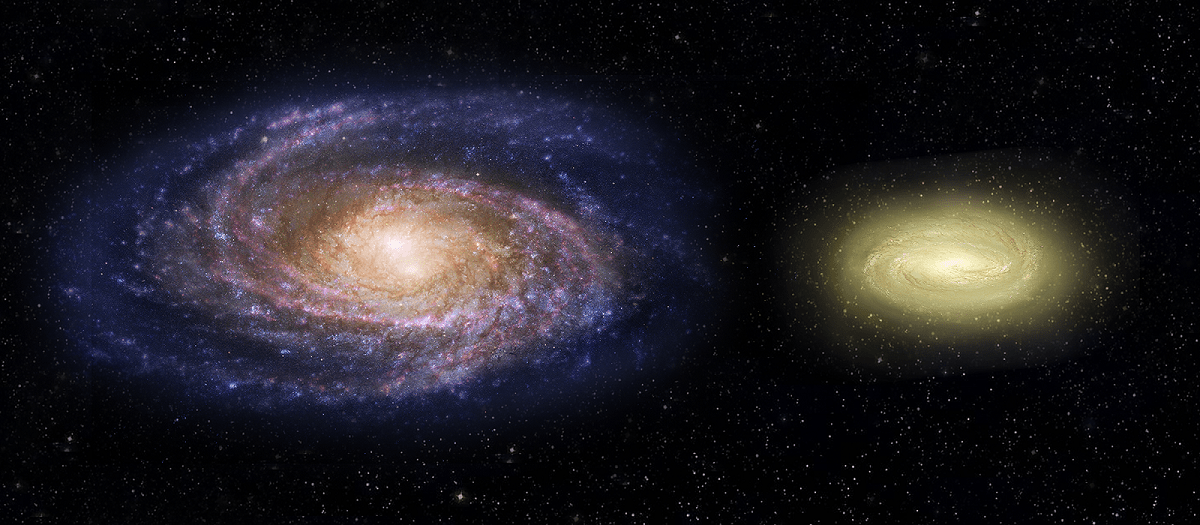
Artist's Concept of Milky Way vs Galaxy MACS2129-1. Credit: hubblesite.org

Thanks to recent improvements in space-based and ground-based telescopes, astronomers have been able to probe deeper into the Universe than ever before. By looking billions of years back in time, we are able to test our theories about the history of galactic formation and evolution. Unfortunately, studying the very early Universe is a daunting task, and one that is beyond the capabilities of our current instruments.

But by combining the power of the Hubble Space Telescope with a technique known as gravitational lensing, a team of astronomers made the first discovery of a compact galaxy that stopped making stars just a few billion years after the Big Bang. The discovery of such a galaxy existing so early in the Universe is unprecedented and represents a major challenge to \theories of how massive galaxies form and evolve.

Their findings were reported in a study titled “A Massive, Dead Disk Galaxy in the Early Universe“, which appeared in the June 22 issue of the journal Nature. As is indicated in the study, the team relied on data from Hubble which they combined with gravitational lensing – where a massive cluster of galaxies magnifies and stretches images of more distant galaxies beyond them – to study the distant galaxy known as MACS 2129-1.
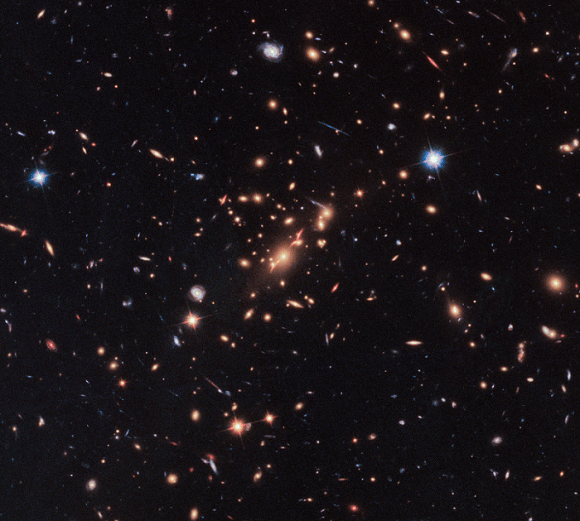
Image of the Galaxy Cluster MACS J2129-0741, as part of CLASH. Credit: hubblesite.org

What they found was completely unexpected. Given the age of the galaxy – dated to just three billion years after the Big Bang – they expected to see a chaotic ball of stars that were forming due to early galaxies merging. Instead, they noticed that the galaxy, which was disk-shaped (like the Milky Way), was effectively dead – meaning that star formation had already ceased within it.

This was a surprise, seeing as how astronomers did not expect to see this so early in the Universe. What’s more, it was the first time that direct evidence has been obtained that shows how at least some of the earliest “dead” galaxies in the Universe evolved from disk-shaped objects to become the giant elliptical galaxies that we regularly see in the Universe today.

As Sune Toft – a researcher from the Dark Cosmology Center at the Niels Bohr Institute and the lead author on the study – explained, this may force a rethink of how galaxies evolved in the early Universe:

“This new insight may force us to rethink the whole cosmological context of how galaxies burn out early on and evolve into local elliptical-shaped galaxies, Perhaps we have been blind to the fact that early “dead” galaxies could in fact be disks, simply because we haven’t been able to resolve them.”

In previous studies, it was assumed that distant dead galaxies were similar in structure to the local elliptical galaxies they eventually evolved into. Prior to this study, confirmation of this hypothesis was not possible since current instruments are not powerful enough to see that far into space. But by combining the power of gravitational lensing with Hubble’s high resolution, Toft and his team were able to see this dead galaxy clearly.
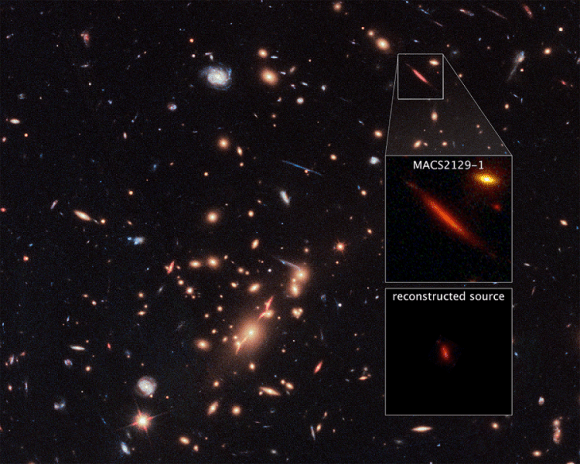
Galaxy Cluster MACS J2129-0741 and Lensed Galaxy MACS2129- Credit: hubblesite.org

Combining rotational velocity measurements from the ESO’s Very Large Telescope (VLT) with archival data from the Cluster Lensing And Supernova survey with Hubble (CLASH), they were able to determine the size of the galaxy, mass, and age as well as its (defunct) rate of star formation. Ultimately, they found that the remote galaxy is three times as massive as the Milky Way, though only half its size, and is spinning more than twice as fast.

Why this galaxy stopped forming stars is still unknown, and will require follow-up surveys using more sophisticated instruments. But in the meantime, there are some possible theories. For instance, it could be the result of an active galactic nucleus, where a supermassive black hole at the center of MACS 2129-1 inhibited star formation by heating the galaxy’s gas and expelling it from the galaxy.

Or it may be the result of cold gas being streamed into the galaxy’s center where it was rapidly heated and compressed, thereby preventing it from cooling and forming star-forming clouds. But when it comes to how these types of early, dead galaxies could have led to the elliptical galaxies we see today, Toft and his colleagues think they know the answer. As he explained, it could be through mergers:

“If these galaxies grow through merging with minor companions, and these minor companions come in large numbers and from all sorts of different angles onto the galaxy, this would eventually randomize the orbits of stars in the galaxies. You could also imagine major mergers. This would definitely also destroy the ordered motion of the stars.”

In the coming years, Toft and his team hope to take advantage of the James Webb Telescope (which will be launching in 2018) to search for more early dead galaxies, in the hopes that it can shed light on the unresolved questions this discover raises. And with the ability to probe deeper into space, astronomers anticipate that a great deal more will be revealed about the early Universe.

Further Reading: Hubblesite, Nature

Astronomers Measure the Mass of a White Dwarf, and Prove Einstein was Right… Again

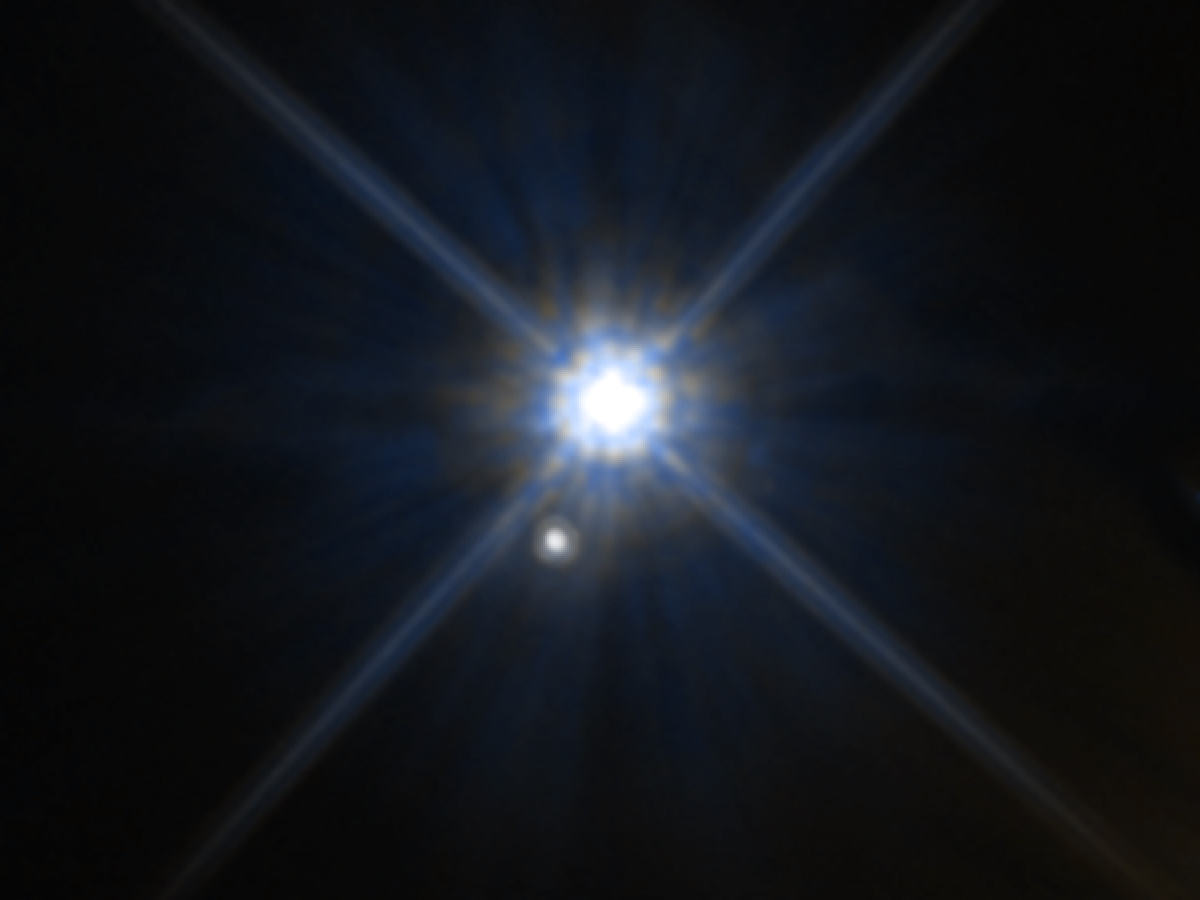
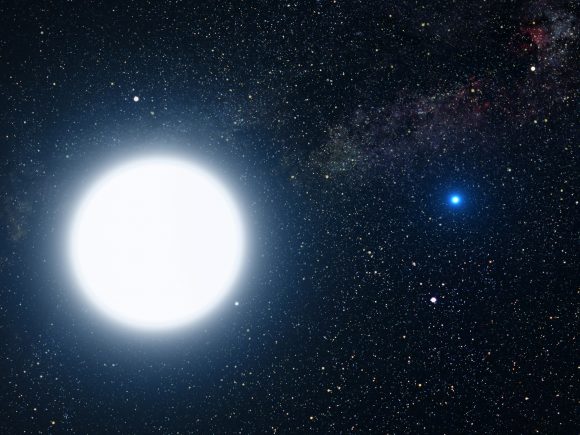
Hubble image showing the white dwarf star Stein 2051B and the smaller star below it appear to be close neighbors. Credit: NASA/ESA/K. Sahu (STScI)

It’s been over a century since Einstein firs proposed his Theory of General Relativity, his groundbreaking proposal for how gravity worked on large scales throughout the cosmos. And yet, after all that time, experiments are still being conducted that show that Einstein’s field equations were right on the money. And in some cases, old experiments are finding new uses, helping astronomers to unlock other astronomical mysteries.

Case in point: using the Hubble Space Telescope, NASA astronomers have repeated a century-old test of General Relativity to determine the mass of a white dwarf star. In the past, this test was used to determine how it deflects light from a background star. In this case, it was used to provide new insights into theories about the structure and composition of the burned-out remnants of a star.

White dwarfs are what become of a star after it has exited the Main Sequence of its lifespan after exhausting their nuclear fuel. This is followed by the star expelling most of its outer material, usually through a massive explosion (aka. a supernova). What is left behind is a small and extreme dense (second only to a neutron star) which exerts an incredible gravitational force.

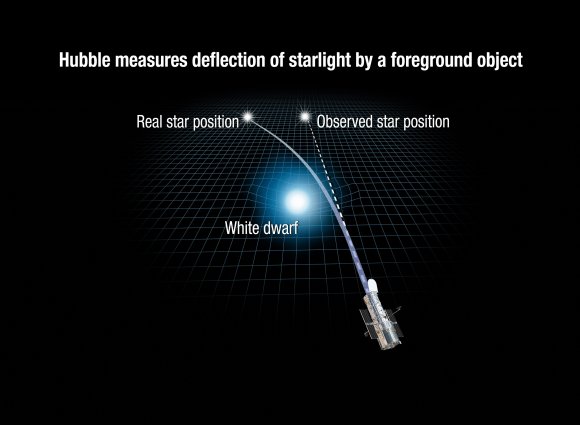
Illustration revealing how the gravity of a white dwarf star warps space and bends the light of a distant star behind it. Credits: NASA, ESA, and A. Feild (STScI)

This attribute is what makes white dwarfs a good means for testing General Relativity. By measuring how much they deflect the light from a background star, astronomers are able to see the effect gravity has on the curvature of spacetime. This is precisely similar to what British astronomer Sir Arthur Eddington did in 1919, when he led an expedition to determine how much the Sun’s gravity deflected the light of a background star during a solar eclipse.

Known as gravitational microlensing, this same experiment was repeated by the NASA team. Using the Hubble Space Telescope, they observed Stein 2051B – a white dwarf located just 17 light-years from Earth – on seven different occasions during a two-year period. During this period, it passed in front of a background star located about 5000 light-years distant, which produced a visible deviation in the path of the star’s light.

The resulting deviation was incredibly small – only 2 milliarseconds from its actual position – and was only discernible thanks to the optical resolution of Hubble’s Wide Field Camera 3 (WFC3). Such a deviation would have been impossible to detect using instruments that predate Hubble. And more importantly, the results were consistent with what Einstein predicted a century ago.

As Kailash Sahu, an astronomer at the Space Telescope Science Institute (STScI) and the lead researcher on the project, explained in a NASA press release, this method is also an effective way to test a star’s mass. “This microlensing method is a very independent and direct way to determine the mass of a star,” he said. “It’s like placing the star on a scale: the deflection is analogous to the movement of the needle on the scale.”

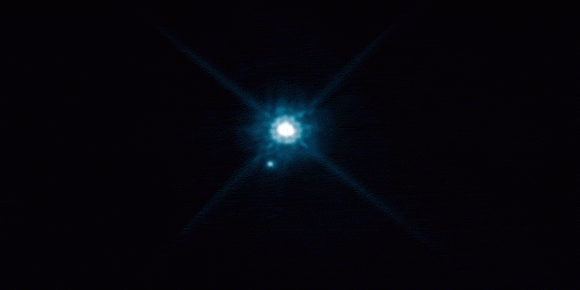
Animation showing the white dwarf star Stein 2051B as it passes in front of a distant background star. Credit: NASA

The deflection measurement yielded highly-accurate results concerning the mass of the white dwarf star – roughly 68 percent of the Sun’s mass (aka. 0.68 Solar masses) – which was also consistent with theoretical predictions. This is highly significant, in that it opens the door to a new and interesting method for determining the mass of distant stars that do not have companions.

In the past, astronomers have typically determined the mass of stars by observing binary pairs and calculating their orbital motions. Much in the same way that radial velocity measurements are used by astronomers to determine if a planet has a system of exoplanets, measuring the influence two stars have on each other is used to determine how much mass each possesses.

This was how astronomers determined the mass of the Sirius star system, which is located about 8.6 light years from Earth. This binary star system consists of a white supergiant (Sirius A) and a white dwarf companion (Sirius B) which orbit each other with a radial velocity of 5.5 km/s. These measurements helped astronomers determine that Sirius A has a mass of about 2.02 Solar masses while Sirius B weighs in at 0.978 Solar masses.

And while Stein 2051B has a companion (a bright red dwarf), astronomers cannot accurately measure its mass because the stars are too far apart – at least 8 billion km (5 billion mi). Hence, this method could be used in the future wherever companion stars are unavailable or too distant. The Hubble observations also helped the team to independently verify the theory that a white dwarf’s radius can be determined by its mass.

Artist’s impression of the binary pair made up by a white dwarf star in orbit around Sirius (a white supergiant). Credit: NASA, ESA and G. Bacon (STScI)

This theory was first proposed by Subrahmanyan Chandrasekhar in 1935, the Indian-American astronomer whose theoretical work on the evolution of stars (and black holes) earned him the Nobel Prize for Physics in 1983. They could also help astronomers to learn more about the internal composition of white dwarfs. But even with an instrument as sophisticated as the WFC3, obtaining these measurements was not without its share of difficulties.

As Jay Anderson, an astronomer with the STScI who led the analysis to precisely measure the positions of stars in the Hubble images, explained:

“Stein 2051B appears 400 times brighter than the distant background star. So measuring the extremely small deflection is like trying to see a firefly move next to a light bulb. The movement of the insect is very small, and the glow of the light bulb makes it difficult to see the insect moving.”

Dr. Sahu presented his team’s findings yesterday (June 7th) at the American Astronomical Society meeting in Austin, Texas. The team’s result will also appear in the journal Science on June 9th. And in the future, the researchers plan to use Hubble to conduct a similar microlensing study on Proxima Centauri, our solar system’s closest stellar neighbor and home to the closest exoplanet to Earth (Proxima b).

It is important to note that this is by no means the only modern experiment that has validated Einstein’s theories. In recent years, General Relativity has been confirmed through observations of rapidly spinning pulsars, 3D simulations of cosmic evolution, and (most importantly) the discovery of gravitational waves. Even in death, Einstein is still making valued contributions to astrophysics!

Further Reading: NASA

Star Should Have Gone Supernova, But it Imploded Into a Black Hole Instead

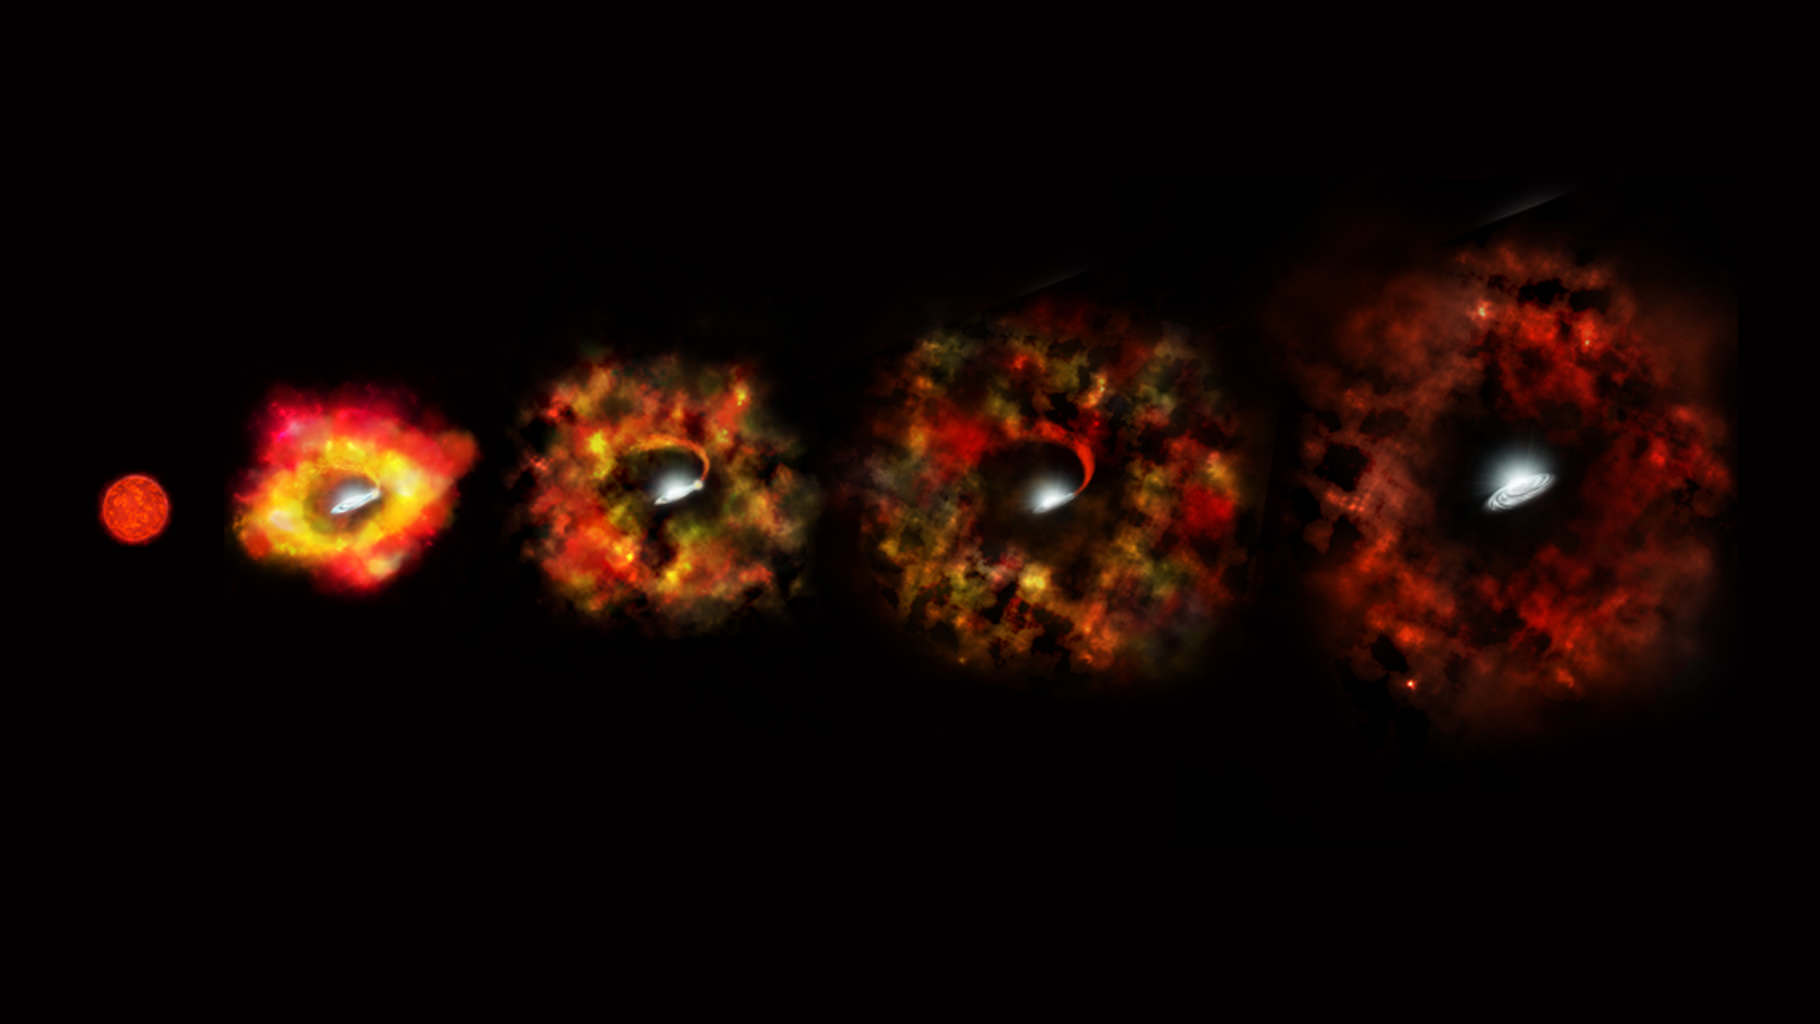
This illustration shows the final stages in the life of a supermassive star that fails to explode as a supernova, but instead implodes to form a black hole. Credit: NASA/ESA/P. Jeffries (STScI)

Collapsing stars are a rare thing to witness. And when astronomers are able to catch a star in the final phase of its evolution, it is a veritable feast for the senses. Ordinarily, this process consists of a star undergoing gravitational collapse after it has exhausted all of its fuel, and shedding its outer layers in a massive explosion (aka. a supernova). However, sometimes, stars can form black holes without the preceding massive explosion.

This process, what might be described as “going out not with a bang, but with a whimper”, is what a team of astronomers witnessed when observing N6946-BH1 – a star located in the Fireworks Galaxy (NGC 6946). Originally, astronomers thought that this star would exploded because of its significant mass. But instead, the star simply fizzled out, leaving behind a black hole.

The Fireworks Galaxy, a spiral galaxy located 22 million light-years from Earth, is so-named because supernova are known to be a frequent occurrence there. In fact, earlier this month, an amateur astronomer spotted what is now designated as SN 2017eaw. As such, three astronomers from Ohio Sate University (who are co-authors on the study) were expecting N6946-BH1 would go supernova when in 2009, it began to brighten.

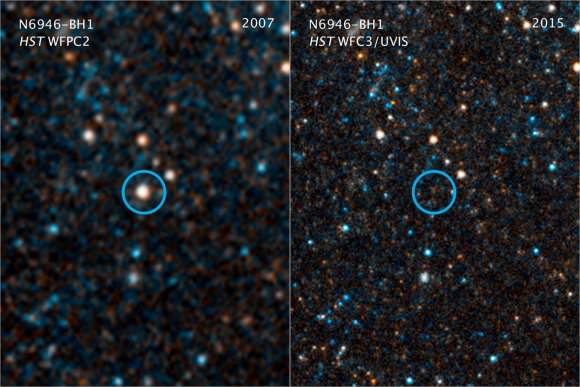
Visible-light and near-infrared photos from NASA’s Hubble Space Telescope showing the giant star N6946-BH1 before and after it vanished out of sight by imploding to form a black hole. Credit: NASA/ESA/C. Kochanek (OSU)

However, by 2015, it appeared to have winked out. As such, the team went looking for the remnants of it with the help of colleagues from Ohio State University and the University of Oklahoma. Using the combined power of the Large Binocular Telescope (LBT) and NASA’s Hubble and Spitzer space telescopes, they realized that the star had completely disappeared from sight.

The details of their research appeared in a study titled “The Search for Failed Supernovae with the Large Binocular Telescope: Confirmation of a Disappearing Star“, which recently appeared in the Monthly Notices of the Royal Astronomical Society. Among the many galaxies they were watching for supernovas, they had their sights set on the Fireworks Galaxy to see what had become of N6946-BH1.

After it experienced a weak optical outburst in 2009, they had anticipated that this red supergiant would go supernova – which seemed logical given that it was 25 times as massive as our Sun. After winking out in 2015, they had expected to find that the star had merely dimmed, or that it had cast off a dusty shell of material that was obscuring its light from view.

Their efforts included an LBT survey for failed supernovae, which they combined with infrared spectra obtained by the Spitzer Space Telescope and optical data from Hubble. However, all the surveys turned up negative, which led them to only one possible conclusion: that N6946-BH1 must have failed to go supernova and instead went straight to forming a blackhole.

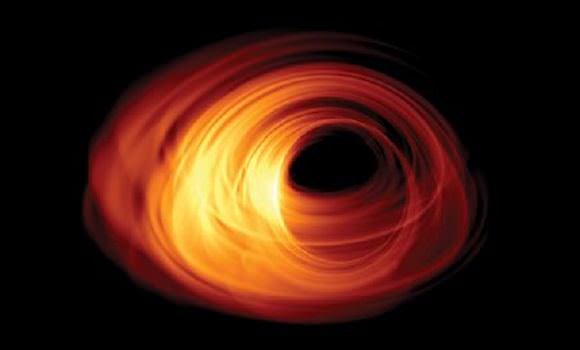
Simulated view of a black hole. Credit: Bronzwaer/Davelaar/Moscibrodzka/Falcke, Radboud University

As Scott Adams – a former Ohio State student who is now an astrophysicist at the Cahill Center for Astrophysics (and the lead author of the study) – explained in a NASA press release:

“N6946-BH1 is the only likely failed supernova that we found in the first seven years of our survey. During this period, six normal supernovae have occurred within the galaxies we’ve been monitoring, suggesting that 10 to 30 percent of massive stars die as failed supernovae. This is just the fraction that would explain the very problem that motivated us to start the survey, that is, that there are fewer observed supernovae than should be occurring if all massive stars die that way.”

A major implication of this study is the way it could shed new light on the formation of very massive black holes. For some time now, astronomers have believed that in order to form a black hole at the end of its life cycle, a star would have to be massive enough to cause a supernova. But as the team observed, it doesn’t make sense that a star would blow off its outer layers and still have enough mass left over to form a massive black hole.

As Christopher Kochanek – a professor of astronomy at The Ohio State University, the Ohio Eminent Scholar in Observational Cosmology and a co-author of the team’s study – explained:

“The typical view is that a star can form a black hole only after it goes supernova. If a star can fall short of a supernova and still make a black hole, that would help to explain why we don’t see supernovae from the most massive stars.”

This information is also important as far as the study of gravitational waves goes. In February of 2016, scientists at the Laser Interferometer Gravitational-wave Observatory (LIGO) announced the first detection of this strange phenomena, which were apparently generated by a massive black hole. If in fact massive black holes form from failed supernova, it would help astronomers to track down the sources more easily.

Be sure to check out this video of the observations made of this failed SN and black hole:

Further Reading: NASA, MNRAS


Astronomers Find a Rogue Supermassive Black Hole, Kicked out by a Galactic Collision

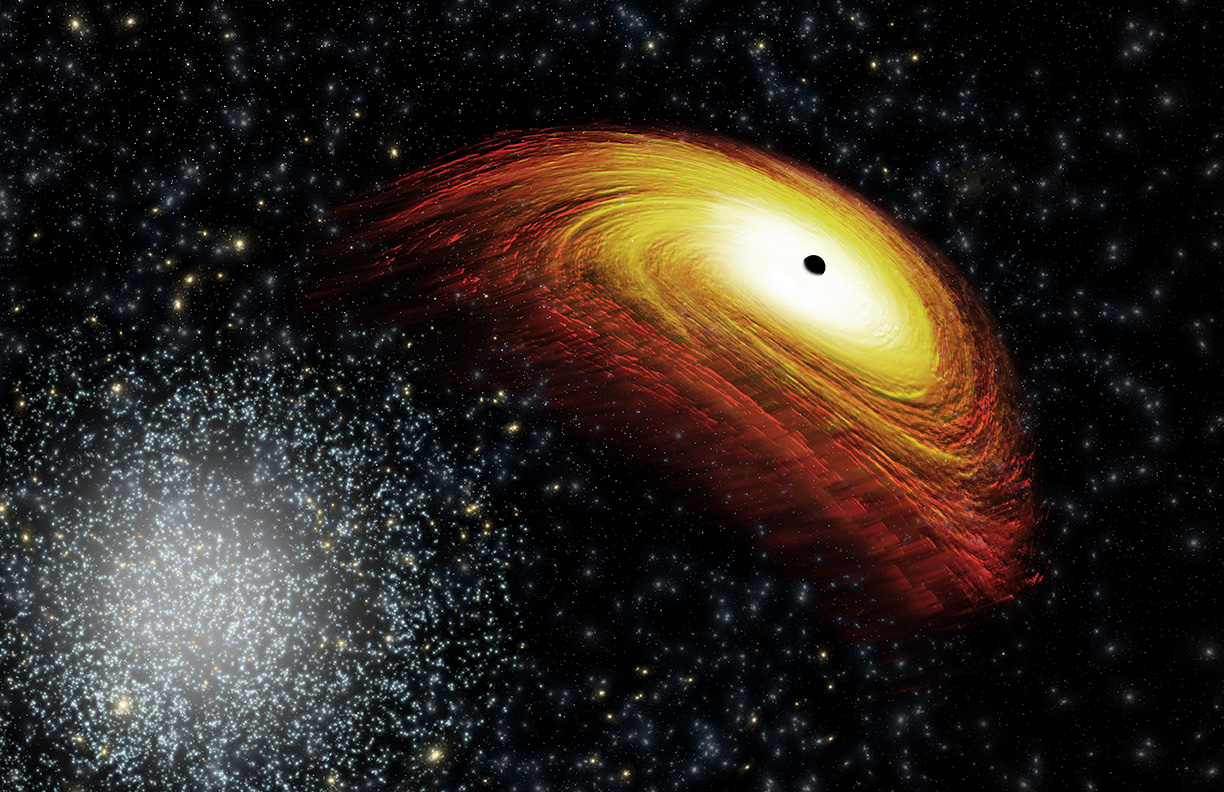
Using data from Chandra and other telescopes, astronomers have found a possible "recoiling" black hole. Credit: NASA/CXC/M.Weiss

When galaxies collide, all manner of chaos can ensue. Though the process takes millions of years, the merger of two galaxies can result in Supermassive Black Holes (SMBHs, which reside at their centers) merging and becoming even larger. It can also result in stars being kicked out of their galaxies, sending them and even their systems of planets into space as “rogue stars“.

But according to a new study by an international team of astronomers, it appears that in some cases, SMBHs could  also be ejected from their galaxies after a merger occurs. Using data from NASA’s Chandra X-ray Observatory and other telescopes, the team detected what could be a “renegade supermassive black hole” that is traveling away from its galaxy.

According to the team’s study – which appeared in the Astrophysical Journal under the title A Potential Recoiling Supermassive Black Hole, CXO J101527.2+625911 – the renegade black hole was detected at a distance of about 3.9 billion light years from Earth. It appears to have come from within an elliptical galaxy, and contains the equivalent of 160 million times the mass of our Sun.

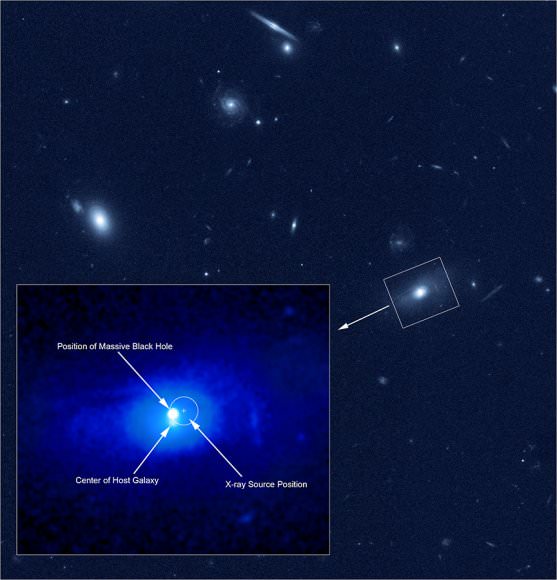
Hubble data showing the two bright points near the middle of the galaxy. Credit: NASA/CXC/NRAO/D.-C.Kim/STScI

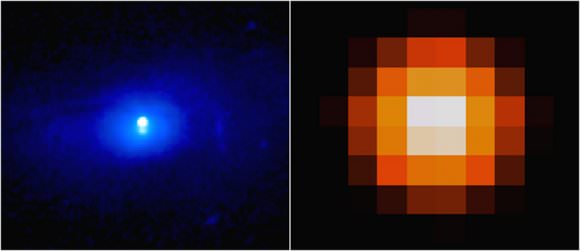
The team found this black hole while searching through thousands of galaxies for evidence of black holes that showed signs of being in motion. This consisted of sifting through data obtained by the Chandra X-ray telescope for bright X-ray sources – a common feature of rapidly-growing SMBHs – that were observed as part of the Sloan Digital Sky Survey (SDSS).

They then looked at Hubble data of all these X-ray bright galaxies to see if it would reveal two bright peaks at the center of any. These bright peaks would be a telltale indication that a pair of supermassive black holes were present, or that a recoiling black hole was moving away from the center of the galaxy. Last, the astronomers examined the SDSS spectral data, which shows how the amount of optical light varies with wavelength.

From all of this, the researchers invariably found what they considered to be a good candidate for a renegade black hole. With the help data from the SDSS and the Keck telescope in Hawaii, they determined that this candidate was located near, but visibly offset from, the center of its galaxy. They also noted that it had a velocity that was different from the galaxy – properties which suggested that it was moving on its own.

The image below, which was generated from Hubble data, shows the two bright points near the center of the galaxy. Whereas the one on the left was located within the center, the one on the right (the renegade SMBH) was located about 3,000 light years away from the center. Between the X-ray and optical data, all indications pointed towards it being a black hole that was kicked from its galaxy.

The bright X-ray source detected with Chandra (left), and data obtained from the SDSS and the Keck telescope in Hawaii. Credit: NASA/CXC/NRAO/D.-C.Kim/STScI

In terms of what could have caused this, the team ventured that the back hole might have “recoiled” when two smaller SMBHs collided and merged. This collision would have generated gravitational waves that could have then pushed the black hole out of the galaxy’s center. They further ventured that the black hole may have formed and been set in motion by the collision of two smaller black holes.

Another possible explanation is that two SMBHs are located in the center of this galaxy, but one of them is not producing detectable radiation – which would mean that it is growing too slowly. However, the researchers favor the explanation that what they observed was a renegade black hole, as it seems to be more consistent with the evidence. For example, their study showed signs that the host galaxy was experiencing some disturbance in its outer regions.

This is a possible indication that the merger between the two galaxies occurred in the relatively recent past. Since SMBH mergers are thought to occur when their host galaxies merge, this reservation favors the renegade black hole theory. In addition, the data showed that in this galaxy, stars were forming at a high rate. This agrees with computer simulations that predict that merging galaxies experience an enhanced rate of star formation.

But of course, additional researches is needed before any conclusions can be reached. In the meantime, the findings are likely to be of particular interest to astronomers. Not only does this study involve a truly rare phenomenon – a SMBH that is in motion, rather than resting at the center of a galaxy – but the unique properties involved could help us to learn more about these rare and enigmatic features.

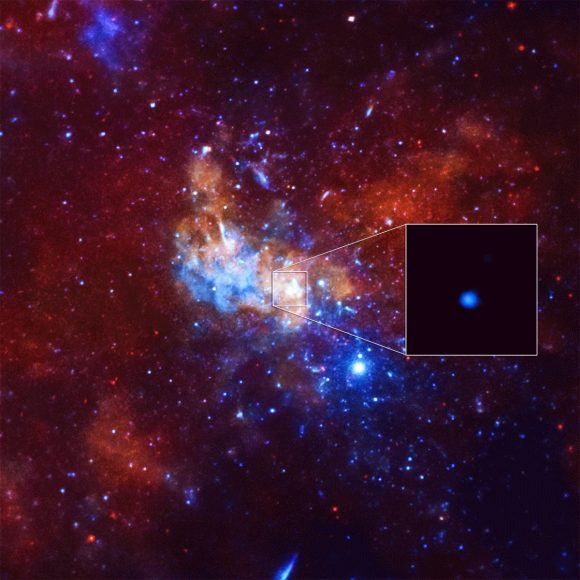
Detection of an unusually bright X-Ray flare from Sagittarius A*, a supermassive black hole in the center of the Milky Way galaxy. Credit: NASA/CXC/Stanford/I. Zhuravleva et al.

For one, the study of SMBHs could reveal more about the rate and direction of spin of these enigmatic objects before they merge. From this, astronomers would be able to better predict when and where SMBHs are about to merge. Studying the speed of recoiling black holes could also reveal additional information about gravitational waves, which could unlock additional secrets about the nature of space time.

And above all, witnessing a renegade black hole is an opportunity to see some pretty amazing forces at work. Assuming the observations are correct, there will no doubt be follow-up surveys designed to see where the SMBH is traveling and what effect it is having on the surrounding cosmic environment.

Ever since the 1970s, scientists have been of the opinion that most galaxies have SMBHs at their center. In the years and decades that followed, research confirmed the presence of black holes not only at the center of our galaxy – Sagittarius A* – but at the center of all almost all known massive galaxies. Ranging in mass from the hundreds of thousands to billions of Solar masses, these objects exert a powerful influence on their respective galaxies.

Be sure to enjoy this video, courtesy of the Chandra X-Ray Observatory:

Further Reading: Chandra X-ray Observatory, arXiv

Stunning View of the Crab Nebula Just Got Five Times Better

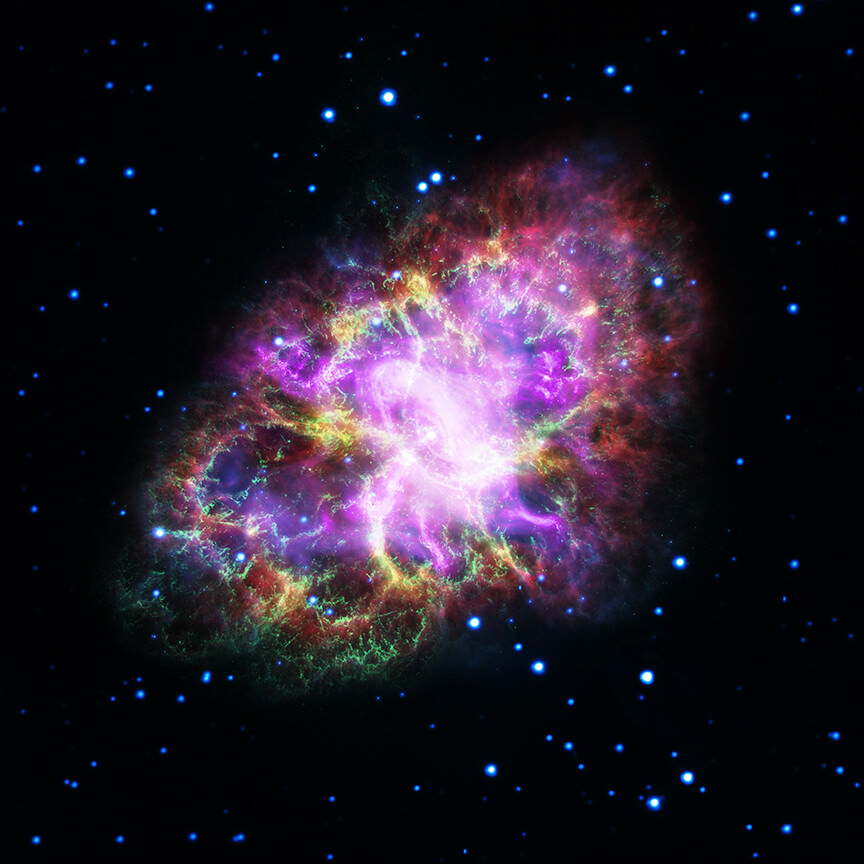
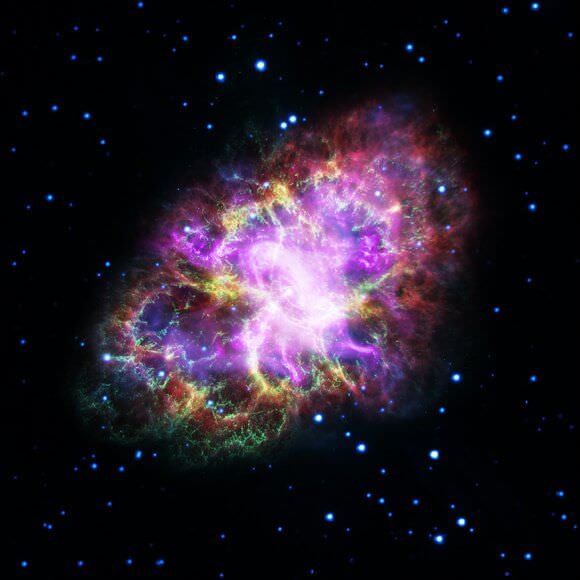
Astronomers have produced a highly detailed image of the Crab Nebula, by combining data from five telescopes, spanning nearly the entire breadth of the electromagnetic spectrum. Credit: NASA, ESA, G. Dubner (IAFE, CONICET-University of Buenos Aires) et al.; A. Loll et al.; T. Temim et al.; F. Seward et al.; VLA/NRAO/AUI/NSF; Chandra/CXC; Spitzer/JPL-Caltech; XMM-Newton/ESA; and Hubble/STScI.

Images of the Crab Nebula are always a treat because it has such intriguing and varied structure. Also, just knowing that this stellar explosion was witnessed and recorded by people on Earth more than 900 years ago (with the supernova visible to the naked eye for about two years) gives this nebula added fascination.

A new image just might be the biggest Crab Nebula treat ever, as five different observatories combined forces to create an incredibly detailed view, with stunning details of the nebula’s interior region.

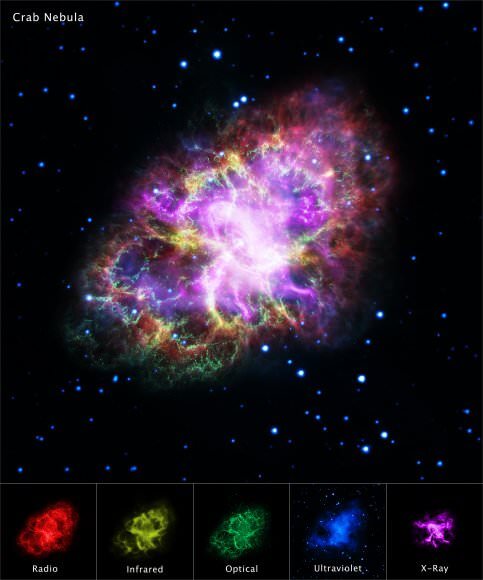
Data from the five telescopes span nearly the entire breadth of the electromagnetic spectrum, from radio waves seen by the Karl G. Jansky Very Large Array (VLA) to the powerful X-ray glow as seen by the orbiting Chandra X-ray Observatory. And, in between that range of wavelengths, the Hubble Space Telescope’s crisp visible-light view, and the infrared perspective of the Spitzer Space Telescope.

Astronomers have produced a highly detailed image of the Crab Nebula, by combining data from telescopes spanning nearly the entire breadth of the electromagnetic spectrum. This image combines data from five different telescopes: the VLA (radio) in red; Spitzer Space Telescope (infrared) in yellow; Hubble Space Telescope (visible) in green; XMM-Newton (ultraviolet) in blue; and Chandra X-ray Observatory (X-ray) in purple. Credit: NASA, ESA, G. Dubner (IAFE, CONICET-University of Buenos Aires) et al.; A. Loll et al.; T. Temim et al.; F. Seward et al.; VLA/NRAO/AUI/NSF; Chandra/CXC; Spitzer/JPL-Caltech; XMM-Newton/ESA; and Hubble/STScI.

The Crab is 6,500 light-years from Earth and spans about 10 light-years in diameter. The supernova that created it was first witnessed in 1054 A. D. At its center is a super-dense neutron star that is as massive as the Sun but with only the size of a small town. This pulsar rotates every 33 milliseconds, shooting out spinning lighthouse-like beams of radio waves and light. The pulsar can be seen as the bright dot at the center of the image.

Scientists say the nebula’s intricate shape is caused by a complex interplay of the pulsar, a fast-moving wind of particles coming from the pulsar, and material originally ejected by the supernova explosion and by the star itself before the explosion.

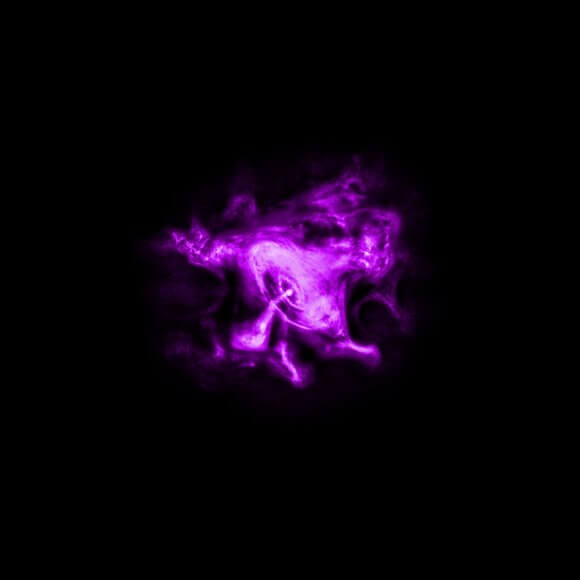
A new x-ray image of the Crab Nebula by the Chandra X-ray Observatory. Credit: X-ray: NASA/CXC/SAO.

For this new image, the VLA, Hubble, and Chandra observations all were made at nearly the same time in November of 2012. A team of scientists led by Gloria Dubner of the Institute of Astronomy and Physics (IAFE), the National Council of Scientific Research (CONICET), and the University of Buenos Aires in Argentina then made a thorough analysis of the newly revealed details in a quest to gain new insights into the complex physics of the object. They are reporting their findings in the Astrophysical Journal (see the pre-print here).

About the central region, the team writes, “The new HST NIR [near infrared] image of the central region shows the well-known elliptical torus around the pulsar, composed of a series of concentric narrow features of variable intensity and width… The comparison of the radio and the X-ray emission distributions in the central region suggests the existence of a double-jet system from the pulsar, one detected in X-rays and the other in radio. None of them starts at the pulsar itself but in its environs.”

“Comparing these new images, made at different wavelengths, is providing us with a wealth of new detail about the Crab Nebula. Though the Crab has been studied extensively for years, we still have much to learn about it,” Dubner said.

A multi-wavelength layout of the Crab Nebula. Credit: (Credit: X-ray: NASA/CXC/SAO; Optical: NASA/STScI; Infrared: NASA/JPL/Caltech; Radio: NSF/NRAO/VLA; Ultraviolet: ESA/XMM-Newton).

Read the team’s paper: Morphological properties of the Crab Nebula: a detailed multiwavelength study based on new VLA, HST, Chandra and XMM-Newton images
Sources: Chandra, Hubble

Hubble Takes Advantage Of Opposition To Snap Jupiter

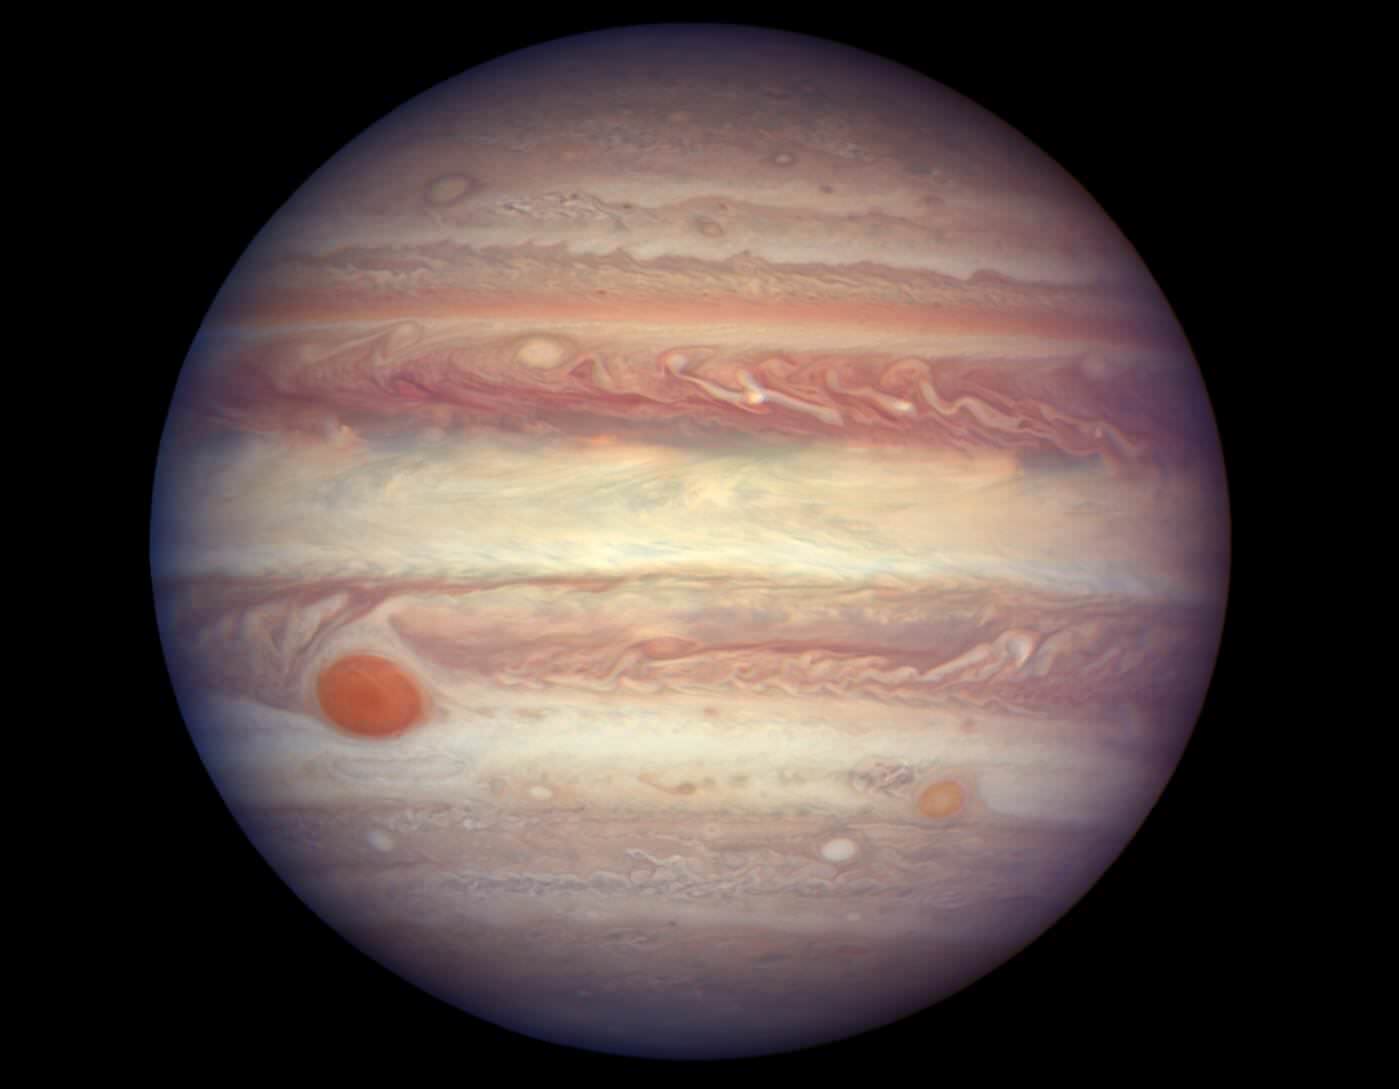
Image of Jupiter, taken by the Hubble Space Telescope when the planet was at a distance of 670 million kilometers from Earth. Credit: NASA/ESA/A. Simon (GSFC)

On April, 7th, 2017, Jupiter will come into opposition with Earth. This means that Earth and Jupiter will be at points in their orbit where the Sun, Earth and Jupiter will all line up. Not only will this mean that Jupiter will be making its closest approach to Earth – reaching a distance of about 670 million km (416 million mi) – but the hemisphere that faces towards us will be fully illuminated by the Sun.

Because of its proximity and its position, Jupiter will be brighter in the night sky than at any other time during the year. Little wonder then why NASA and the ESA are taking advantage of this favorable alignment to capture images of the planet with the Hubble Space Telescope. Already, on April 3rd, Hubble took the wonderful color image (shown above) of Jupiter, which has now been released.

Using its Wide Field Camera 3 (WFC3), Hubble was able to observe Jupiter in the visible, ultraviolet and infrared spectrum. From these observations, members of the Hubble science team produced a final composite image that allowed features in its atmosphere – some as small as 130 km across – to be discernible. These included Jupiter’s colorful bands, as well as its massive anticyclonic storms.

Image of Jupiter’s Great Red Spot, taken by the Voyager 1 space probe during its flyby on March 5, 1979, and re-processed on November 6, 1998. Credit: NASA/JPL

The largest of these – the Great Red Spot – is believed to have been raging on the surface ever since it was first observed in the 1600s. In addition, it is estimated that the wind speeds can reach up to 120 m/s (430 km/h; 267 mph) at its outer edges. And given its dimensions – between 24-40,000 km from west to east and 12-14,000 km from south to north – it is large enough to swallow the Earth whole.

Astronomers have noticed how the storm appears to have been shrinking and expanding throughout its recorded history. And as the latest images taken by Hubble (and by ground-based telescopes) have confirmed, the storm continues to shrink. Back in 2012, it was even suggested that the Giant Red Spot might eventually disappear, and this latest evidence seems to confirm that.

No one is entirely sure why the storm is slowly collapsing; but thanks to images like these, researchers are gaining a better understanding of what mechanisms power Jupiter’s atmosphere. Aside from the Great Red Spot, the similar but smaller anticyclonic storm in the farther southern latitudes – aka. Oval BA or “Red Spot Junior” – was also captured in this latest image.

Located in the region known as the South Temperate Belt, this storm was first noticed in 2000 after three small white storms collided. Since then, the storm has increased in size, intensity and changed color (becoming red like its “big brother”). It is currently estimated that wind speeds have reached 618 km/h (384 mph), and that it has become as large as Earth itself (over 12,000 km, 7450 mi in diameter).

Image of Jupiter, made during the Outer Planet Atmospheres Legacy (OPAL) programme on January 19th, 2015. Credit: NASA/ESA/A. Simon (GSFC)/M. Wong (UC Berkeley)/G. Orton (JPL-Caltech)

And then there are the color bands that make up Jupiter’s surface and give it its distinct appearance. These bands are essentially different types of clouds that run parallel to the equator and differ in color based on their chemical compositions. Whereas the whiter bands have higher concentrations of ammonia crystals, the darker (red, orange and yellow) have lower concentrations.

Similarly, these color patterns are also affected by the upwelling of compounds that change color when they are exposed to ultraviolet light from the Sun. Known as chromophores, these colorful compounds are likely made up of sulfur, phosphorous and hydrocarbons. The planet’s intense wind speeds of up to 650 km/h (~400 mph) also ensure that the bands are kept separate.

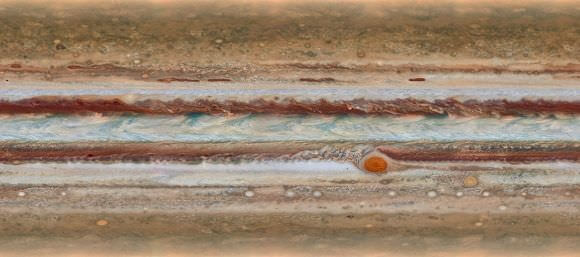
These and other observations of Jupiter are part of the Outer Planet Atmospheres Legacy (OPAL) progamme. Dedicated to ensuring that Hubble gets as much information as it can before it is retired – sometime in the 2030s or 2040s – this program ensures that time is dedicated each year to observing Jupiter and the other gas giants. From the images obtained, OPAL hopes to create maps that planetary scientists can study long after Hubble is decommissioned.

The project will ultimately observe all of the giant planets in the Solar System in a wide range of filters. The research that this enables will not only help scientists to study the atmospheres of the giant planets, but also to gain a better understanding of Earth’s atmosphere and those of extrasolar planets. The programme began in 2014 with the study of Uranus and has been studying Jupiter and Neptune since 2015. In 2018, it will begin viewing Saturn.

Further Reading: Hubble Space Telescope

Deepest X-ray Image Ever Made Contains Mysterious Explosion

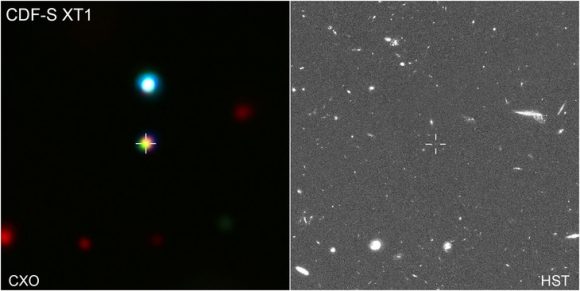
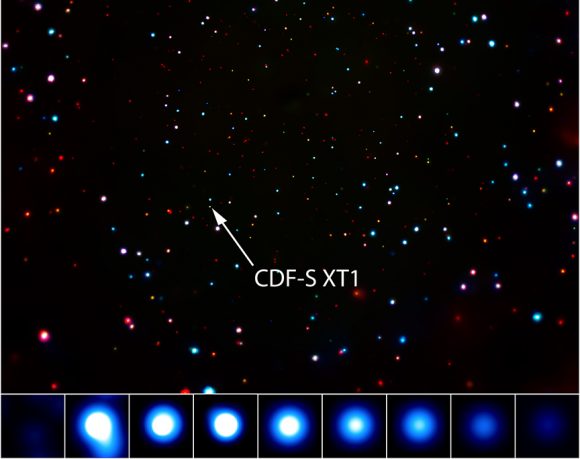
A mysterious flash of X-rays has been discovered by NASA’s Chandra X-ray Observatory in the deepest X-ray image ever obtained. Credit: NASA/Chandra/Harvard

For over sixty years, astronomers have been exploring the Universe for x-ray sources. Known to be associated with stars, clouds of super heated gas, interstellar mediums, and destructive events, the detection of cosmic x-rays is challenging work. In recent decades, astronomers have been benefited immensely from by the deployment of orbital telescopes like the Chandra X-ray Observatory.

Since it was launched on July 23rd, 1999, Chandra has been NASA’s flagship mission for X-ray astronomy. And this past week (on Thurs. March 30th, 2017), the Observatory accomplished something very impressive. Using its suite of advanced instruments, the observatory captured a mysterious flash coming from deep space. Not only was this the deepest X-ray source ever observed, it also revealed what could be an entirely new phenomenon.

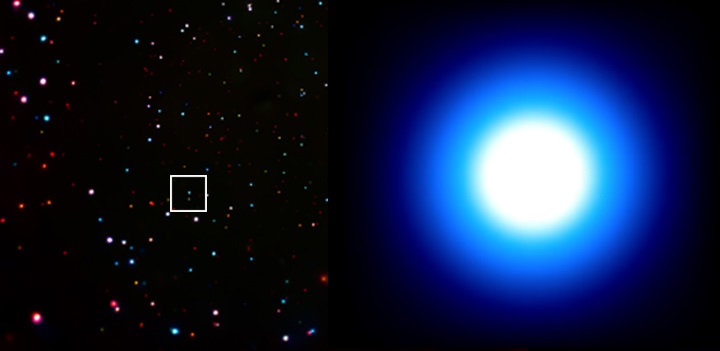
Located in the region of the sky known as the Chandra Deep Field-South (CDF-S), this X-ray emission source appeared to have come from a small galaxy located approximately 10.7 billion light-years from Earth. It also had some remarkable properties, producing more energy in the space of a few minutes that all the stars in the galaxy combined.

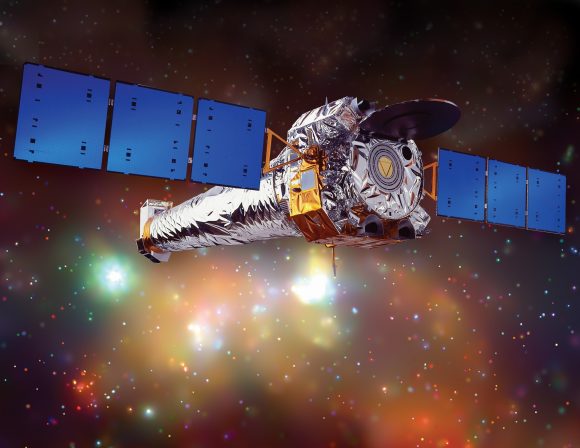
Artist illustration of the Chandra X-ray Observatory, the most sensitive X-ray telescope ever built. Credit: NASA/CXC/NGST

Originally detected in 2014 by a team of researchers from Penn State University and the Pontifical Catholic University of Chile in Santiago, Chile, this source was not even detected in the X-ray band at first. However, it quickly caught the team’s attention as it erupted and became 1000 brighter in the space of a few hours. At this point, the researchers began gathering data using Chandra’s Advanced CCD Imaging Spectronomer.

A day after the flare-up, the X-ray source had faded to the point that Chandra was no longer able to detect it. As Niel Brandt – the Verne M. Willaman Professor of Astronomy and Astrophysics at Penn State and part of the team that first observed it – described the discovery in a Penn State press release:

“This flaring source was a wonderful surprise bonus that we accidentally discovered in our efforts to explore the poorly understood realm of the ultra-faint X-ray universe. We definitely ‘lucked out’ with this find and now have an exciting new transient phenomenon to explore in future years.”

Thousands of hours of legacy data from the Hubble and Spitzer Space Telescopes was then consulted in order to determine the location of the CDF-S X-ray source. And though scientists were able to determine that the image of the X-ray source placed it beyond any that had been observed before, they are not entirely clear as to what could have caused it.

X-ray (left) and optical (right) images of the space around the X-ray source, made with Chandra and the Hubble Space Telescope, respectively. Credit: NASA/CXC/F. Bauer et al.

On the one hand, it could be the result of some sort of destructive event, or something scientists have never before seen. The reason for this has to do with the fact that X-ray bursts also come with a gamma-ray burst (GRB), which appears to be missing here. Essentially, GRBs are jetted explosions that are triggered by the collapse of a massive star or by the merger of two neutron stars (or a neutron star with a black hole).

Because of this, three possible explanations have been suggested. In the first, the CDF-S X-ray source is indeed the result of a collapsing star or merger, but the resulting jets are not pointed towards Earth. In the second, the same scenario is responsible for the x-ray source, but the GRB lies beyond the small galaxy. The third possible explanation is that the event was caused by a medium-sized black hole shredding a white dwarf star.

Unfortunately, none of these explanations seem to fit the data. However, these research team also noted that these possibilities are not that well understood, since none have been witnessed in the Universe. As Franz Bauer – an astronomer from the Pontifical Catholic University of Chile – said: “Ever since discovering this source, we’ve been struggling to understand its origin. It’s like we have a jigsaw puzzle but we don’t have all of the pieces.”

Not only has Chandra not observed any other X-ray sources like this one during the 17 years it has surveyed the CDF-S region, but no similar events have been observed by the space telescope anywhere in the Universe during its nearly two decades of operation. On top of that, this event was brighter, more short-lived, and occurred in a smaller, younger host galaxy than other unexplained X-ray sources.

Still image of the X-ray source observed by Chandra, showing the captured flare up at bottom Credit: NASA/CXC/Pontifical Catholic Univ./F.Bauer et al.

From all of this, the only takeaway appears to be that the event was likely the result of a cataclysmic event, like a neutron star or a white dwarf being torn apart. But the fact that none of the more plausible explanations seem to account for it’s peculiar characteristics would seem to suggest that astronomers may have witnessed an entirely new kind of cataclysmic event.

The team’s study – “A New, Faint Population of X-ray Transient“- is available online and will be published in the June 2017 issue of the Monthly Notices of the Royal Astronomical Society. In the meantime, astronomers will be sifting through the data acquired by Chandra and other X-ray observatories – like the ESA’s XMM-Newton and NASA’s Swift Gamma-Ray Burst Mission – to see if they can find any other instances of this kind of event.

And of course, future surveys conducted using Chandra and next-generation X-ray telescopes will also be on the lookout for these kind of short-lived, high-energy X-ray bursts. It’s always good when the Universe throws us a curve ball. Not only does it show us that we have more to learn, but it also teaches us that we must never grow complacent in our theories.

Be sure to check out this animation of the CDF-S X-ray source too, courtesy of the Chandra X-ray Observatory:

Further Reading:  Chandra, PennState

Supernova Blast Wave Still Visible After 30 Years

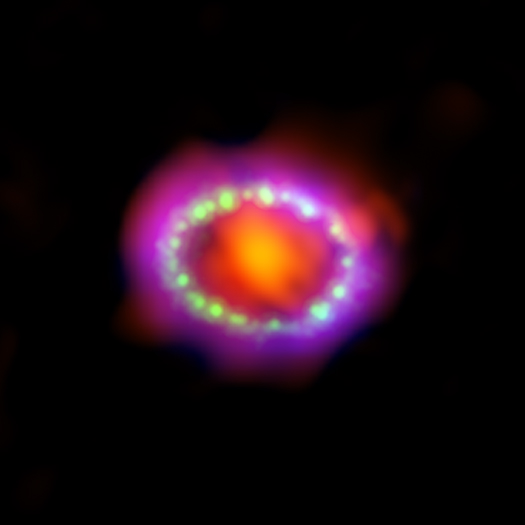
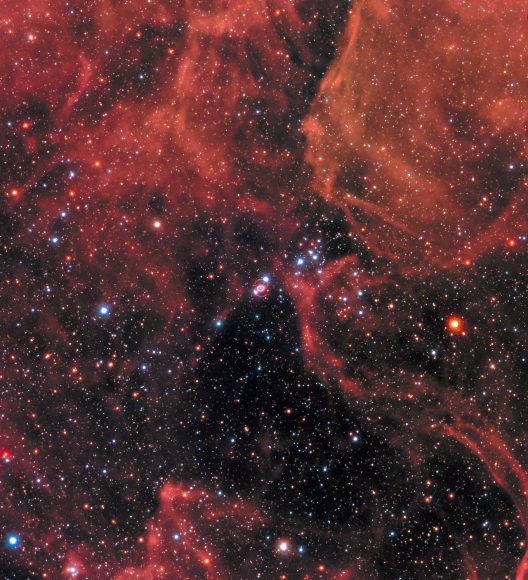
To celebrate 30 years since Supernova 1987A was spotted, a new composite image shows the most recent images of the object, and contains X-rays from NASA's Chandra X-ray Observatory (blue), visible light data from NASA's Hubble Space Telescope (green), and submillimeter wavelength data from the international Atacama Large Millimeter/submillimeter Array (ALMA) telescope in Chile (red).

30 years ago today, a supernova explosion was spotted in the southern hemisphere skies. The exploding star was located in the Large Magellanic Cloud — a satellite galaxy of the Milky Way – and Supernova 1987A was the brightest and nearest supernova explosion for modern astronomers to observe. This has provided an amazing opportunity to study the death of a star.

Telescopes around the world and in space have been keeping an eye on this event, and the latest images show the blast wave from the original explosion is still expanding, and it has plowed into a ring expelled by the pre-supernova star. The latest images and data reveal the blast is now moving past the ring.

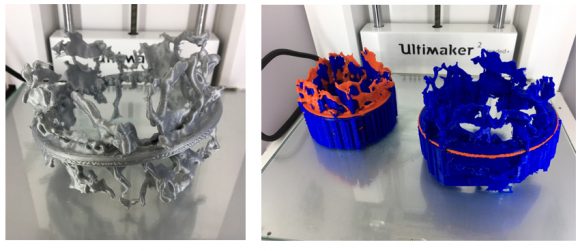
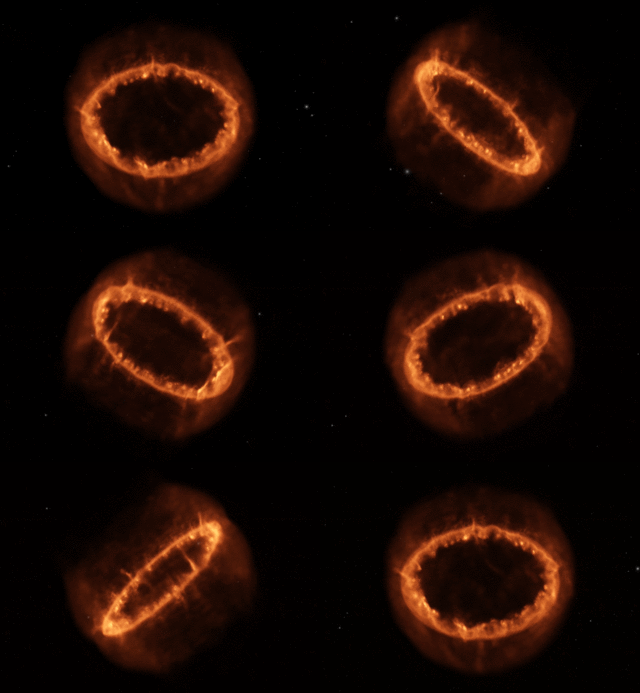
Got a 3-D printer? You can print out your own version of SN1987A! Find the plans here.

Two different versions of 3-D printed models of SN1987A. Credit: Salvatore Orlando (INAF-Osservatorio Astronomico di Palermo) & NASA/CXC/SAO/A.Jubett et al.

Below is the latest image of this supernova, as seen by the Hubble Space Telescope. You can see it in the center of the image among a backdrop of stars, and the supernova is surrounded by gas clouds.

This new image of the supernova remnant SN 1987A was taken by the NASA/ESA Hubble Space Telescope in January 2017 using its Wide Field Camera 3 (WFC3). Credit: NASA, ESA, and R. Kirshner (Harvard-Smithsonian Center for Astrophysics and Gordon and Betty Moore Foundation) and P. Challis (Harvard-Smithsonian Center for Astrophysics)

Hubble launched in 1990, just three years after the supernova was detected, so Hubble has a long history of observations. In addition, the Chandra X-ray telescope – launched in 1999 – has been keeping an eye on the explosion too.

Here are a few animations and images of SN1987A over the years:

This scientific visualization, using data from a computer simulation, shows Supernova 1987A, as the luminous ring of material we see today.
Credits: NASA, ESA, and F. Summers and G. Bacon (STScI); Simulation Credit: S. Orlando (INAF-Osservatorio Astronomico di Palermo)
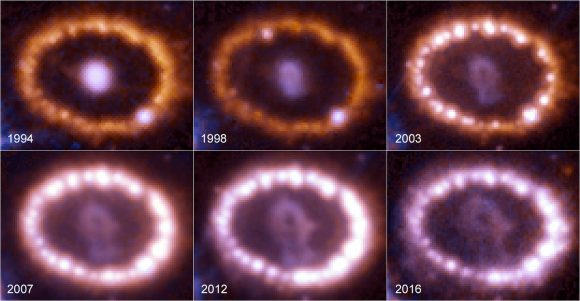
This montage shows the evolution of the supernova SN 1987A between 1994 and 2016, as seen by the NASA/ESA Hubble Space Telescope. Credit:
NASA, ESA, and R. Kirshner (Harvard-Smithsonian Center for Astrophysics and Gordon and Betty Moore Foundation) and P. Challis (Harvard-Smithsonian Center for Astrophysics)

Here’s a link to the original astronomer’s telegram announcing the detection.

Astronomers estimate that the ring material was was ejected about 20,000 years before the actual explosion took place. Then, the initial blast of light from the supernova illuminated the rings. They slowly faded over the first decade after the explosion, until the shock wave of the supernova slammed into the inner ring in 2001, heating the gas to searing temperatures and generating strong X-ray emission.

The observations by Hubble, Chandra and telescopes around the world has shed light on how supernovae can affect the dynamics and chemistry of their surrounding environment, and continue to shape galactic evolution.

See additional images and animations at the Chandra website, ESA’s Hubble website , and NASA.

Huge News, Seven Earth-Sized Worlds Orbiting a Red Dwarf, Three in the Habitable Zone

Illustration showing the possible surface of TRAPPIST-1f, one of the newly discovered planets in the TRAPPIST-1 system. Credits: NASA/JPL-Caltech
Illustration showing the possible surface of TRAPPIST-1f, one of the newly discovered planets in the TRAPPIST-1 system. It's a very active flare star. Credits: NASA/JPL-Caltech

In what is surely the biggest news since the hunt for exoplanets began, NASA announced today the discovery of a system of seven exoplanets orbiting the nearby star of TRAPPIST-1. Discovered by a team of astronomers using data from the TRAPPIST telescope in Chile and the Spitzer Space Telescope, this find is especially exciting since all of these planets are believed to be Earth-sized and terrestrial (i.e. rocky).

But most exciting of all is the fact that three of these rocky exoplanets orbit within the star’s habitable zone (aka. “Goldilocks Zone”). This means, in effect, that these planets are capable of having liquid water on their surfaces and could therefore support life. As far as extra-solar planet discoveries go, this is without precedent, and the discovery heralds a new age in the search for life beyond our Solar System.

Continue reading “Huge News, Seven Earth-Sized Worlds Orbiting a Red Dwarf, Three in the Habitable Zone”

What Will the Voyager Spacecraft Encounter Next? Hubble Helps Provide a Roadmap

An artist's concept of Voyager 1's view of the Solar System. Voyager 1 is one of our first interstellar probes, though it's an inadvertent one. It has no particular destination. Credit: NASA, ESA, and J. Zachary and S. Redfield (Wesleyan University); Artist's Illustration Credit: NASA, ESA, and G. Bacon (STScI).

The twin Voyager spacecraft are now making their way through the interstellar medium. Even though they are going where none have gone before, the path ahead it is not completely unknown.

Astronomers are using the Hubble Space Telescope to observe the ‘road’ ahead for these pioneering spacecraft, to ascertain what various materials may lay along the Voyagers’ paths through space.

Combining Hubble data with the information the Voyagers are able to gather and send back to Earth, astronomers said a preliminary analysis reveals “a rich, complex interstellar ecology, containing multiple clouds of hydrogen laced with other elements.”

“This is a great opportunity to compare data from in situ measurements of the space environment by the Voyager spacecraft and telescopic measurements by Hubble,” said Seth Redfield of Wesleyan University, who led the study. “The Voyagers are sampling tiny regions as they plow through space at roughly 38,000 miles per hour. But we have no idea if these small areas are typical or rare. The Hubble observations give us a broader view because the telescope is looking along a longer and wider path. So Hubble gives context to what each Voyager is passing through.”

The combined data is also providing new insights into how our Sun travels through interstellar space, and astronomers hope that these combined observations will help them characterize the physical properties of the local interstellar medium.

“Ideally, synthesizing these insights with in situ measurements from Voyager would provide an unprecedented overview of the local interstellar environment,” said Hubble team member Julia Zachary of Wesleyan University.

The initial look at the clouds’ composition shows very small variations in the abundances of the chemical elements contained in the structures.

“These variations could mean the clouds formed in different ways, or from different areas, and then came together,” Redfield said.

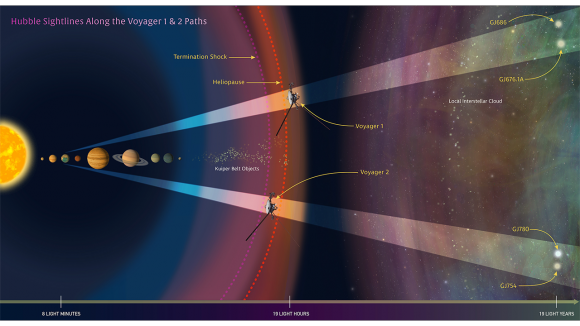
In this illustration, NASA’s Hubble Space Telescope is looking along the paths of NASA’s Voyager 1 and 2 spacecraft as they journey through the solar system and into interstellar space. Hubble is gazing at two sight lines (the twin cone-shaped features) along each spacecraft’s path. The telescope’s goal is to help astronomers map interstellar structure along each spacecraft’s star-bound route. Each sight line stretches several light-years to nearby stars. Credit: NASA, ESA, and Z. Levy (STScI).

Astronomers are also seeing that the region that we and our solar system are passing through right now contains “clumpier” material, which may affect the heliosphere, the large bubble that is produced by our Sun’s powerful solar wind. At its boundary, called the heliopause, the solar wind pushes outward against the interstellar medium. Hubble and Voyager 1 made measurements of the interstellar environment beyond this boundary, where the wind comes from stars other than our sun.

“I’m really intrigued by the interaction between stars and the interstellar environment,” Redfield said. “These kinds of interactions are happening around most stars, and it is a dynamic process.”

Both Voyagers 1 and 2 launched in 1977 and both explored Jupiter and Saturn. Voyager 2 went on to visit Uranus and Neptune.

Voyager 1 is now 13 billion miles (20 billion km) from Earth, and entered interstellar space in 2012, the region between the stars that is filled with gas, dust, and material recycled from dying stars. It is the farthest a human-made spacecraft has even traveled. Next big ‘landmark’ for Voyager 2 is in about 40,000 years when it will come within 1.6 light-years of the star Gliese 445, in the constellation Camelopardalis.

Voyager 2, is 10.5 billion miles (16.9 billion km) from Earth, and will pass 1.7 light-years from the star Ross 248 in about 40,000 years.

Of course, neither spacecraft will be operational by then.

But scientists hope that for at least the next 10 years, the Voyagers will be making measurements of interstellar material, magnetic fields, and cosmic rays along their trajectories. The complimentary Hubble observations will help to map interstellar structure along the routes. Each sight line stretches several light-years to nearby stars. Sampling the light from those stars, Hubble’s Space Telescope Imaging Spectrograph measured how interstellar material absorbed some of the starlight, leaving telltale spectral fingerprints.

When the Voyagers run out of power and are no longer able to communicate with Earth, astronomers still hope to use observations from Hubble and subsequent space telescopes to characterize the environment where our robotic emissaries to the cosmos will travel.

Source: HubbleSite