Saturn to Shed its Spooky Spokes for Summer

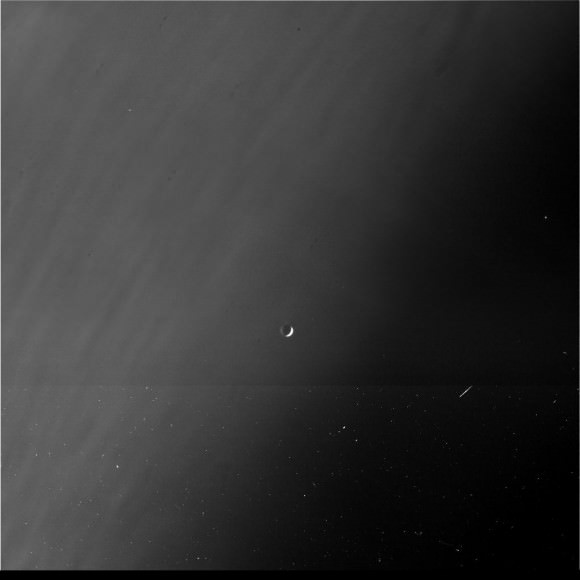
Cassini image of Saturn's rings from Dec. 20, 2012 (NASA/JPL-Caltech/SSI)

As Saturn steadily moves along its 29.7-year-long orbit toward summertime in its northern hemisphere NASA’s Cassini spacecraft is along for the ride, giving astronomers a front-row seat to seasonal changes taking place on the ringed planet.

One of these fluctuations is the anticipated disappearance of the “spokes” found in the rings, a few of which can be seen above in an image captured on Dec. 20 of last year.

First identified by Voyager in 1980, spokes are ghostly streaks of varying size and brightness that stretch radially across Saturn’s ring system. They orbit around the planet with the ring particles and can last for hours before fading away.
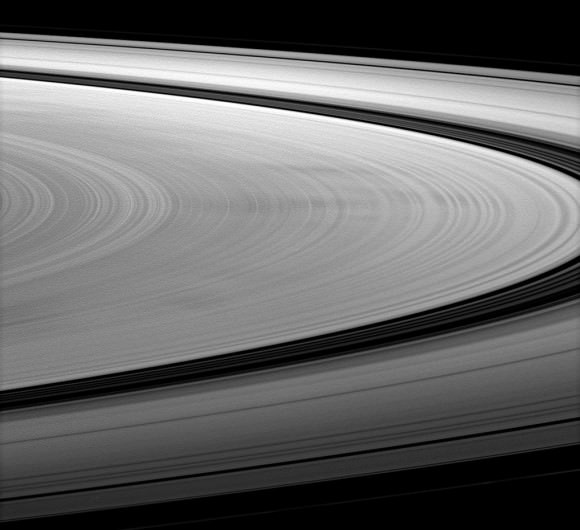
Under the right lighting conditions spokes can appear dark, as seen in this image from Jan. 2010 (NASA/JPL/SSI)

One of the most elusive and transient of features found on Saturn, spokes are thought to be made up of larger microscopic particles of ice — each at least a micron or more — although exactly what makes them gather together isn’t yet known.

They are believed to be associated with interactions between ring particles and Saturn’s electromagnetic field.

“The spokes are most prominent at a point in the rings where the ring particles are moving at the same speed as Saturn’s electromagnetic field,” said Brad Wallis, Cassini rings discipline scientist. “That idea and variations of it are still the most prominent theories about the spokes.”

Other researchers have suggested that they may be caused by electron beams issuing outwards along magnetic field lines from lightning storms in Saturn’s atmosphere.

Regardless of how they are created, spokes are more often observed when sunlight is striking the rings edge-on — that is, during the spring and autumn equinoxes. Perhaps the increased solar radiation along Saturn’s equator increases the formation of lightning-generating storms, in turn creating more spokes? It’s only a guess, but Cassini — and astronomers — will be watching to see if these furtive features do in fact fail to appear during Saturn’s northern summer, the height of which arrives in 2016.

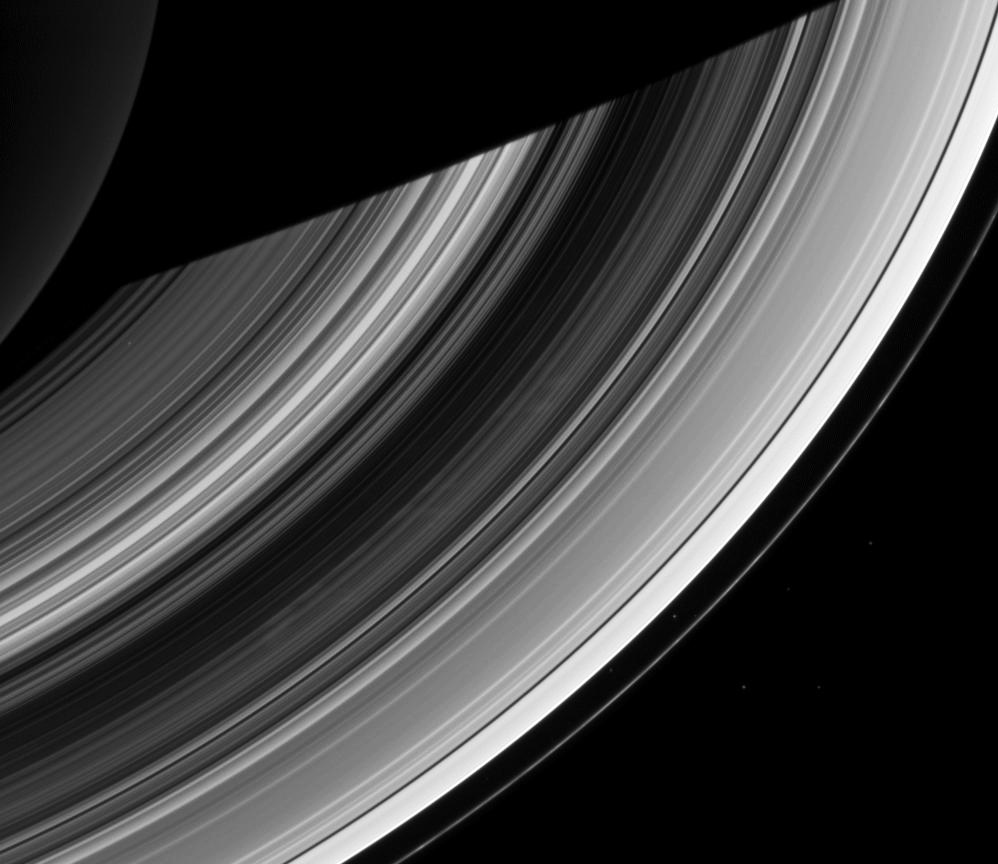
Read more about Saturn’s spokes here.

Dry Ice Drives Dramatic Changes on Mars

Mars may not be tectonically active but that doesn’t mean there’s nothing happening on the Red Planet’s surface. This video from NASA’s Jet Propulsion Laboratory shows the dramatic seasonal changes that take place in Mars’ polar regions when the frozen carbon dioxide — called “dry ice”  — coating the basalt sand dunes begins to thaw and cracks, releasing jets of sublimating CO2 gas that carry dark material upwards and outwards, staining the frozen surface of the dunes. Imagine what it would be like to be standing nearby when these jets erupt!

This process occurs around the upper latitudes of Mars every spring and is responsible for the dark (and sometimes light) mottled discolorations observed across sandy and dune-covered terrain.

Bright fans are created when surface conditions cause escaping CO2 gas to condense back onto the surface. (NASA/JPL/University of Arizona)

If a prevailing wind happens to be blowing when the gases are escaping the cracks in the ice, whatever material they are carrying will be spread by the wind across the dunes in long streaks and fans. Read more about this process here.

“It’s an amazingly dynamic process. We had this old paradigm that all the action on Mars was billions of years ago. Thanks to the ability to monitor changes with the Mars Reconnaissance Orbiter, one of the new paradigms is that Mars has many active processes today.”

– Candice Hansen, Planetary Science Institute

The images in the video were acquired by the HiRISE camera aboard the Mars Reconnaissance Orbiter, which has been orbiting and observing Mars in unprecedented detail for over six years. See more HiRISE images of the Martian surface here.

Video: NASA/JPL

Is This Icy “Mega” Meteorite Really From Outer Space?

Earlier today, Euronews reported an icy “mega meteorite” fall in a farmer’s field in the Hrira region of Morocco. The farmer found the chunk of supposed space ice and put it in his freezer for later investigation by scientists, who apparently confirmed that it is in fact from space.

But… really?

Continue reading “Is This Icy “Mega” Meteorite Really From Outer Space?”

Lighting Up Mercury’s Shadowy North Pole

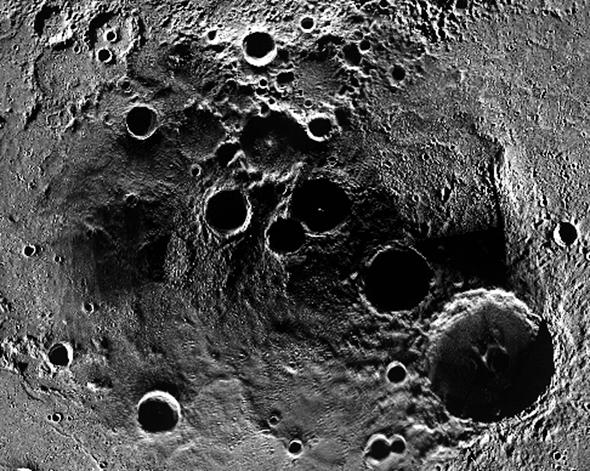
Part of a stereographic projection of Mercury’s north pole

Talk about northern exposure! This is a section of a much larger image, released today by the MESSENGER team, showing the heavily-cratered north pole of Mercury as seen by the MESSENGER spacecraft’s Mercury Dual Imaging System (MDIS) instrument.

See the full-size image below:

Many MDIS images were averaged together to create a mosaic of Mercury’s polar region, which this stereographic projection is centered on. MESSENGER is at its lowest altitude as it passes over Mercury’s northern hemisphere — about  200 kilometers (124 miles), which is just a little over half the altitude of the ISS.

The largest centrally-peaked crater near the center is Prokofiev, named after a 20th-century Russian composer. Approximately 110 km (68 mi.) in diameter, its permanently-shadowed interior is home to radar-bright deposits that are thought to contain water ice.

Even though Mercury is almost three times closer to the Sun than Earth is and hosts searing daytime temperatures of 425ºC (800ºF), there’s virtually no atmosphere to hold or transmit that heat. Nighttime temperatures can reach as low as -185ºC (-300ºF), and since a day on Mercury is 176 Earth days long it gets very cold for quite a long time!

Also, because Mercury’s axis of rotation isn’t tilted like Earth’s, low elevation areas near the poles receive literally no sunlight. Unless vaporized by a meteorite impact any ice gathered inside these deep craters would remain permanently frozen.

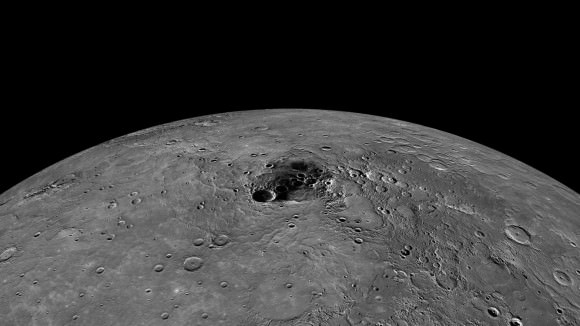
Here’s an orthographic projection of the image above, showing what the scene would look like on Mercury — that is, if it was ever fully lit by the Sun, which it isn’t.

Many of the craters on Mercury’s north pole have recently been named after famous artists, authors and composers, such as Kandinsky, Stieglitz, Goethe, and even one named after J.R.R. Tolkien. You can see an annotated image showing the names of Mercury’s north polar craters here.

Read More: “The Hobbit” Author Gets a Crater on Mercury

On November 29, NASA will host a news conference at 2 p.m. EST to reveal new observations from MESSENGER, the first spacecraft to orbit Mercury. The news conference will be carried live on NASA Television and the agency’s website… you can tune in on NASA TV here. 

Image credits: NASA/Johns Hopkins University Applied Physics Laboratory/Carnegie Institution of Washington

NASA Satellite Sees Ghostly Remains of Vanishing Arctic Sea Ice

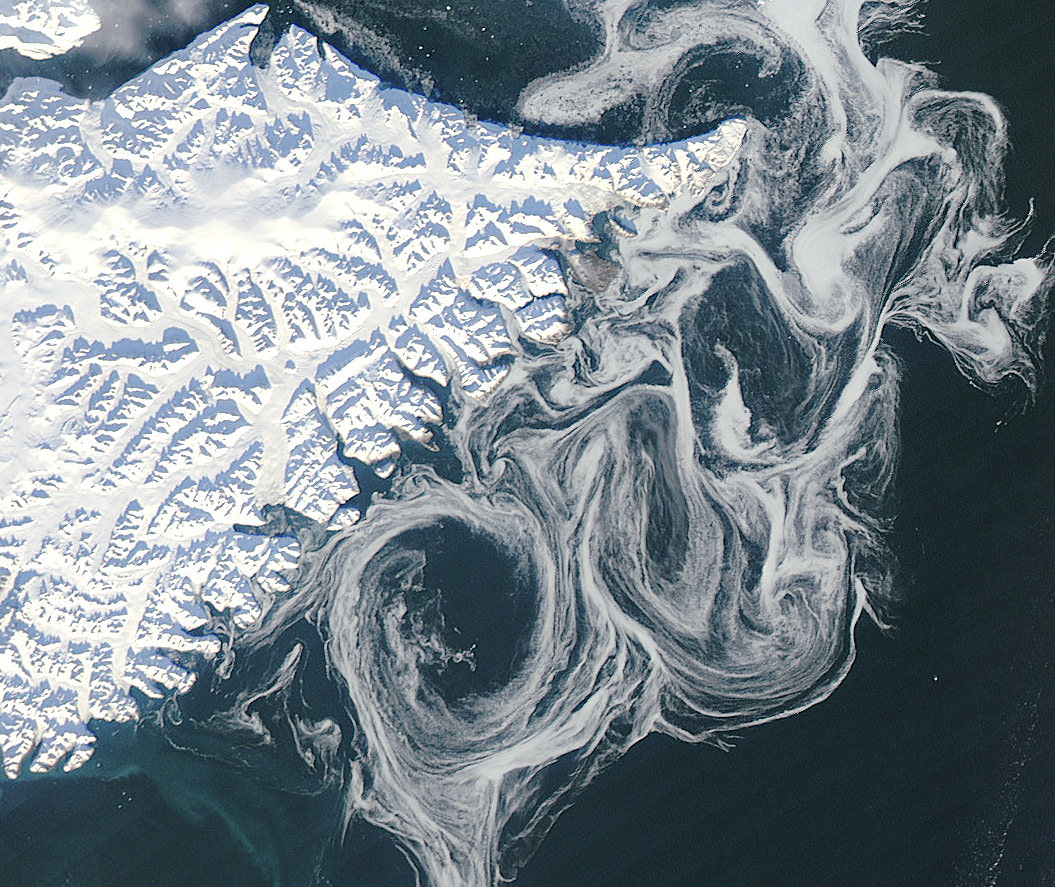
Sea ice swirls in ocean currents off the coast of Greenland (NASA/GSFC)

Spooky spectral swirls of last season’s sea ice drift in currents off the coast of eastern Greenland in this image from NASA’s Aqua satellite, acquired on October 17. Although sea ice in the Arctic will start forming again after September’s record low measurements, these ghostly wisps are likely made up of already-existing ice that has migrated south.

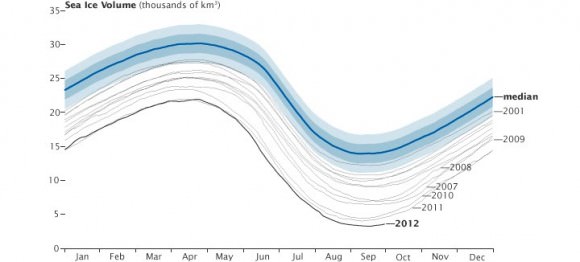
As global temperatures rise — both over land and in the ocean — thinner sea ice builds up during the Arctic winter and thus more of it melts during the summer, a pattern that will eventually lead to an ice-free Arctic if trends continue. The past several years saw sea ice in the Arctic below the 1979-2000 average, with this past September displaying the lowest volumes yet recorded.

The graph below, made from data modeled by the Polar Science Center at the University of Washington, show the chilling — or, perhaps, not-so-chilling — results of this century’s recent observations.

Along Greenland’s east coast, the Fram Strait serves as an expressway for sea ice moving out of the Arctic Ocean. The movement of ice through the strait used to be offset by the growth of ice in the Beaufort Gyre.

Until the late 1990s, ice would persist in the gyre for years, growing thicker and more resistant to melt. Since the start of the twenty-first century, however, ice has been less likely to survive its trip through the southern part of the Beaufort Gyre. As a result, less Arctic sea ice has been able to pile up and form multi-year ice.

Thin, free-drifting ice — as seen above — moves very easily with winds and currents.

Aqua is a NASA Earth Science satellite mission named for the large amount of information that the mission is collecting about the Earth’s water cycle, including evaporation from the oceans, water vapor in the atmosphere, clouds, precipitation, soil moisture, sea ice, land ice, and snow cover on the land and ice. Aqua was launched on May 4, 2002, and carries six Earth-observing instruments in a near-polar low-Earth orbit. MODIS, which acquired the image above, is a 36-band spectroradiometer that measures physical properties of the atmosphere, oceans and land.

Source: NASA Earth Observatory

NASA image courtesy Jeff Schmaltz, LANCE MODIS Rapid Response Team at NASA GSFC. Graph by Jesse Allen based on modeled ice volume data from the Polar Science Center, University of Washington. Caption portions by Michon Scott with information from Ted Scambos, National Snow and Ice Data Center.

Greenland Glacier Calves Another Huge Ice Island

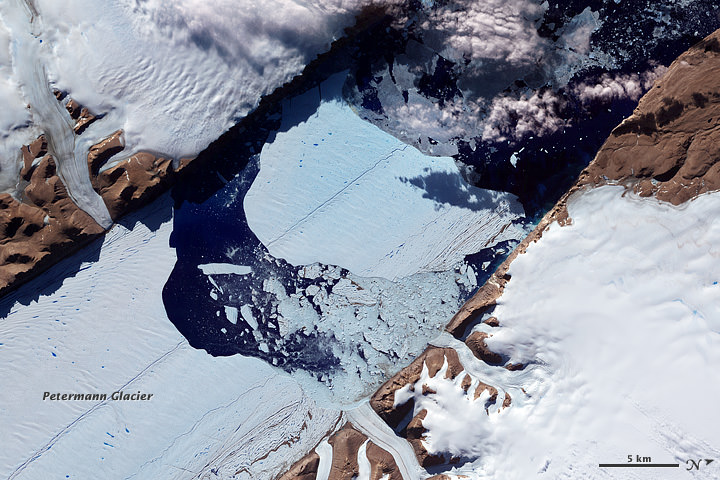
Petermann glacier, a 70 km (43 mile) long tongue of ice that flows into the Arctic Ocean in northwest Greenland, recently calved an “ice island” approximately 130 square kilometers (50 sq. miles) — about twice the area of Manhattan. The image above, acquired by NASA’s Terra satellite, shows the ice island as it drifts toward the ocean five days after breaking off the main glacier.

Petermann glacier has been known for birthing massive ice islands; previously in August 2010 an even larger island broke away from the glacier, measuring 251 square kilometers (97 sq. miles). That slab of ice eventually drifted into the northern Atlantic and was even visible from the Space Station a year later!

Read: Manhattan-Sized Ice Island Seen From Space

Although some of Greenland’s glaciers have been observed to be quickening their seaward pace as a result of global warming, this particular calving event — which occurred along a crack that appeared in 2001 satellite imagery — isn’t thought to be a direct result of climate but rather of ocean currents and isn’t expected to have any significant effect on the rate of Greenland’s ice loss as a whole. Still, satellite observation of such events provides valuable data for researchers monitoring the processes that are involved with rapidly accelerating Arctic ice loss.

And if you want an idea of what a slab of ice this large looks like up close, here’s a video taken by researchers on approach to a smaller chunk of the 2011 island:

NASA Earth Observatory image by Jesse Allen, using data from NASA/GSFC/METI/ERSDAC/JAROS, and U.S./Japan ASTER Science Team. (NASA/Terra)

Blue Marble 2012: The Arctic Edition

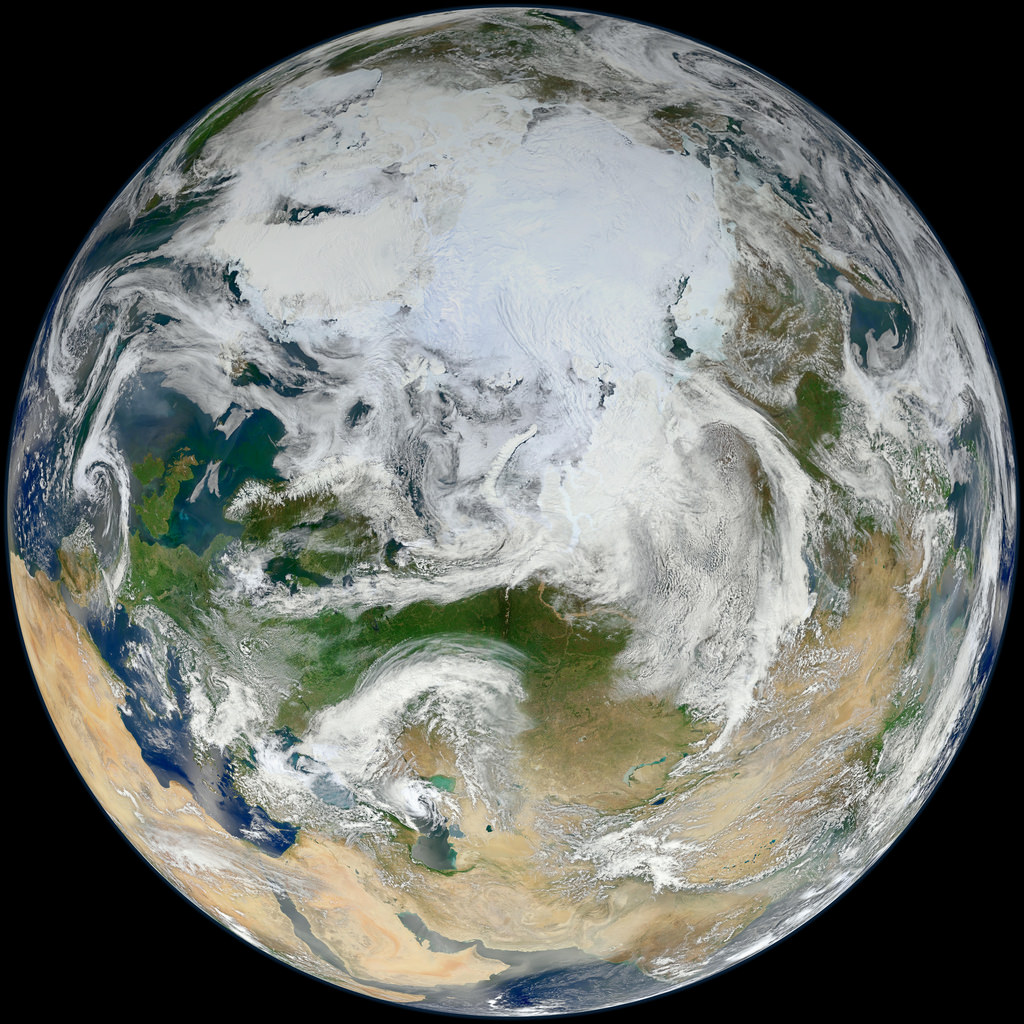
This latest portrait of Earth from NASA’s Suomi NPP satellite puts the icy Arctic in the center, showing the ice and clouds that cover our planet’s northern pole. The image you see here was created from data acquired during fifteen orbits of Earth.

In January of this year Suomi NPP images of Earth were used to create an amazing “Blue Marble” image that spread like wildfire across the internet, becoming one of the latest “definitive” images of our planet. Subsequent images have been released by the team at Goddard Space Flight Center, each revealing a different perspective of Earth.

See a full-sized version of the image above here.

NASA launched the National Polar-orbiting Operational Environmental Satellite System Preparatory Project (or NPP) on October 28, 2011 from Vandenberg Air Force Base. On Jan. 24, NPP was renamed Suomi National Polar-orbiting Partnership, or Suomi NPP, in honor of the late Verner E. Suomi. It’s the first satellite designed to collect data to improve short-term weather forecasts and increase understanding of long-term climate change.

Suomi NPP orbits the Earth about 14 times each day and observes nearly the entire surface of the planet.

Image credit: NASA/GSFC/Suomi NPP


Scientists Set Their Sights on Arctic Ice Loss

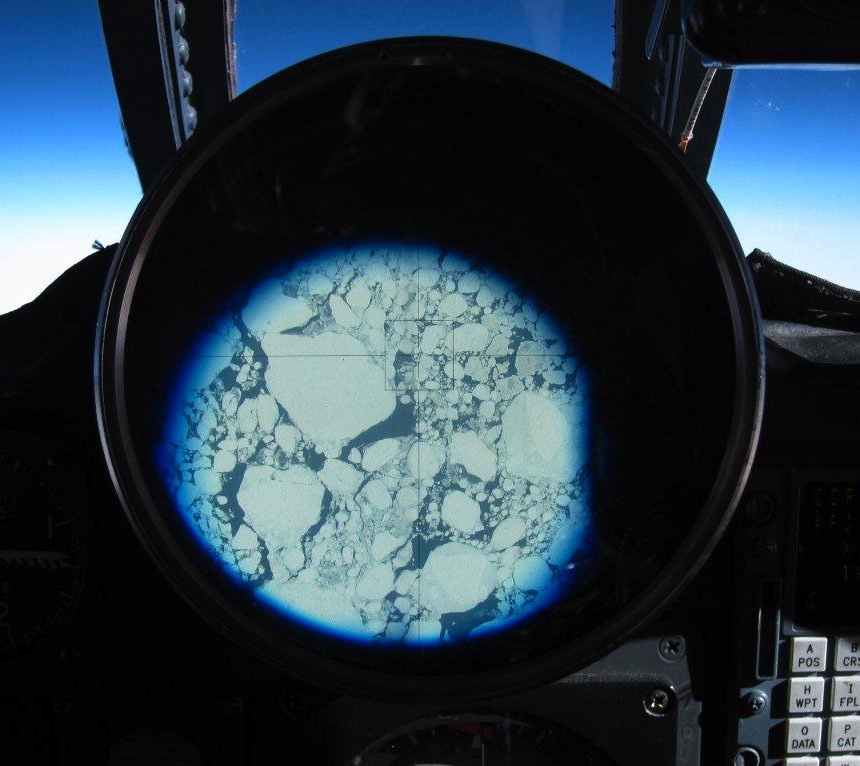
Greenland ice breakup seen from NASA ER-2 cockpit during a MABEL flight (NASA)

[/caption]

NASA researchers have just completed science mission flights over Greenland and the surrounding seas, gathering data on ice distribution and thickness with the MABEL (Multiple Altimeter Beam Experimental Lidar) laser altimeter instrument mounted in the nose of an ER-2 aircraft. WIth MABEL’s unprecedented ability to detect individual photons, researchers will be able to even more accurately determine how Arctic ice sheets are behaving in today’s changing climate.

At the same time, news has come in from researchers with the University of Washington, who have completed a NASA- and NSF-funded study of the enormous island’s glaciers spanning a ten-year period. What they have found is that the glaciers have been increasing in speed about 30% over the past ten years — which is actually less than earlier studies had anticipated.

“In some sense, this raises as many questions as it answers. It shows there’s a lot of variability,” said Ian Joughin, a glaciologist in the UW’s Applied Physics Laboratory and coauthor of the paper, published May 4 in Science.

Previous research had suggested that Greenland’s melting glaciers could contribute up to 19 inches to global sea level rise by 2100. But the behavior of Greenland’s vast ice fields and ocean-draining glaciers was not yet thoroughly researched. Based on this new study, the outlet glaciers have not sped up as much as expected.

Still, ocean-draining (a.k.a. marine-terminating) glaciers move much faster than their land-based counterparts, and the UW researchers have found that their speeds are increasing on average — up to 32% in some areas.

The team realizes that the study may just not have observed a long enough period of time. (These are glaciers, after all!)

Icebergs calve from the edge of Greenland's Gyldenlove glacier in April 2011. (NASA/GSFC/Michael Studinger)

“There’s the caveat that this 10-year time series is too short to really understand long-term behavior, so there still may be future events – tipping points – that could cause large increases in glacier speed to continue,” said Ian Howat, an assistant professor of earth sciences at Ohio State University and a co-author of the paper. “Or perhaps some of the big glaciers in the north of Greenland that haven’t yet exhibited any changes may begin to speed up, which would greatly increase the rate of sea level rise.”

What the researchers didn’t find was any evidence that the rate of flow is slowing down. Though the true extent of the effect of Greenland’s ice on future sea level rise may not be unerringly predictable down to the inch or centimeter, even at the currently observed rate a contribution of 4 or more inches by the end of the century is still very much a possibility.

Meanwhile, the data gathered from the MABEL science flights over the past four weeks will be used to calibrate NASA’s next-generation ice-observing satellite, IceSat-2, planned for launch in 2016. Once in orbit, IceSat-2 will provide even more detailed insight to the complex behavior of our planet’s ice sheets.

Read more on the UW News release here.

Enceladus On Display In Newest Images From Cassini

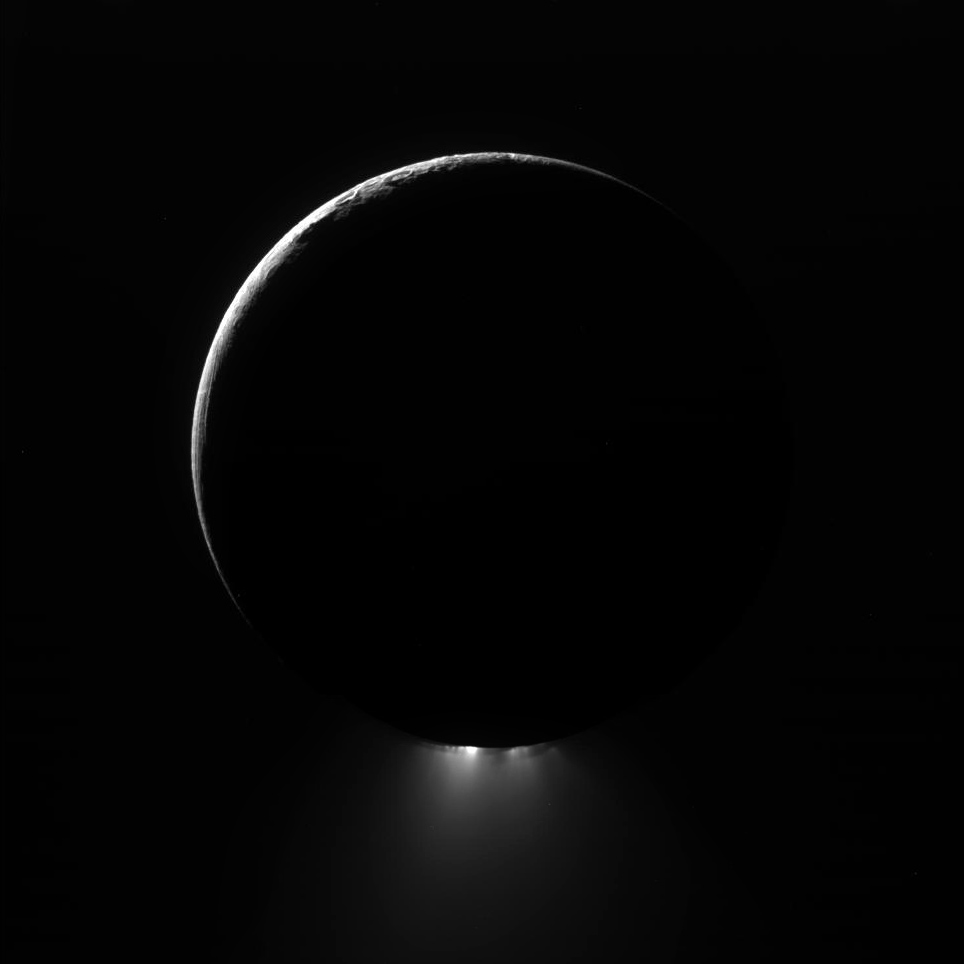
Enceladus' southern ice geysers are brilliant in backlit sunlight (NASA/JPL/SSI/J. Major)

[/caption]

The latest images are in from Saturn’s very own personal paparazzi, NASA’s Cassini spacecraft, fresh from its early morning flyby of the ice-spewing moon Enceladus. And, being its last closeup for the next three years, the little moon didn’t disappoint!

The image above is a composite I made from two raw images (this one and this one) assembled to show Enceladus in its crescent-lit entirety with jets in full force. The images were rotated to orient the moon’s southern pole — where the jets originate — toward the bottom.

Cassini was between 72,090 miles (116,000 km) and 90,000 miles (140,000 km) from Enceladus when these images were acquired.

This morning’s E-19 flyby completed a trio of recent close passes by Cassini of the 318-mile (511-km) -wide moon, bringing the spacecraft as low as 46 miles (74 km) above its frozen surface. The goal of the maneuver was to gather data about Enceladus’ internal mass — particularly in the region around its southern pole, where a reservoir of liquid water is thought to reside — and also to look for “hot spots” on its surface that would give more information about its overall energy distribution.

Cassini had previously discovered that Enceladus radiates a surprising amount of heat from its surface, mostly along the “tiger stripe” features — long, deep furrows (sulcae) that gouge its southern hemisphere, they are the source of the water-ice geysers.

Cassini also used the flyby opportunity to study Enceladus’ gravitational field.

By imaging the moon with backlit lighting from the Sun the highly-reflective ice particles in the jets become visible. More direct lighting reduces the jets’ visibility in images, which must be exposed for the natural light of the scene or risk “blowing out” due to Enceladus’ natural high reflectivity.

The images below are raw spacecraft downloads right from the Cassini’s imaging headquarters in Boulder, CO.

Enceladus' geysers in action on May 2, 2012. (NASA/JPL/SSI)
Enceladus sprays ice into the hazy E ring, which orbits Saturn (NASA/JPL/SSI)

Cassini also swung closely by Dione during this morning’s flyby but the images from that encounter aren’t available yet. Stay tuned to Universe Today for more postcards from Saturn!

As always, you can follow along with the ongoing Cassini mission on JPL’s dedicated site here, as well as on the Cassini Imaging Central Laboratory for Operations (CICLOPS) site.

Antarctica’s Ice Being Eaten Away From Below

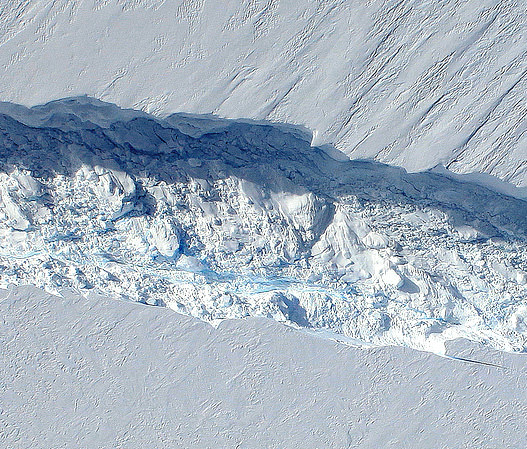
The 820-foot-wide crack in Antarctica's Pine Island Glacier, seen from DC-8 during Operation IceBridge (Credit: NASA/DMS)


Data collected from a NASA ice-watching satellite reveal that the vast ice shelves extending from the shores of  western Antarctica are being eaten away from underneath by ocean currents, which have been growing warmer even faster than the air above.

The animation above shows the circulation of ocean currents around the western Antarctic ice shelves. The shelf thickness is indicated by the color; red is thicker (greater than 550 meters), while blue is thinner (less than 200 meters).

Launched in January 2003, NASA’s ICESat (Ice, Cloud and land Elevation Satellite) studied the changing mass and thickness of Antarctica’s ice from its location in polar orbit. An international research team used over 4.5 million surface height measurements collected by ICESat’s GLAS (Geoscience Laser Altimeter System) instrument from Oct. 2005 to 2008. They concluded that 20 of the 54 shelves studied — nearly half — were losing thickness from underneath.

[/caption]

Most of the melting ice shelves are located in west Antarctica, where the flow of inland glaciers to the sea has also been accelerating — an effect that can be compounded by thinning ice shelves which, when grounded to the offshore seabed, serve as dams to hold glaciers back.

Melting of ice by ocean currents can occur even when air temperature remains cold, maintaining a steady process of ice loss — and eventually increased sea level rise.

“We can lose an awful lot of ice to the sea without ever having summers warm enough to make the snow on top of the glaciers melt,” said Hamish Pritchard of the British Antarctic Survey in Cambridge and the study’s lead author . “The oceans can do all the work from below.”

The study also found that Antarctica’s winds are shifting in response to climate change.

“This has affected the strength and direction of ocean currents,” Pritchard said. “As a result warm water is funnelled beneath the floating ice. These studies and our new results suggest Antarctica’s glaciers are responding rapidly to a changing climate.”

ICESat completed operations in 2010 and was decommissioned in August of that year. Its successor ICESat-2 is anticipated to launch in 2016.

Read more on NASA’s news release here.

Animation credit: NASA/Goddard CGI Lab