How Do Planets Form? Semarkona Meteorite Shows Some Clues

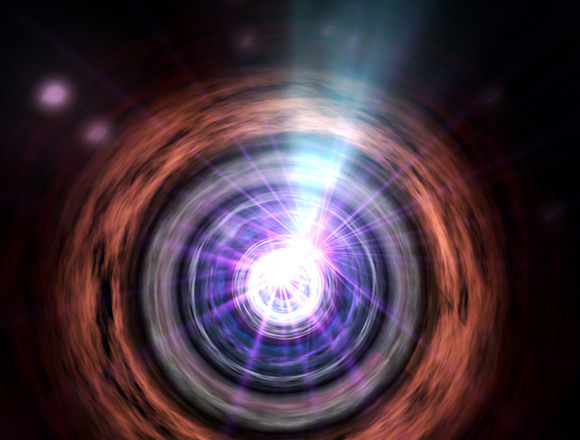
Artist’s impression of a baby star still surrounded by a protoplanetary disc in which planets are forming. Credit: ESO

It may seem all but impossible to determine how the Solar System formed, given that it happened roughly 4.5 billion years ago. Luckily, much of the debris that was left over from the formation process is still available today for study, circling our Solar System in the form of rocks and debris that sometimes make their way to Earth.

Among the most useful pieces of debris are the oldest and least altered type of meteorites, which are known as chondrites. They are built mostly of small stony grains, called chondrules, that are barely a millimeter in diameter.

And now, scientists are being provided with important clues as to how the early Solar System evolved, thanks to new research based on the the most accurate laboratory measurements ever made of the magnetic fields trapped within these tiny grains.

To break it down, chondrite meteorites are pieces of asteroids — broken off by collisions — that have remained relatively unmodified since they formed during the birth of the Solar System. The chondrules they contain were formed when patches of solar nebula – dust clouds that surround young suns – was heated above the melting point of rock for hours or even days.

The dust caught in these “melting events” was melted down into droplets of molten rock, which then cooled and crystallized into chondrules. As chondrules cooled, iron-bearing minerals within them became magnetized by the local magnetic field in the gas cloud. These magnetic fields are preserved in the chondrules right on up to the present day.

A slice of the NWA 5205 meteorite from the Sahara Desert displays wall-to-wall chondrules. Credit: Bob King

The chondrule grains whose magnetic fields were mapped in the new study came from a meteorite named Semarkona – named after the town in India where it fell in 1940.

Roger Fu of MIT – working under Benjamin Weiss – was the chief author of the study; with Steve Desch of Arizona State University’s School of Earth and Space Exploration attached as co-author.

According to the study, which was published this week in Science, the measurements they collected point to shock waves traveling through the cloud of dusty gas around the newborn sun as a major factor in solar system formation.

“The measurements made by Fu and Weiss are astounding and unprecedented,” says Steve Desch. “Not only have they measured tiny magnetic fields thousands of times weaker than a compass feels, they have mapped the magnetic fields’ variation recorded by the meteorite, millimeter by millimeter.”

The scientists focused specifically on the embedded magnetic fields captured by “dusty” olivine grains that contain abundant iron-bearing minerals. These had a magnetic field of about 54 microtesla, similar to the magnetic field at Earth’s surface (which ranges from 25 to 65 microtesla).

Coincidentally, many previous measurements of meteorites also implied similar field strengths. But it is now understood that those measurements detected magnetic minerals that were contaminated by the Earth’s own magnetic field, or even from the hand magnets used by the meteorite collectors.
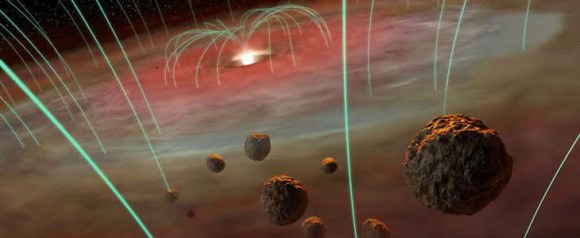
Artist depiction of a protoplanetary disk permeated by magnetic fields. Objects in the foregrounds are millimeter-sized rock pellets known as chondrules.  Credit: Hernán Cañellas
Artist depiction of a protoplanetary disk permeated by magnetic fields. Objects in the foregrounds are millimeter-sized rock pellets known as chondrules.
Credit: Hernán Cañellas

“The new experiments,” Desch says, “probe magnetic minerals in chondrules never measured before. They also show that each chondrule is magnetized like a little bar magnet, but with ‘north’ pointing in random directions.”

This shows, he says, that they became magnetized before they were built into the meteorite, and not while sitting on Earth’s surface. This observation, combined with the presence of shock waves during early solar formation, paints an interesting picture of the early history of our Solar System.

“My modeling for the heating events shows that shock waves passing through the solar nebula is what melted most chondrules,” Desch explains. Depending on the strength and size of the shock wave, the background magnetic field could be amplified by up to 30 times. “Given the measured magnetic field strength of about 54 microtesla,” he added, “this shows the background field in the nebula was probably in the range of 5 to 50 microtesla.”

There are other ideas for how chondrules might have formed, some involving magnetic flares above the solar nebula, or passage through the sun’s magnetic field. But those mechanisms require stronger magnetic fields than what has been measured in the Semarkona samples.

This reinforces the idea that shocks melted the chondrules in the solar nebula at about the location of today’s asteroid belt, which lies some two to four times farther from the sun than the Earth’s orbits.

Desch says, “This is the first really accurate and reliable measurement of the magnetic field in the gas from which our planets formed.”

Further Reading: ASU

Detecting the Magnetic Fields of Exoplanets May Help Determine Habitability

An artist's conception of two magnetic fields interacting in a bow shock. Image credit: NASA

Astronomers may soon be able to observe the shockwaves between the magnetic fields of exoplanets and the flow of particles from the stars they orbit.

Magnetic fields are crucial to a planet’s (and as it turns out a moon’s) habitability. They act as protective bubbles, preventing harmful space radiation from stripping away the object’s atmosphere entirely and even reaching the surface.

An extended magnetic field – known as a planetary magnetosphere – is created by the shock between the stellar wind and the intrinsic magnetic field of the planet. It has the potential to be huge. Within our own Solar System, Jupiter’s magnetosphere extends to distances up to 50 times the size of the planet itself, nearly reaching Saturn’s orbit.

When the wind of high-energy particles from the star hits the planetary magnetosphere, it interacts in a bow shock that diverts the wind and compresses the magnetosphere.

Recently a team of astronomers, led by PhD student Joe Llama of the University of St. Andrews, Scotland, have worked out how we might observe planetary magnetospheres and stellar winds via their bow shocks.

Llama took a careful look at the planet HD 189733b, located 63 light years away toward the constellation Vulpecula. From the Earth, the planet is seen to transit its host star every 2.2 days, causing a dip in the overall light from the system.

As a bright star, HD 189733b has been studied extensively by astronomers.  Data collected in July 2008 by the Canada-France-Hawaii telescope mapped the star’s magnetic field. While the magnetic field varied, it was on average 30 times greater than that of our Sun – meaning that the stellar wind is much higher than the solar wind.

This allowed the team to carry out extensive simulations of the stellar wind around HD 189733b – characterizing the bow shock created as the planet’s magnetosphere passes through the stellar wind.  With this information they were able to simulate the light curves that would result from the planet and the bow shock orbiting the star.

The bow shock leads the planet – causing the light to drop a little earlier than expected.  The amount of light blocked by the bow shock, however, will change as the planet moves through a variable stellar wind. If the stellar wind is particularly strong, the resulting bow shock will be strong, and the transit depth will be greater. If the stellar wind is weak, the resulting bow shock will be weak, and the transit depth will be less.

The video below shows the light curve of a bow shock and exoplanet.

“We found that the shockwave between the stellar and planetary magnetic fields will change drastically as activity on the star varies,” Llama told Universe Today. “As the planet passes through very dense regions of the stellar wind, so the shock will become denser, the material in it will block more light and therefore cause a larger dip in the transit making it more detectable.”

While there were no transit observations for this study, this theoretical outlook demonstrates that it will be possible to detect the bow shock, and therefore the magnetic field, of a distant exoplanet. Dr. Llama comments: “This will help us to better identify potentially habitable worlds.”

The paper has been accepted for publication in Monthly Notices of  The Royal Astronomical Society and is available for download here.


The Milky Way’s Magnetic Personality

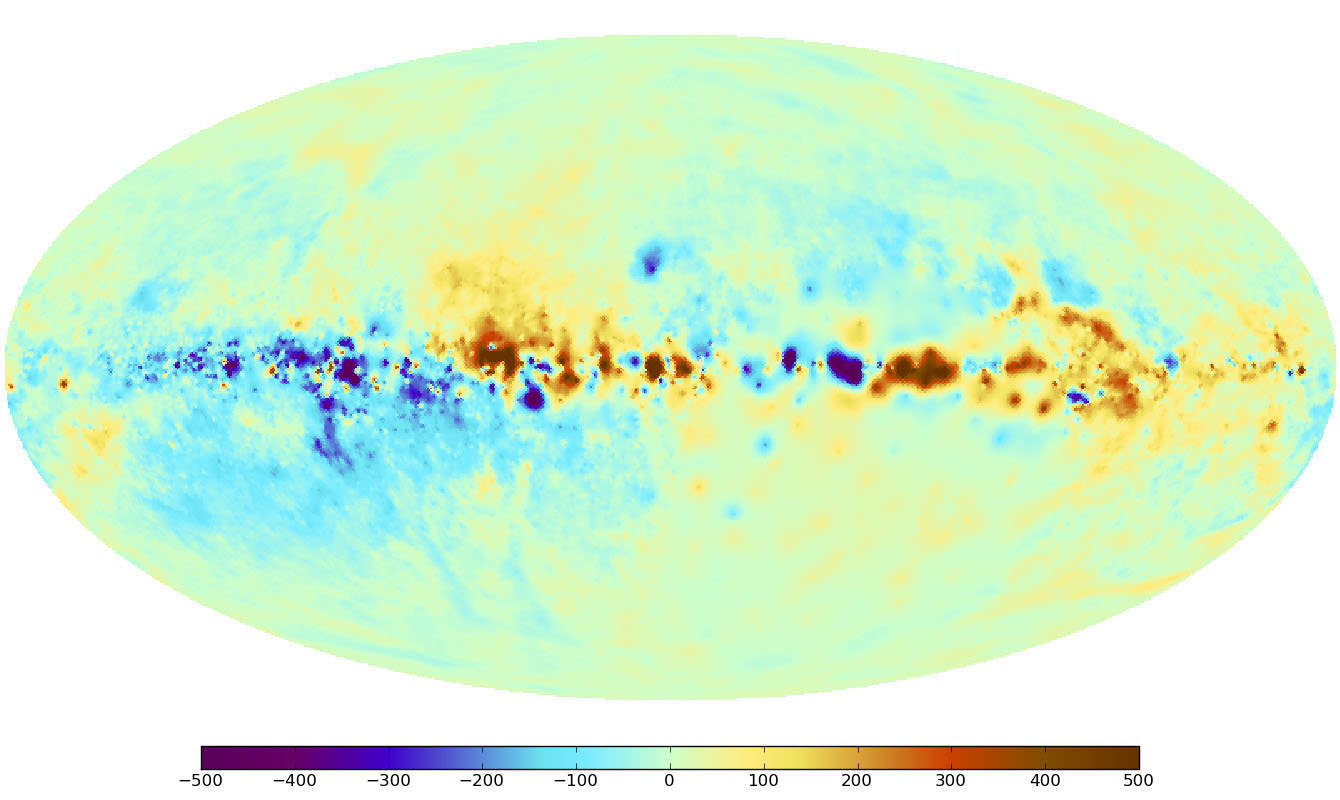
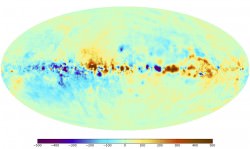
The sky map of the Faraday effect caused by the magnetic fields of the Milky Way. Red and blue colors indicate regions of the sky where the magnetic field points toward and away from the observer, respectively. The band of the Milky Way (the plane of the Galactic disk) extends horizontally in this panoramic view. The center of the Milky Way lies in the middle of the image. The North celestial pole is at the top left and the South Pole is at the bottom right. (Image Credit: Max Planck Institute for Astrophysics)

[/caption]

Recently we took a look at a very unusual type of map – the Faraday Sky. Now an international team of scientists, including those at the Naval Research Laboratory, have pooled their information and created one of the most high precision maps to date of the Milky Way’s magnetic fields. Like all galaxies, ours has a magnetic “personality”, but just where these fields come from and how they are created is a genuine mystery. Researchers have always simply assumed they were created by mechanical processes like those which occur in Earth’s interior and the Sun. Now a new study will give scientists an even better understanding about the structure of galactic magnetic fields as seen throughout our galaxy.

The team, led by the Max Planck Institute for Astrophysics (MPA), gathered their information and compiled it with theoretical simulations to create yet another detailed map of the magnetic sky. As NRL’s Dr. Tracy Clarke, a member of the research team explains, “The key to applying these new techniques is that this project brings together over 30 researchers with 26 different projects and more than 41,000 measurements across the sky. The resulting database is equivalent to peppering the entire sky with sources separated by an angular distance of two full moons.” This huge amount of data provides a new “all-sky” look which will enable scientists to measure the magnetic structure of the Milky Way in minute detail.

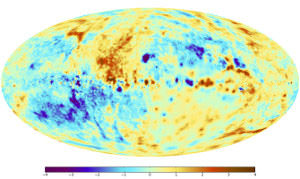
In this map of the sky, a correction for the effect of the Galactic disk has been made in order to emphasize weaker magnetic field structures. The magnetic field directions above and below the disk seem to be diametrically opposed, as indicated by the positive (red) and negative (blue) values. An analogous change of direction takes place across the vertical center line, which runs through the center of the Milky Way. (Image Credit: Max Planck Institute for Astrophysics)
Just what’s so “new” about this map? This time we’re looking at a quantity called Faraday depth – an idea dependent on a line-of-sight information set on the magnetic fields. It was created by combining more than 41,000 singular measurements which were then combined using a new image reconstruction method. In this case, all the researchers at MPA are specialists in the new discipline of information field theory. Dr. Tracy Clarke, working in NRL’s Remote Sensing Division, is part of the team of international radio astronomers who provided the radio observations for the database. It’s magnetism on a grand scale… and imparts even the smallest of magnetic features which will enable scientists to further understand the nature of galactic gas turbulence.

The concept of the Faraday effect isn’t new. Scientists have been observing and measuring these fields for the last century and a half. Just how is it done? When polarized light passes through a magnetized medium, the plane of the polarization flips… a process known as Faraday rotation. The amount of rotation shows the direction and strength of the field and thereby its properties. Polarized light is also generated from radio sources. By using different frequencies, the Faraday rotation can also be measured in this alternative way. By combining all of these unique measurements, researchers can acquire information about a single path through the Milky Way. To further enhance the “big picture”, information must be gathered from a variety of sources – a need filled by 26 different observing projects that netted a total of 41,330 individual measurements. To give you a clue of the size, that ends up being about one radio source per square degree of sky!

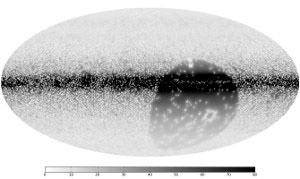
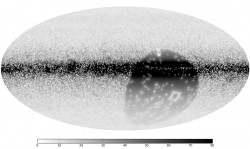
The uncertainty in the Faraday map. Note that the range of values is significantly smaller than in the Faraday map (Fig. 1). In the area of the celestial south pole, the measurement uncertainties are particularly high because of the low density of data points. (Image Credit: Max Planck Institute for Astrophysics)
Even with depth like this, there are still areas in the southern sky where only a few measurements have been cataloged. To fill in the gaps and give a more realistic view, researchers “have to interpolate between the existing data points that they have recorded.” However, this type of data causes some problems with accuracy. While you might think the more exact measurements would have the greatest impact on the map, scientists aren’t quite sure how reliable any single measurement could be – especially when they could be influenced by the environment around them. In this case, the most accurate measurements don’t always rank the highest in mapping points. Like Heisenberg, there’s an uncertainty associated with the process of obtaining measurements because the process is so complex. Just one small mistake could lead to a huge distortion in the map’s contents.

Thanks to an algorithm crafted by the MPA, scientists are able to face these types of difficulties with confidence as they put together the images. The algorithm, called the “extended critical filter,” employs tools from new disciplines known as information field theory – a logical and statistical method applied to fields. So far it has proven to be an effective method of weeding out errors and has even proven itself to be an asset to other scientific fields such as medicine or geography for a range of image and signal-processing applications.

Even though this new map is a great assistant for studying our own galaxy, it will help pave the way for researchers studying extragalactic magnetic fields as well. As the future provides new types of radio telescopes such as LOFAR, eVLA, ASKAP, MeerKAT and the SKA , the map will be a major resource of measurements of the Faraday effect – allowing scientists to update the image and further our understanding of the origin of galactic magnetic fields.

Original Story Source: Naval Research Laboratory News.

Mapping The Milky Way’s Magnetic Fields – The Faraday Sky

Fig. 3: In this map of the sky, a correction for the effect of the galactic disk has been made in order to emphasize weaker magnetic field structures. The magnetic field directions above and below the disk seem to be diametrically opposed, as indicated by the positive (red) and negative (blue) values. An analogous change of direction takes place accross the vertical center line, which runs through the center of the Milky Way.

[/caption]

Kudos to the scientists at the Max Planck Institut and an international team of radio astronomers for an incredibly detailed new map of our galaxy’s magnetic fields! This unique all-sky map has surpassed its predecessors and is giving us insight into the magnetic field structure of the Milky Way beyond anything so far seen. What’s so special about this one? It’s showing us a quality known as Faraday depth – a concept which works along a specific line of sight. To construct the map, data was melded from 41,000 measurements collected from a new image reconstruction technique. We can now see not only the major structure of galactic fields, but less obvious features like turbulence in galactic gas.

So, exactly what does a new map of this kind mean? All galaxies possess magnetic fields, but their source is a mystery. As of now, we can only guess they occur due to dynamo processes… where mechanical energy is transformed into magnetic energy. This type of creation is perfectly normal and happens here on Earth, the Sun, and even on a smaller scale like a hand-crank powered radio – or a Faraday flashlight! By showing us where magnetic field structures occur in the Milky Way, we can get a better understanding of galactic dynamos.

Fig. 1: The sky map of the Faraday effect caused by the magnetic fields of the Milky Way. Red and blue colors indicate regions of the sky where the magnetic field points toward and away from the observer, respectively. The band of the Milky Way (the plane of the galactic disk) extends horizontally in this panoramic view. The center of the Milky Way lies in the middle of the image. The North celestial pole is at the top left and the South Pole is at the bottom right.
For the last century and a half, we’ve known about Faraday rotation and scientists use it to measure cosmic magnetic fields. This action happens when polarized light goes through a magnetized medium and the plane of polarization revolves. The amount of turn is dependent on the strength and direction of the magnetic field. By observation of the rotation we can further understand the properties of the intervening magnetic fields. Radio astronomers gather and examine the polarized light from distant radio sources passing through our galaxy on its way to us. The Faraday effect can then be judged by measuring the source polarization at various frequencies. However, these measurements can only tell us about the one path through the Milky Way. To see things as a whole, one needs to know how many sources are scattered over the visible sky. This is where the international group of radio astronomers played an important role. They proved data from 26 different projects which gave a grand total of 41,300 pinpoint sources – at an average of about one radio source per square degree of sky.

Although that sounds like a wealth of information, it’s still not really enough. There are huge areas, particularly in the southern sky, where only a few measurements exist. Because of this lack of data, we have to interpolate between existing data points and that creates its own problems. First, the accuracy varies and more precise measurements should help. Also, astronomers are not exactly sure of how reliable a single measurement can be – they just have to take their best guess based on what information they have. Still, other problems exist. There are measurement uncertainties due to the complex nature of the process. A small error can increase by tenfold and this could convolute the map if not corrected. To help fix these problems, scientists at MPA developed a new algorithm for image capture, named the “extended critical filter”. In its creation, the team utilizes tools provided by the new discipline known as information field theory – a powerful tool that blends logical and statistical methods to applied fields and stacks it up against inaccurate information. This new work is exciting because it can also be applied to other imaging and signal-processing venues in alternate scientific fields.

Fig. 2: The uncertainty in the Faraday map. Note that the range of values is significantly smaller than in the Faraday map (Fig. 1). In the area of the celestial south pole, the measurement uncertainties are particularly high because of the low density of data points.
“In addition to the detailed Faraday depth map (Fig. 1), the algorithm provides a map of the uncertainties (Fig. 2). Especially in the galactic disk and in the less well-observed region around the south celestial pole (bottom right quadrant), the uncertainties are significantly larger.” says the team. “To better emphasize the structures in the galactic magnetic field, in Figure 3 (above) the effect of the galactic disk has been removed so that weaker features above and below the galactic disk are more visible. This reveals not only the conspicuous horizontal band of the gas disk of our Milky Way in the middle of the picture, but also that the magnetic field directions seem to be opposite above and below the disk. An analogous change of direction also takes place between the left and right sides of the image, from one side of the center of the Milky Way to the other.”

The good news is the galactic dynamo theory seems to be spot on. It has predicted symmetrical structures and the new map reflects it. In this projection, the magnetic fields are lined up parallel to the plane of the galactic disc in a spiral. This direction is opposite above and below the disc and the observed symmetries in the Faraday map arise from our location within the galactic disc. Here we see both large and small structures tied in with the turbulent, dynamic Milky Way gas structures. This new map algorithm has a great side-line, too… it characterizes the size distribution of these structures. Larger ones are more definitive than smaller ones, which is normal for turbulent systems. This spectrum can then be stacked against computer models of dynamics – allowing for intricate testing of the galactic dynamo models.

This incredible new map is more than just another pretty face in astronomy. By providing information of extragalactic magnetic fields, we’re enabling radio telescope projects such as LOFAR, eVLA, ASKAP, Meerkat and the SKA to rise to new heights. With this will come even more updates to the Faraday Sky and reveal the mystery of the origin of galactic magnetic fields.

Original Story Source: Max Planck Institut for Astrophysics News Release. For Further Reading: An improved map of the galactic Faraday sky”. Download the map HERE.

Astronomy Without A Telescope – Cosmic Magnetic Fields

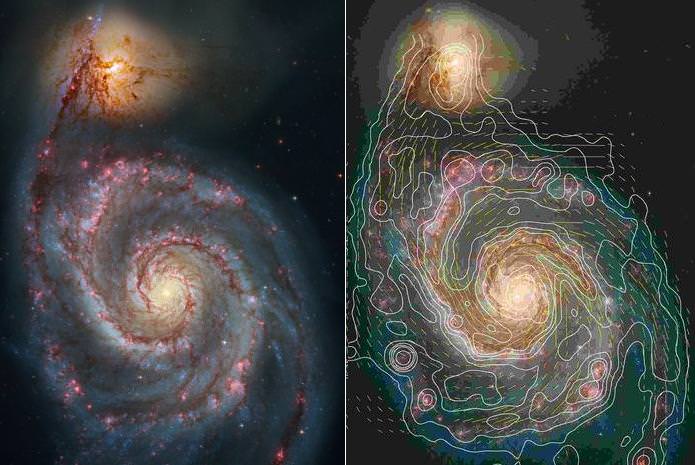
The whirlpool galaxy with its magnetic field mapped by observing how distant radio light from pulsars is altered as it passes through the galaxy. Credit: MPIfR Bonn.

[/caption]

The mention of cosmic-scale magnetic fields is still likely to met with an uncomfortable silence in some astronomical circles – and after a bit of foot-shuffling and throat-clearing, the discussion will be moved on to safer topics. But look, they’re out there. They probably do play a role in galaxy evolution, if not galaxy formation – and are certainly a feature of the interstellar medium and the intergalactic medium.

It is expected that the next generation of radio telescopes, such as LOFAR (Low Frequency Array) and the SKA (Square Kilometre Array), will make it possible to map these fields in unprecedented detail – so even if it turns out that cosmic magnetic fields only play a trivial role in large-scale cosmology – it’s at least worth having a look.

At the stellar level, magnetic fields play a key role in star formation, by enabling a protostar to unload angular momentum. Essentially, the protostar’s spin is slowed by magnetic drag against the surrounding accretion disk – which allows the protostar to keep drawing in more mass without spinning itself apart.

At the galactic level, accretion disks around stellar-sized black holes create jets that inject hot ionised material into the interstellar medium – while central supermassive black holes may create jets that inject such material into the intergalactic medium.

Within galaxies, ‘seed’ magnetic fields may arise from the turbulent flow of ionised material, perhaps further stirred up by supernova explosions. In disk galaxies, such seed fields may then be further amplified by a dynamo effect arising from being drawn into the rotational flow of the whole galaxy. Such galactic scale magnetic fields are often seen forming spiral patterns across a disk galaxy, as well as showing some vertical structure within a galactic halo.

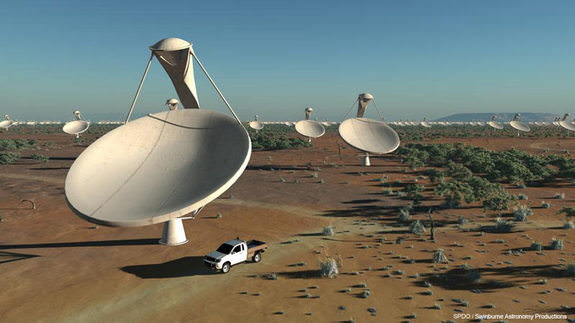
It is anticipated that next generation radio telescopes like the Square Kilometre Array will significantly enhance cosmic magnetic field research. Credit Swinburne AP.

Similar seed fields may arise in the intergalactic medium – or at least the intracluster medium. It’s not clear whether the great voids between galactic clusters would contain a sufficient density of charged particles to generate significant magnetic fields.

Seed fields in the intracluster medium might be amplified by a degree of turbulent flow driven by supermassive black hole jets but, in the absence of more data, we might assume that such fields maybe more diffuse and disorganised that those seen within galaxies.

The strength of intracluster magnetic fields averages around 3 x 10⁻⁶ gauss (G), which isn’t a lot. The Earth’s magnetic fields averages around 0.5 G and a refrigerator magnet is about 50 G. Nonetheless, these intracluster fields offer the opportunity to trace back past interactions between galaxies or clusters (e.g. collisions or mergers) – and perhaps to determine what role magnetic fields played in the early universe, particularly with respect to the formation of the first stars and galaxies.

Magnetic fields can be indirectly identified through a variety of phenomena:
• Optical light is partly polarised by the presence of dust grains which are drawn into a particular orientation by a magnetic field and then only let through light in a certain plane.
• At a larger scale, Faraday rotation comes into play, where the plane of already polarised light is rotated in the presence of a magnetic field.
• There’s also Zeeman splitting, where spectral lines – which normally identify the presence of elements such as hydrogen – may become split in light that has passed through a magnetic field.

Wide angle or all-sky surveys of synchrotron radiation sources (e.g. pulsars and blazars) allow measurement of a grid of data points, which may undergo Faraday rotation as a result of magnetic fields at the intergalactic or intracluster scale. It is anticipated the high resolution offered by the SKA will enable observations of magnetic fields in the early universe back to a redshift of about z =5, which gives you a view of the universe as it was about 12 billion years ago.

Further reading: Beck, R. Cosmic Magnetic Fields: Observations and Prospects.

A New Class for Tau Scorpii

Many classes of stars are named for an early, distinguished member of a certain type of stars. For example, Cepheid variables take their namesake from the periodic variable Delta Cephei, first recognized by John Goodricke, although Eta Aquillae, another Cepheid, was recognized as a periodic variable with the same period just before Delta Cephei. Since the time of Goodricke’s discovery, many more classes of objects have been discovered from T Tauri, to W Ursa Majoris, to Delta Scorpii.

But sometimes, stars must wait before more members of their class are discovered. Tau Scorpiiis a massive B0 star and one of the rare high mass stars for which magnetic fields have been measured. To distinguish it even further, studies have shown that its magnetic field is unusually complex, being much more tangled than most stars and not showing distinct dipoles. Additionally, this unusual star has been shown to have weaker stellar winds (and consequently, mass loss rates) than most B0 type stars, as well as spectral features that are simultaneously characteristic of stars on the main sequence and young giants. Meanwhile, the star is believed to be only a few million years old. A first step towards characterizing such odd objects is to find more. Fortunately, astronomers have discovered two more stars similar to Tau Scorpii.

The two new stars, HD 66665 and HD 63425, were first recognized as unusual from their spectra, taken by the Canada-France-Hawaii Telescope. Using these spectra, the team, led by Véronique Petit at West Chester University, recognized that these stars had the same peculiar winds as Tau Scorpii. While Petit’s group could not completely constrain the mass loss rates, they did place an upper limit on both, establishing that they too shared the “weak wind problem” in which the expected mass loss rate for such stars was roughly 20 times higher. This prompted the team to investigate each star for magnetic fields.

Although the team wasn’t able to fully analyze the magnetic fields during their observing run to determine just how unusual they were, the team did establish both stars did have magnetic fields present and that they were similar in strength to that of Tau Scorpii. These two pieces of information has led the team to conclude that HD 66665 and HD 63425, along with Tau Scorpii, constitute a new class of stars. Additional confirmation could come from similar conclusions on the age of the analogues.

Petit’s team doesn’t speculate as to the nature of this emerging class in this paper. However, an earlier work of which Petit was a co-author, examined Tau Scorpii specifically. In it, the team examined whether the unusual field was a “frozen in” fossil from formation, or actively produced by an unusual dynamo inside the star. Fields produced by dynamos require large portions of the interior of the star undergoing convection. Models of massive stars predict that convection is likely to be limited in such stars. Another key component is rotation. Tau Scorpii is an extremely slow rotator, so the team concluded that a dynamo is unlikely in this case. As such, the fossil-field theory was more likely. Further investigation of HD 66665 and HD 63425 will certainly be necessary to further compare these stars to Tau Scorpii.

Magnetic Fields in Inter-cluster Space: Measured at Last

How Does Light Travel?

[/caption]
The strength of the magnetic fields here on Earth, on the Sun, in inter-planetary space, on stars in our galaxy (the Milky Way; some of them anyway), in the interstellar medium (ISM) in our galaxy, and in the ISM of other spiral galaxies (some of them anyway) have been measured. But there have been no measurements of the strength of magnetic fields in the space between galaxies (and between clusters of galaxies; the IGM and ICM).

Up till now.

But who cares? What scientific importance does the strength of the IGM and ICM magnetic fields have?

The Large Area Telescope (LAT) on Fermi detects gamma-rays through matter (electrons) and antimatter (positrons) they produce after striking layers of tungsten. Credit: NASA/Goddard Space Flight Center Conceptual Image Lab

Estimates of these fields may provide “a clue that there was some fundamental process in the intergalactic medium that made magnetic fields,” says Ellen Zweibel, a theoretical astrophysicist at the University of Wisconsin, Madison. One “top-down” idea is that all of space was somehow left with a slight magnetic field soon after the Big Bang – around the end of inflation, Big Bang Nucleosynthesis, or decoupling of baryonic matter and radiation – and this field grew in strength as stars and galaxies amassed and amplified its intensity. Another, “bottom-up” possibility is that magnetic fields formed initially by the motion of plasma in small objects in the primordial universe, such as stars, and then propagated outward into space.

So how do you estimate the strength of a magnetic field, tens or hundreds of millions of light-years away, in regions of space a looong way from any galaxies (much less clusters of galaxies)? And how do you do this when you expect these fields to be much less than a nanoGauss (nG), perhaps as small as a femtoGauss (fG, which is a millionth of a nanoGauss)? What trick can you use??

A very neat one, one that relies on physics not directly tested in any laboratory, here on Earth, and unlikely to be so tested during the lifetime of anyone reading this today – the production of positron-electron pairs when a high energy gamma ray photon collides with an infrared or microwave one (this can’t be tested in any laboratory, today, because we can’t make gamma rays of sufficiently high energy, and even if we could, they’d collide so rarely with infrared light or microwaves we’d have to wait centuries to see such a pair produced). But blazars produce copious quantities of TeV gamma rays, and in intergalactic space microwave photons are plentiful (that’s what the cosmic microwave background – CMB – is!), and so too are far infrared ones.

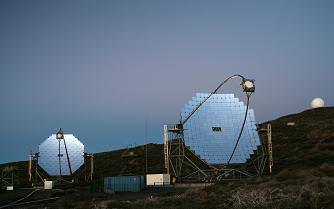
MAGIC telescope (Credit: Robert Wagner)

Having been produced, the positron and electron will interact with the CMB, local magnetic fields, other electrons and positrons, etc (the details are rather messy, but were basically worked out some time ago), with the net result that observations of distant, bright sources of TeV gamma rays can set lower limits on the strength of the IGM and ICM through which they travel. Several recent papers report results of such observations, using the Fermi Gamma-Ray Space Telescope, and the MAGIC telescope.

So how strong are these magnetic fields? The various papers give different numbers, from greater than a few tenths of a femtoGauss to greater than a few femtoGauss.

“The fact that they’ve put a lower bound on magnetic fields far out in intergalactic space, not associated with any galaxy or clusters, suggests that there really was some process that acted on very wide scales throughout the universe,” Zweibel says. And that process would have occurred in the early universe, not long after the Big Bang. “These magnetic fields could not have formed recently and would have to have formed in the primordial universe,” says Ruth Durrer, a theoretical physicist at the University of Geneva.

So, perhaps we have yet one more window into the physics of the early universe; hooray!

Sources: Science News, arXiv:1004.1093, arXiv:1003.3884