[/caption]
The miniature radio frequency (min-RF) radar instrument aboard the Lunar Reconnaissance Orbiter (LRO) is revealing some interesting things about how impact melts form around craters on the Moon. Impacts produce a crater, ejecta (pulverized rock that is thrown around the crater), and melt. A lot is known about craters and ejecta, because they form such spectacular features on the planetary surfaces. But melt is a fairly minor component of the impact process, and so is not as easily observed. Relatively little is therefore known about impact melts. Now, new data from the mini-RF radar instrument is helping to fill this knowledge gap and also offering insight into future landing spots on the Moon.
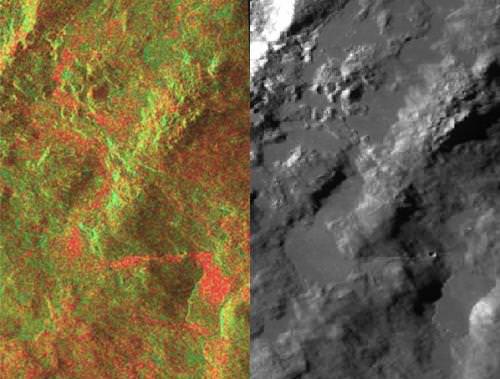
Radar is an active remote sensing system, meaning it transmits a signal and then records what bounces back, providing information about the surfaces that were encountered. If the transmitted signal hits a smooth surface, then the returned signal will have a polarization direction that is opposite to what was transmitted. But, if the surface is rough, the signal may bounce more than once, switching polarization each time, so the returned polarization will be the same as the transmitted signals. By controlling the polarization of the transmitted signal and monitoring the polarization of the returned signals, researchers can calculate the ratio of same-sense to opposite sense circular polarization, a parameter called CPR. Smooth surfaces will have a low CPR, while rough surfaces will have a high CPR.

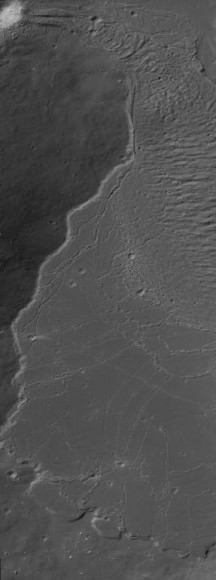
Image credit: NASA/GSFC/Arizona State University.
Click on the image to explore the LROC data from this area in greater detail.
The mini-RF transmits in the radar S band, at wavelengths of 12.6 cm, and so tells us about surface roughness at the 12.6 cm scale. For example, a sandy beach covered with sand grains that are about 1-2 mm in size (much smaller than the transmitted wavelength) will appear smooth to the Mini-RF (have low CPR values). But, a beach covered with hand-sized pebbles (about the size of the transmitted wavelength) will appear rough (have high CPR values). It is important to note that this kind of information is not currently available from our existing image data, which even at its best can only resolve things on the 50 cm scale. Furthermore, the mini-RF radar can penetrate up to 1 m below the surface, providing information about buried surfaces as well.
Working with the mini-RF data, Dr. Lynn Carter and a team of researchers from NASA Goddard Space Flight Centre, Johns Hopkins University, and the Lunar and Planetary Institute have taken a look at impact melts around a variety of craters. They found that impact melt ponds and flows tend to have CPR values that are greater than surrounding non-melt regions. This means that mini-RF data can be used to help find and identify melt materials, including buried ones! From their limited survey, Dr. Carter and her team have found that impact melt ponds and flows are more common on the Moon than was previously known. With more work, they will be able to better catalogue the number and size of melt ponds and flows around lunar craters, improving our understanding of how much melt is produced by impacts and how it travels.
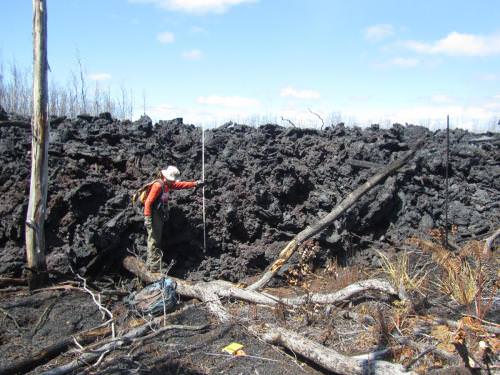
Dr. Carter and her team also found that, within individual melt ponds or flows, roughness values can vary. Rough surfaces may represent bunching up of a partially cooled crust as it is pushed by the still fluid melt underneath. Such pressure ridges are seen in terrestrial lava flows. Smooth surfaces may represent melts that cooled quickly, or the last melts to arrive at a pond (and so not subject to pushing from more inflowing melt). But, even the “smooth” melts, which appear quite flat in visual imagery, tend to have very high CPR values, indicating that they are, in fact, very rough. There is probably a lot of solid rock and ejecta debris (something we can’t see in the currently available imagery) entrained in the melt material to make them so rough at this scale. To understand what this kind of surface might look like, we can consider terrestrial a’a flows (which are actually slightly less rough than lunar melts).
This work has important implications for future lunar exploration. Imagine how difficult landing on a surface as rugged at an a’a flow would be. This is why site selection scientists work very hard at identifying smooth areas for spacecraft to land. However, if surfaces that look extremely smooth in visual imagery are actually rough like an a’a flow, this can present a problem. Mini-RF data could be helpful in identifying such rough regions and eliminating them from consideration.

Source: Initial observations of lunar impact melts and ejecta flows with the Mini-RF radar, Carter et al., Journal of Geophysical Research V117, 2012, doi:10.1029/2011JE003911.

