Apollo Landing Sites Pose a Threat to LRO Instrument

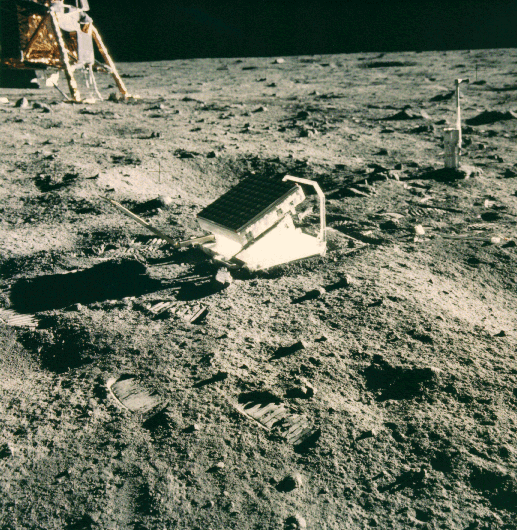
The Laser Ranging Retroreflector experiment on the Moon. Credit: Lunar and Planetary Institute

[/caption]
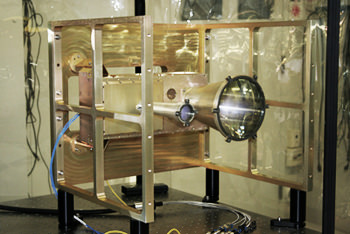
The recent images released by the Lunar Reconnaissance Orbiter of the Apollo landing sites are truly remarkable. But there is one instrument on board LRO that must avoid studying some of the the Apollo sites as well as other places where humans have placed spacecraft on the the lunar surface. The Lunar Orbiting Laser Altimeter (LOLA) pulses a single laser beam down to the surface to create a high-resolution global topographic map of the Moon. However, LOLA is turned off when it passes over the Apollo sites because bouncing the laser off any of the retro-reflective mirrors on experiments left by the astronauts might damage the instrument.

Don Mitchell, who owns a software consulting company and is writing a book on the Soviet Exploration of Venus, wrote about this problem on his blog, saying that if LOLA’s beam did strike the retro reflector experiment, “the light bounced back would be 1,000 times the detector damage threshold.”

LOLA Engineering model. Credit: Goddard Space Flight Center

The LOLA instrument is based on Mars Orbiter Laser Altimeter (MOLA), flown on Mars Global Surveyor and the Mercury Laser Altimeter (MLA), currently on MESSENGER. LOLA will perform the same type of work as these previous instruments, but with 3-5 times greater vertical accuracy and 14 times more measurements along the spacecraft ground track.

The Laser Ranging Retroreflector experiment was deployed on Apollo 11, 14, and 15. It consists of a series of corner-cube reflectors, which reflects an incoming light beam back in the direction it came from.

Ever since the experiments were deployed, the McDonald Observatory in Texas has beamed a laser at these mirrors and measured the round-trip of the beam. This provides accurate data on the Moon’s orbit, the rate at which the Moon is receding from Earth (currently 3.8 centimeters per year) and variations in the rotation of the Moon. These are the only Apollo experiments that are still returning data. A similar device was also included on the Soviet Union’s Lunakhod spacecraft.

David E. Smith, LOLA principal investigator confirmed that, indeed, LOLA is switched off over the Apollo and Lunakhod sites, to avoid damaging the instrument. He said the Russians have been very helpful in in providing the LOLA team the best known locations for the two Lunokhod landers. Lunokhod-2 has been located precisely and is routinely probed by lasers from Earth. Lunokhod-1 has never been found by laser, and it is not known for certain if its reflector is deployed. Smith said he and co-PI Maria Zuber have visited Moscow to consult with Russian scientists, who have shared their knowledge of the locations of their landers.

As Mitchell wrote, “While conspiracy nuts debate the reality of the Apollo landings, scientists must deal with some practical consequences of what astronauts put on the Moon.”

Sources: Don Mitchell’s Blog, email exchange with David E. Smith

Hat tip to Emily Lakdawalla on Twitter!

Weight on Other Planets

Planets and other objects in our Solar System. Credit: NASA.

[/caption]
Many children, and even adults, dream of visiting other planets and wonder what it would be like to stand on another planet. For one thing, your weight would be different on another planet, depending on a number of factors including the mass of the planet and how far you are away from the center of the planet.

Before we start, it’s important to understand that the kilogram is actually a measurement of your mass. And your mass doesn’t change when you go anywhere in the Universe and experience different amounts of gravity. Your weight is best measured in newtons. But since your bathroom doesn’t measure your weight in newtons, we’ll use kilograms. This is what your bathroom scale would say if you stepped on another world.

Mercury is the smallest planet in our Solar System, but it is dense. Because Mercury is so small, it has very little gravity. If you weighed 68 kg on Earth, you would only weigh 25.7 kg on Mercury. 

Venus is very close to Earth in size and mass. Venus’ mass is roughly 90% of the mass of the Earth. Thus, it is no surprise that someone would weigh a similar amount on Venus. Someone who weighed 68 kg on Earth would weigh 61.6 kg on Venus.

Mars is quite a bit smaller than Earth with only 11% of our planet’s mass. Mars is larger than Mercury, but it is not as dense as the smaller planet. If you weighed 68 kg on Earth then you would weigh 25.6 kg on Mars. Since Pluto was demoted to a dwarf planet, Mars became the planet where you would weigh the least.

Jupiter is the largest planet in our Solar System with the most mass. Because of Jupiter’s mass, you would weigh more on that planet than on any other one in our Solar System. If you weighed 68 kg on Earth then you would weigh 160.7 kg on Jupiter, over twice your normal weight. That is if you could actually stand on Jupiter’s surface, which is impossible because it is a gas giant, and gas giants do not have solid surfaces.

Saturn is a gas giant best known for its planetary rings system. It is also the second biggest planet in our Solar System. Despite its mass though, the planet has a very low density and a lower gravity than Earth. If you weighed 68 kg on Earth, you would weigh 72.3 kg on Saturn.

Uranus is a gas giant without a solid surface. Although Uranus is larger in size than Neptune, it has less mass and therefore less gravity. You would only weigh 60.4 kg on Uranus, if you weighed 68 kg on Earth.

Neptune, the last planet in our Solar System, is a gas giant. If you weighed 68 kg on Earth, then you would weigh 76.5 kg on Neptune if you could stand on the planet’s surface.

Although the Moon is not a planet, it is one of the few objects that astronauts have actually visited. Because the Moon is so small, it has a low density and low gravity. If you weighed 68 kg on Earth, then you would only weigh 11.2 kg on the Moon.

Universe Today has a number of articles to check out including weight on the moon and mass of the planets.

If you are looking for more information then determine your weight on other planets and facts about the planets.

Astronomy Cast has an episode on gravity.

Land on the Moon in Google Earth


To celebrate the 40th anniversary of the Apollo 11 Moon landing, Google has launched a new feature: the Moon in Google Earth. You can now use Google Earth to explore, fly around and search the Moon. Google was able to get several astronauts to participate in this new feature, and you can get tours of landing sites, narrated by Apollo astronauts, view 3D models of landed spacecraft, zoom into 360-degree photos to see astronauts’ footprints and watch rare TV footage of the Apollo missions. The hi-resolution views of the Moon were developed in collaboration with NASA Ames Research and JAXA. It’s loads of fun and provides an historic perspective as well as a look to the future of lunar exploration. If you already have Google Earth 5.0 on your computer, just click on the tab on the top toolbar that has a picture of Saturn, and click on Moon. If you click on the Apollo 11 flag, you can zoom in on that location and take a tour of the first landing site on the Moon! What a great way celebrate the 40th anniversary. Enjoy!

Click here to go the the Moon in Google Earth.

Plane of the Ecliptic

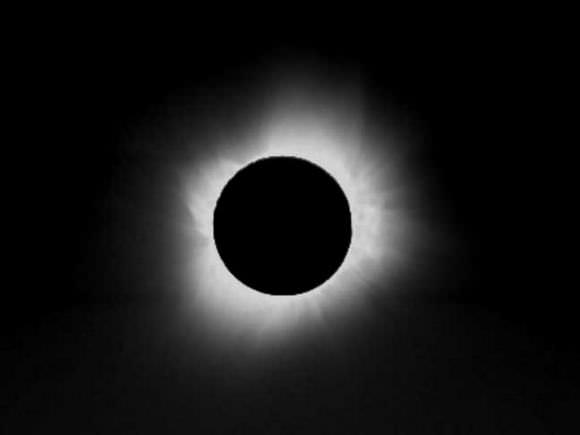
Solar eclipse. Credit: NASA

[/caption]

Plane of the ecliptic, also known as the ecliptic plane, is a phrase you will often hear in astronomy. A basic definition is that the plane of the ecliptic is the plane of the Earth’s orbit, but that does not mean much to most people. Space is a three-dimensional vacuum, which you can think of as a kind of pool with the planets suspended in it. The Earth orbits the Sun on a particular angle and its orbit is elliptical in shape. The orbit is often shown as an ellipse made of dotted lines with the Sun at its center. If you made this ellipse a solid surface and extended it infinitively, then you would have the plane of the ecliptic. Actually our entire Solar System can be thought of as flat because all of the planets’ orbits are near or on this plane.

The ecliptic plane is used as the main reference when describing the position of other celestial objects in our Solar System. The angle between the plane of the ecliptic and the plane of an orbit is called the inclination. Until it was stripped of its status as a planet, Pluto was the planet with the most extreme inclination – 17°. Mercury is the only other planet with a significant inclination of 7°. There is also a 7° inclination between the plane of the Sun’s equator and the ecliptic plane. There are other celestial bodies that have a much greater inclination than any of the planets, such as Eris with a 44° inclination or Pallas with a 34° inclination.

The ecliptic plane got its name from the fact that a solar eclipse can only happen when the Moon crosses this plane to block out the Sun. Our Moon crosses the ecliptic about twice a month. A solar eclipse occurs when a new Moon crosses the ecliptic, and a lunar eclipse occurs when a full Moon crosses it.

Seasons on Earth are caused by our planet’s axial tilt of 23.5°, which causes variations in the amount of sunlight different parts of the Earth receive. This goes for all the other planets too. For example, Uranus rotates on its side with an axial tilt of 97.8°, which results in extreme variations in its seasons. The eclipse is also home to the constellations of the zodiac. There are twelve constellations in the zodiac, which are important symbols in astrology and can also be found in the Chinese calendar.  Here’s a list of all the zodiac symbols.

Universe Today has a number of articles including Virgo one of the zodiac signs and axial tilt.

You should also check out these articles on the ecliptic plane and ecliptic facts for more information.

Do not forget to tune into Astronomy Cast’s episode about the planet’s orbits.

Reference:
NASA: The Path of the Sun, the Ecliptic

LRO Images Apollo Landing Sites (w00t!)

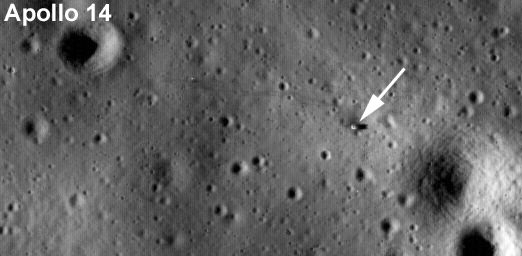
The Apollo 14 landing site imaged by LRO. Credit: NASA

[/caption]

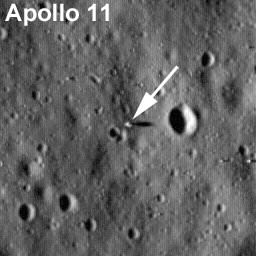
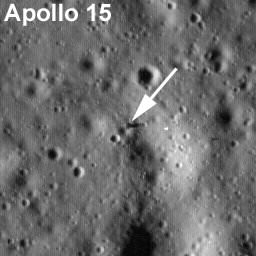
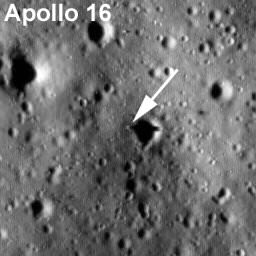
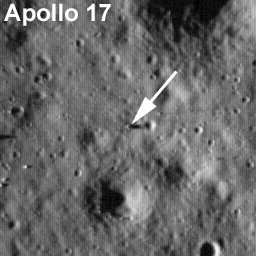
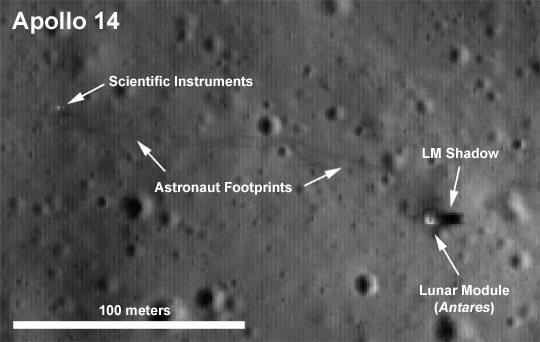
As anticipated, NASA released images of the Apollo landing sites taken by the Lunar Reconnaissance Orbiter (LRO). The pictures show the Apollo missions’ lunar module descent stages sitting on the moon’s surface, as long shadows from a low sun angle make the modules’ locations evident. Also visible are the tracks left where the astronauts walked repeatedly in a “high traffic zone” and perhaps by the Modularized Equipment Transporter (MET) wheelbarrow-like carrier used on Apollo 14. Wow.

As a journalist, I (most of the time) try to remain objective and calm. But there’s only one response to these images: W00T!


Apollo 11 landing site as imaged by LRO. Credit: NASA

These first images were taken between July 11 and 15, and the spacecraft is not yet in its final mapping orbit. Future LROC images from these sites will have two to three times greater resolution.
Apollo 15 site by LRO. Credit: NASA

These images are the first glimpses from LRO,” said Michael Wargo, chief lunar scientist, NASA Headquarters, Washington. “Things are only going to get better.”

The Japanese Kaguya spacecraft previously took images of some of the Apollo landing sites, but not at a high enough resolution to show any of the details of the lander or any other details. But here on these images, the hardware is visible. “It’s great to see the hardware on the surface, waiting for us to return,” said Mark Robinson, principal investigator for LRO.

Robinson said the LROC team anxiously awaited each image. “We were very interested in getting our first peek at the lunar module descent stages just for the thrill — and to see how well the cameras had come into focus. Indeed, the images are fantastic and so is the focus.”

Apollo 16 by LRO. Credit: NASA

The Lunar Reconnaissance Orbiter Camera, or LROC, was able to image five of the six Apollo sites, with the remaining Apollo 12 site expected to be photographed in the coming weeks.

The spacecraft’s current elliptical orbit resulted in image resolutions that were slightly different for each site but were all around four feet per pixel. Because the deck of the descent stage is about 12 feet in diameter, the Apollo relics themselves fill an area of about nine pixels. However, because the sun was low to the horizon when the images were made, even subtle variations in topography create long shadows. Standing slightly more than ten feet above the surface, each Apollo descent stage creates a distinct shadow that fills roughly 20 pixels.

Apollo 17 LRO. Credit: NASA

The image of the Apollo 14 landing site had a particularly desirable lighting condition that allowed visibility of additional details. The Apollo Lunar Surface Experiment Package, a set of scientific instruments placed by the astronauts at the landing site, is discernable, as are the faint trails between the module and instrument package left by the astronauts’ footprints.
Zoomed in Apollo 14 image by LRO. Credit: NASA

Source: NASA

First Conclusive Signature for Lunar Uranium

Data from Kaguya's GRS. Credit: JAXA

[/caption]
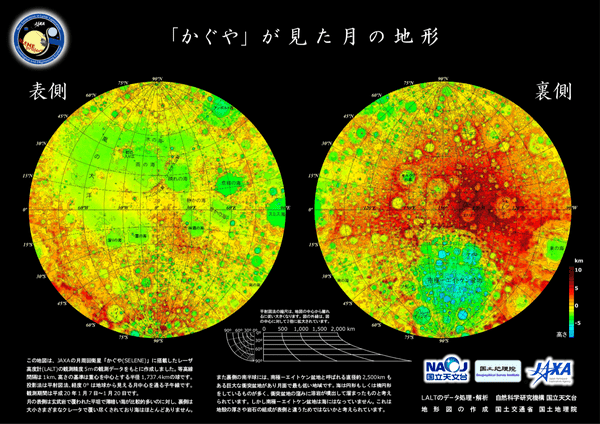
Using data obtained from the gamma ray spectrometer on the Kaguya spacecraft scientists have found signatures of uranium, an element not seen in previous moon-mapping efforts. In addition to uranium, the Kaguya GRS data also is showing clear signatures for thorium, potassium, oxygen, magnesium, silicon, calcium, titanium and iron.

“We’ve already gotten uranium results, which have never been reported before,” said Robert C. Reedy, senior scientists at the Planetary Science Institute. “We’re getting more new elements and refining and confirming results found on the old maps.”

Earlier gamma-ray spectrometer maps from the Apollo and Lunar Prospector missions show a few of the moon’s chemical elements. But the maps constructed by Reedy and the Kaguya GRS team — using data gathered by state-of-the-art high-energy-resolution germanium detectors — are extending the earlier results and improving our understanding of the moon’s surface composition.

Reedy and his colleagues are using measurements from the Kaguya lunar orbiter’s GRS to construct high-quality maps of as many chemical elements as possible. Kaguya was launched in September 2007 and crashed into the moon at the end of its mission on June 10 of this year.

Source: Planetary Science Institute

Watch Live Streaming Video From LCROSS Lunar Swingby Tuesday

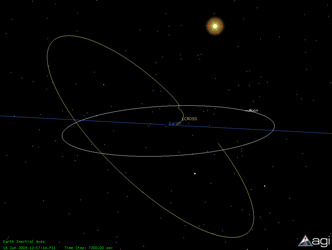
Graphic showing LCROSS's orbit. Credit: NASA

[/caption]
On Tuesday morning, the LCROSS spacecraft will fly by the Moon only 9,000 km above the lunar surface and send back live streaming video for about an hour. This relatively close encounter with the Moon, will help put LCROSS in the correct position to impact the lunar surface in October. LCROSS will never actually be lunar orbit, but is working its way to an elongated Earth orbit which will eventually bring it to the correct orientation for meeting up with the south pole of the Moon later this year. LCROSS will search for water ice on the moon by sending the spent upper-stage Centaur rocket to impact part of a polar crater in permanent shadows. The LCROSS spacecraft will fly into the plume of dust left by the impact and measure the properties before also colliding with the lunar surface. Live video streaming of the flyby begins at approximately 12:20 GMT (8:20 EDT) on Tuesday, June 23, 2009. Click here to watch.

The LCROSS instrumentation will send back data to Earth for approximately one hour. The first 30 minutes will contain a view of the lunar surface from an altitude of approximately 9,000 km. The video feed is set to display one frame per second. During the latter 30 minutes, the spacecraft will perform multiple scans of the moon’s horizon to calibrate its sensors. During this latter half hour, the video image will update only occasionally. The 3D visualization stream will show the spacecraft position and attitude throughout the swingby.

Watch this video of the LCROSS mission overview.

Source: LCROSS

NASA IBEX Spacecraft Detects Neutral Hydrogen Bouncing Off Moon

NASA's Interstellar Boundary Explorer has made the first detection of neutral atoms coming from the Moon (background image). The color-coded data toward the bottom shows the neutral particles and geometry measured at the Moon on Dec. 3, 2008.

[/caption]

NASA’s Interstellar Boundary Explorer (IBEX) spacecraft has made the first observations of fast hydrogen atoms coming from the moon, following decades of speculation and searching for their existence.   Launched last October, the IBEX has a mission to image and map the dynamic interactions caused by the hot solar wind slamming into the cold expanse of space.  But as the IBEX team commissioned the spacecraft, they discovered the stream of neutral hydrogen atoms which are caused by the solar wind scattering off the moon’s surface.


The detector which made the discovery, called IBEX-Hi, was designed and built by the Southwest Research Institute and Los Alamos National Labs to measure particles moving at speeds of 0.5 million to 2.5 million miles an hour.

“Just after we got IBEX-Hi turned on, the moon happened to pass right through its field of view, and there they were,” says Dr. David J. McComas, IBEX principal investigator and assistant vice president of the SwRI Space Science and Engineering Division, where the IBEX-Hi particle detector was primarily built. “The instrument lit up with a clear signal of the neutral atoms being detected as they backscattered from the moon.”

The solar wind, the supersonic stream of charged particles that flows out from the sun, moves out into space in every direction at speeds of about a million mph. The Earth’s strong magnetic field shields our planet from the solar wind. The moon, with its relatively weak magnetic field, has no such protection, causing the solar wind to slam onto the moon’s sunward side.

From its vantage point in high earth orbit, IBEX sees about half of the moon — one quarter of it is dark and faces the nightside (away from the sun), while the other quarter faces the dayside (toward the sun). Solar wind particles impact only the dayside, where most of them are embedded in the lunar surface, while some scatter off in different directions. The scattered ones mostly become neutral atoms in this reflection process by picking up electrons from the lunar surface.

The IBEX team estimates that only about 10 percent of the solar wind ions reflect off the sunward side of the moon as neutral atoms, while the remaining 90 percent are embedded in the lunar surface. Characteristics of the lunar surface, such as dust, craters and rocks, play a role in determining the percentage of particles that become embedded and the percentage of neutral particles, as well as their direction of travel, that scatter.

McComas says the results also shed light on the “recycling” process undertaken by particles throughout the solar system and beyond. The solar wind and other charged particles impact dust and larger objects as they travel through space, where they backscatter and are reprocessed as neutral atoms. These atoms can travel long distances before they are stripped of their electrons and become ions and the complicated process begins again.

The combined scattering and neutralization processes now observed at the moon have implications for interactions with objects across the solar system, such as asteroids, Kuiper Belt objects and other moons. The plasma-surface interactions occurring within protostellar nebula, the region of space that forms around planets and stars — as well as exoplanets, planets around other stars — also can be inferred.

IBEX’s primary mission is to observe and map the complex interactions occurring at the edge of the solar system, where the million miles per hour solar wind runs into the interstellar material from the rest of the galaxy. The spacecraft carries the most sensitive neutral atom detectors ever flown in space, enabling researchers to not only measure particle energy, but also to make precise images of where they are coming from.

And the spacecraft is just getting started.  Towards the end of the summer, the team will release the spacecraft’s first all-sky map showing the energetic processes occurring at the edge of the solar system. The team will not comment until the image is complete, but McComas hints, “It doesn’t look like any of the models.”

The research was published recently in the journal Geophysical Research Letters.

Source: Southwest Research Institute

Forgotten Apollo Data Could Solve Moon Dust Problem

An IMB 726, a precursor of the 729 data recorder. Credit: IBM

Old, forgotten data from three Apollo moon missions could help overcome one of the biggest environmental hurdles facing future lunar colonists. Pervasive moon dust can clog equipment, scratch helmet visors –or worse, get inside astronaut lungs and cause serious health problems. But 173 data tapes hold information that could be essential in overcoming the problems the dust causes. The only trouble is that the tapes are archived on “ancient” 1960’s technology and no one could find the right equipment to playback the tapes. However, the Australian Computer Museum has an old IBM729 Mark 5 tape drive that should do the trick, IF the machine can be restored to operable condition again…

The IBM729 Mark 5 tape recorder is about as big as a household refrigerator. It recorded data from Apollo 11, 12 and 14 missions that carried “dust detectors.” Information from the detectors was beamed back to earth and recorded onto tapes. Copies of the tapes were supposedly sent to NASA, but the tapes were lost or misplaced before they could be archived in NASA’s holdings. But the original data tapes have sat in Perth, Australia for almost 40 years.

Physicist Brian O’Brien invented the detectors. He wrote a couple of papers on the information in the 1970’s, but no one was very interested in moon dust back then. However now, scientists realize this information could help make future missions to the moon more feasible.

Apollo astronaut Gene Cernan covered with moon dust.  Credit: NASA
Apollo astronaut Gene Cernan covered with moon dust. Credit: NASA

“These were the only active measurements of moon dust made during the Apollo missions, and no one thought it was important,” said O’Brien. “But it’s now realised that dust, to quote Harrison Schmitt, who was the last astronaut to leave the moon, is the number one environmental problem on the moon.”

O’Brien quit his work on lunar dust when he left the University of Sydney. Two years ago, someone at NASA remembered the data had been taken, but couldn’t find the duplicate tapes.

O’Brien says there is no indication as to when exactly the tapes were lost, but he guesses that it was “way, way back.” When O’Brien learned of the tape loss, he was contacted by Guy Holmes from a data recovery company who offered to try and extract the information on the old, original tapes. But Holmes realized he needed some old equipment to do the job, and came across the right IBM tape drive at the Australian Computer Museum.

The archaic-looking recorder is in need of refurbishing, however. Holmes jokes that a 1970s Toyota Corolla fan belt could be used to get the recorder up and running.

“The drives are extremely rare, we don’t know of any others that are still operating,” he said.

“It’s going to have to be a custom job to get it working again. It’s certainly not simple, there’s a lot of circuitry in there, it’s old, it’s not as clean as it should be and there’s a lot of work to do.”

Holmes is hopeful of getting the tape recorder working again in January, and then he says it should only take a week to extract information that has been locked away since the early 1970s.

Source: Australia’s ABC News

New NASA Animation Lets You Land on the Moon

moon-15day-2884-500.thumbnail.jpg

Using new high resolution terrain mapping data obtained by the Deep Space Network, NASA has created some new animations that take viewers to the Moon’s south pole. The videos include a flyover of Shackleton Crater and a very nifty animation of descent to the lunar surface of a future human lunar lander.

“I have not been to the Moon, but this imagery is the next best thing,” said Scott Hensley, a scientist at JPL and lead investigator for obtaining the data. “With these data we can see terrain features as small as a house without even leaving the office.”

Here’s the descent and landing animation. Make sure you watch to the very end, because the ending is the most impressive part, when you realize where you’ve landed.

The rim of Shackleton Crater is considered a candidate landing site for a future human mission to the moon.

And there’s more:

The mapping data collected indicate that the region of the Moon’s south pole near Shackleton Crater is much more rugged than previously understood. Here’s an animation of a flyover of the lunar south pole

Another animation shows the amount of sunlight falling on the Moon’s south pole during one lunar day. Notice that the interior of some craters remain almost completely dark — no sunshine ever strikes these areas — and some scientists feel there could possibly be water ice inside these craters.

To create these animations scientists targeted the Moon’s south polar region three times during a six-month period in 2006, using Goldstone’s 70-meter (230-foot) radar dish. The antenna, three-quarters the size of a football field, sent a 500-kilowatt-strong, 90-minute-long radar stream 373,046 kilometers (231,800 miles) to the moon. The radar bounced off the rough-hewn lunar terrain over an area measuring about 644 kilometers by 402 kilometers (400 miles by 250 miles). Signals were reflected back to two of Goldstone’s 34-meter (112-foot) antennas on Earth. The roundtrip time, from the antenna to the Moon and back, was about two-and-a-half seconds.

For more images and animations go to NASA’s Moon Exploration page.