[/caption]
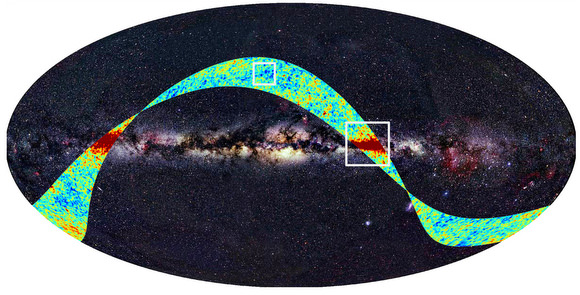
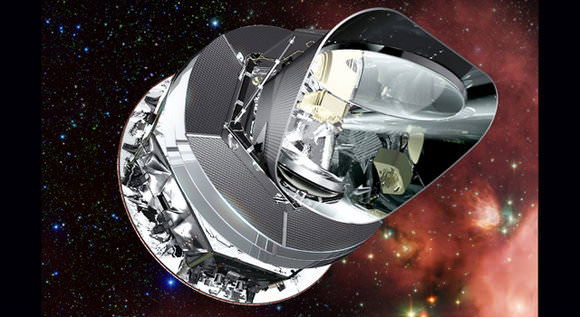
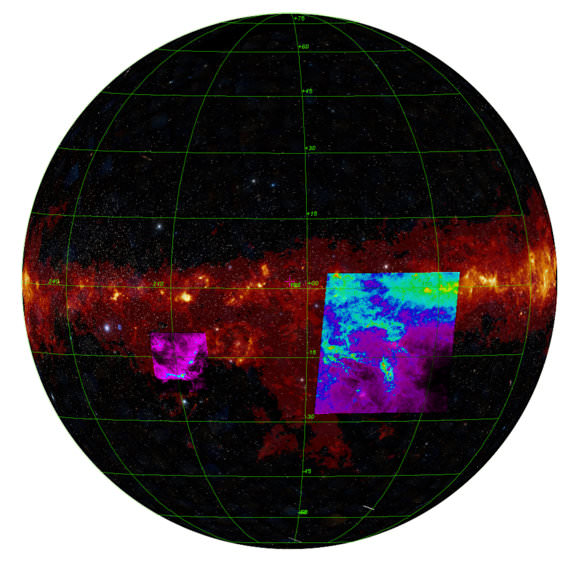
While most newborn stars are hidden beneath a blanket of gas and dust, the Planck space observatory – with its microwave eyes – can peer beneath that shroud to provide new insights into star formation. The latest images released by the Planck team bring to light two different star forming regions in the Milky Way, and in stunning detail, reveal the different physical processes at work.
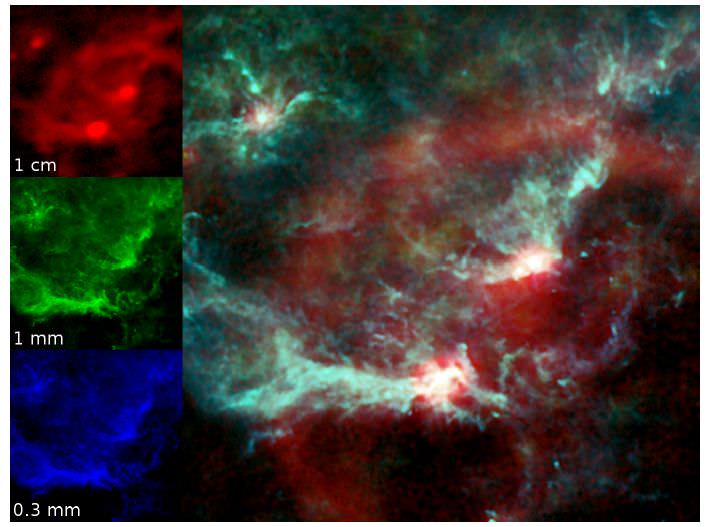
“Seeing” across nine different wavelengths, Planck took at look at star forming regions in the constellations of Orion and Perseus. The top image shows the interstellar medium in a region of the Orion Nebula where stars are actively forming in large numbers. “The power of Planck’s very wide wavelength coverage is immediately apparent in these images,” said Peter Ade of Cardiff University, co-Investigator on Planck. “The red loop seen here is Barnard’s Loop, and the fact that it is visible at longer wavelengths tells us that it is emitted by hot electrons, and not by interstellar dust. The ability to separate the different emission mechanisms is key for Planck’s primary mission.”
A comparable sequence of images, below, showing a region where fewer stars are forming near the constellation of Perseus, illustrates how the structure and distribution of the interstellar medium can be distilled from the images obtained with Planck.
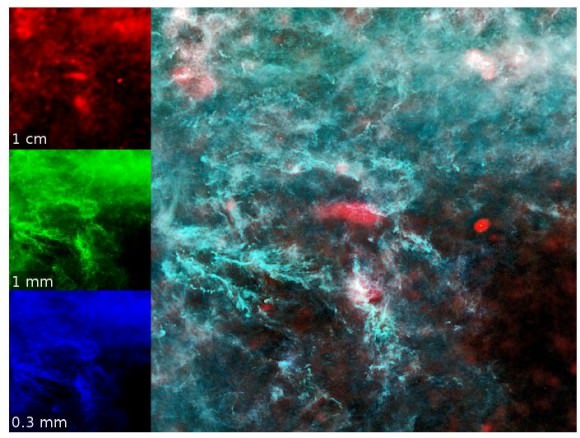
At wavelengths where Planck’s sensitive instruments observe, the Milky Way emits strongly over large areas of the sky. This emission arises primarily from four processes, each of which can be isolated using Planck. At the longest wavelengths, of about a centimeter, Planck maps the distribution of synchrotron emission due to high-speed electrons interacting with the magnetic fields of our Galaxy. At intermediate wavelengths of a few millimeters the emission is dominated by ionized gas being heated by newly formed stars. At the shortest wavelengths, of around a millimeter and below, Planck maps the distribution of interstellar dust, including the coldest compact regions in the final stages of collapse towards the formation of new stars.
“The real power of Planck is the combination of the High and Low Frequency Instruments which allow us, for the first time, to disentangle the three foregrounds,” said Professor Richard Davis of the University of Manchester’s Jodrell Bank Centre for Astrophysics. “This is of interest in its own right but also enables us to see the Cosmic Microwave Background far more clearly.”
Once formed, the new stars disperse the surrounding gas and dust, changing their own environment. A delicate balance between star formation and the dispersion of gas and dust regulates the number of stars that any given galaxy makes. Many physical processes influence this balance, including gravity, the heating and cooling of gas and dust, magnetic fields and more. As a result of this interplay, the material rearranges itself into ‘phases’ which coexist side-by-side. Some regions, known as ‘molecular clouds,’ contain dense gas and dust, while others, referred to as ‘cirrus’ (which look like the wispy clouds we have here on Earth), contain more diffuse material.
Since Planck can look across such a wide range of frequencies, it can, for the first time, provide data simultaneously on all the main emission mechanisms. Planck’s wide wavelength coverage, which is required to study the Cosmic Microwave Background, proves also to be crucial for the study of the interstellar medium.
“The Planck maps are really fantastic to look at,” said Dr. Clive Dickinson, also of the University of Manchester. “These are exciting times.”
Planck maps the sky with its High Frequency Instrument (HFI), which includes the frequency bands 100-857 GHz (wavelengths of 3mm to 0.35mm), and the Low Frequency Instrument (LFI) which includes the frequency bands 30-70 GHz (wavelengths of 10mm to 4mm).
The Planck team will complete its first all-sky survey in mid-2010), and the spacecraft will continue to gather data until the end of 2012, during which time it will complete four sky scans. To arrive at the main cosmology results will require about two years of data processing and analysis. The first set of processed data will be made available to the worldwide scientific community towards the end of 2012.
Source: ESA and Cardiff University

