Gallery: WISE’s Greatest Hits

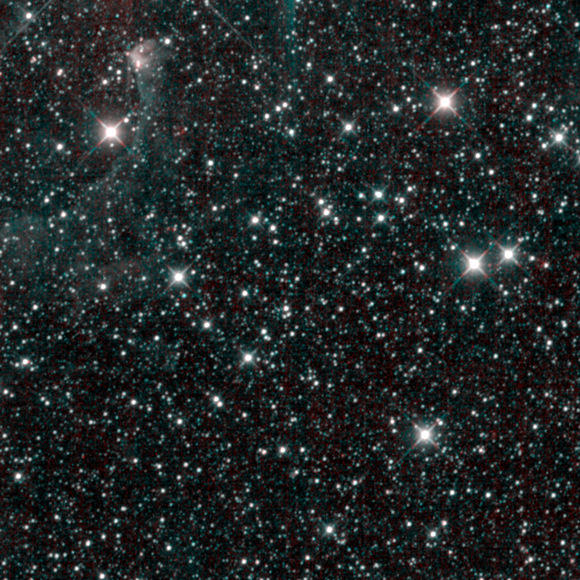
WISE First Light image. Image credit: NASA/JPL-Caltech/UCLA

[/caption]

The WISE mission is now over, with the spacecraft taking its final image on Feb. 1, 2011. WISE was a “cool” infrared mission, with the optics chilled to less than 20 degrees centigrade above absolute zero (20 Kelvins). In its low Earth orbit (523 km above the ground), the spacecraft explored the entire Universe and collected infrared light coming from everywhere in space and studied asteroids, the coolest and dimmest stars, and the most luminous galaxies. Expect to hear and see more from WISE, however in the future. More images will be released from the team in April and in the spring of 2012. Here’s a look back at some of the great images from WISE’s 13 months in space:

The red dot at the center of this image is the first near-Earth asteroid discovered by NASA's Wide-Field Infrared Survey Explorer, or WISE Image credit: NASA/JPL-Caltech/UCLA
The red smudge at the center of this picture is the first comet discovered by NASA's Wide-Field Infrared Survey Explorer, or WISE. Image credit: NASA/JPL-Caltech/UCLA
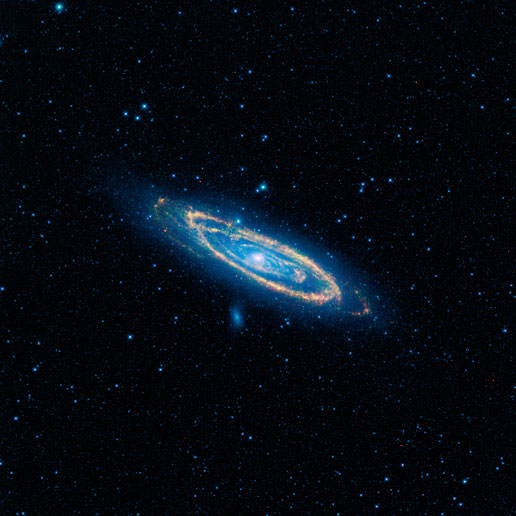
The immense Andromeda galaxy, also known as Messier 31 or simply M31, is captured in full in this February 2010 image from WISE. credit: NASA/JPL-Caltech/UCLA
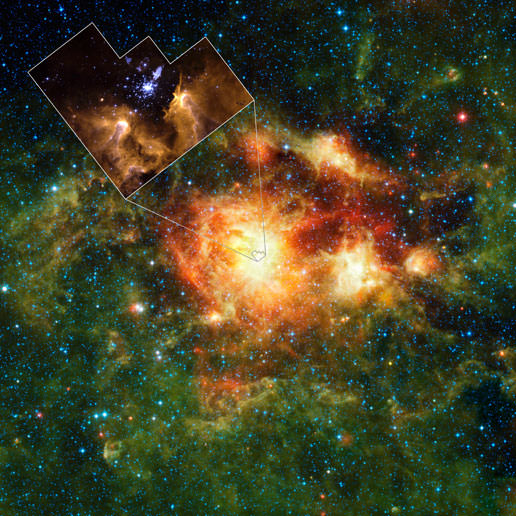
NGC 3603, as seen by WISE. credit: NASA/JPL-Caltech/UCLA
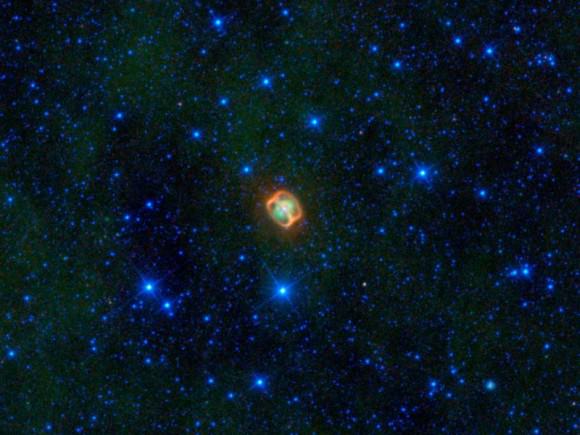
NGC 1514, sometimes called the Crystal Ball nebula shows a new double ring feature in an image from WISE. Image credit: NASA/JPL-Caltech/UCLA
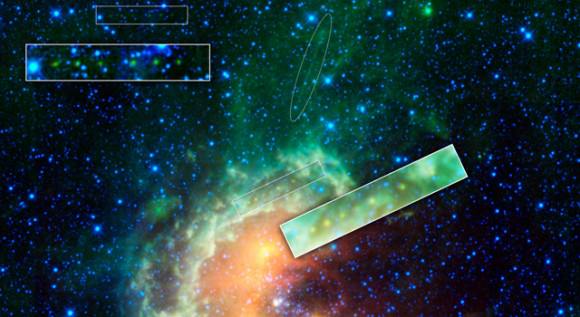
This image from WISE shows the Tadpole nebula. Image credit: NASA/JPL-Caltech/UCLA
The Heart and Soul nebulae are seen in this infrared mosaic from WISE. Image credit: NASA/JPL-Caltech/UCLA
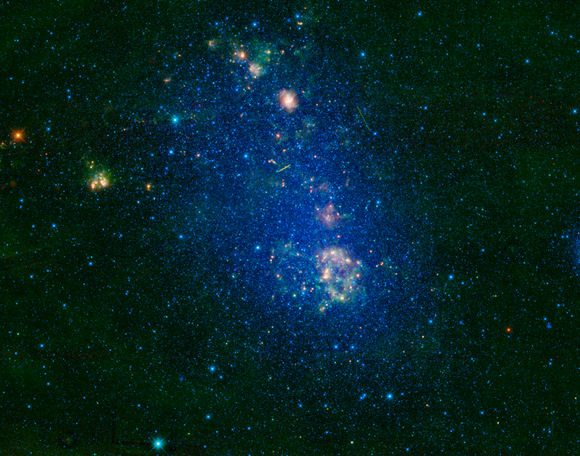
An image released in August 2010 from WISE image of the Small Magellanic Cloud. Image credit: NASA/JPL-Caltech/WISE Team
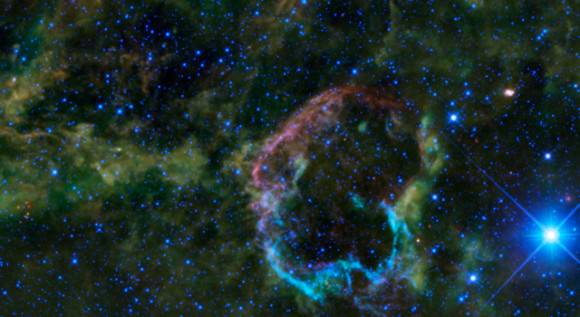
This oddly colorful nebula is the supernova remnant IC 443 as seen by WISE. Image credit: NASA/JPL-Caltech/UCLA
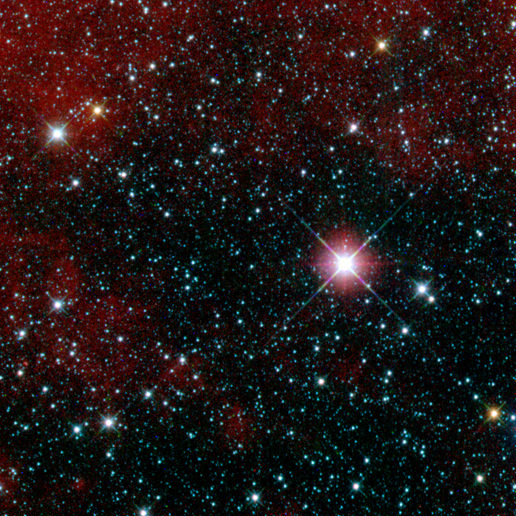
The last image that will ever be taken by the WISE spacecraft. Credit: NASA/JPL-Caltech/WISE Team

And if you want to see how it all started, here’s a video of WISE’s launch:

Videos: Two Different Satellite Views of the Big Snowstorm of 2011

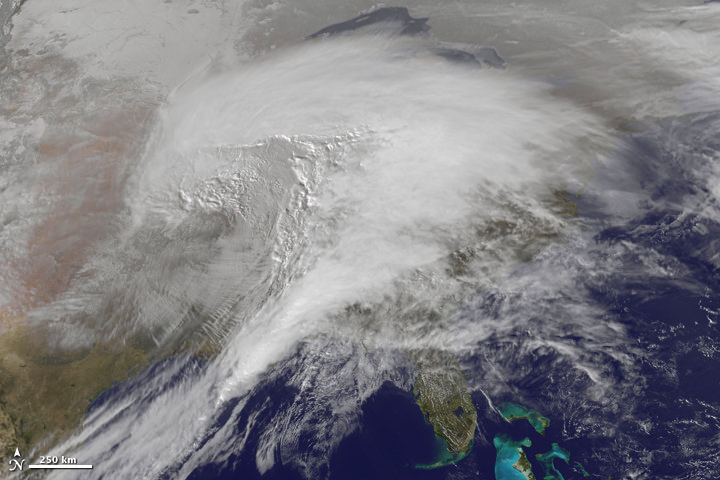
Here's an image from the top animation, the storm as seen on January 31, 2011

To speak in the vernacular of the peasantry, this storm was a whopper. Heavy snow, ice, freezing rain, and frigid wind battered about two thirds of the United States, making it “a winter storm of historic proportions,” said the National Weather Service. This animation—made with images from the NOAA-NASA GOES 13 satellite—shows the giant storm developing and moving across the country between January 31 and February 2. Below is another video view from GOES-East satellite, which includes infrared water vapor imagery from January 29 -February 1, 2011.

And there’s also an update on Cyclone Yasi.

[/caption]

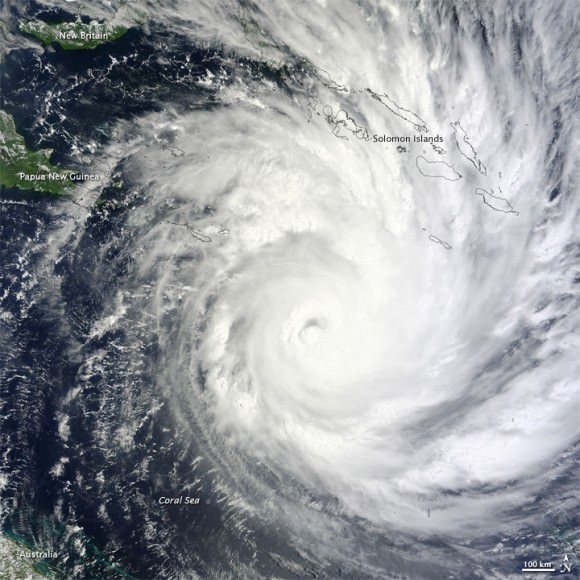
Cyclone Yasi as seen on Feb. 1, 2011 from The Moderate Resolution Imaging Spectroradiometer (MODIS) on NASA’s Terra satellite

Yasi weakened after coming ashore early on Thursday morning but was still strong enough to produce high winds and tidal surges that sent waves crashing deep into seaside communities. Thankfully, so far no lives have been lost because of this storm. Officials said lives were saved because after days of dire warnings people heeded directions to flee to evacuation centers or bunker themselves at home. Track the storm on WeatherUnderground, and read more on the latest news from Yasi on The Guardian.

Sources: NASA Earth Observatory, SolarWatcher, The Guardian

Satellite View: Huge Storm Heads Across the US

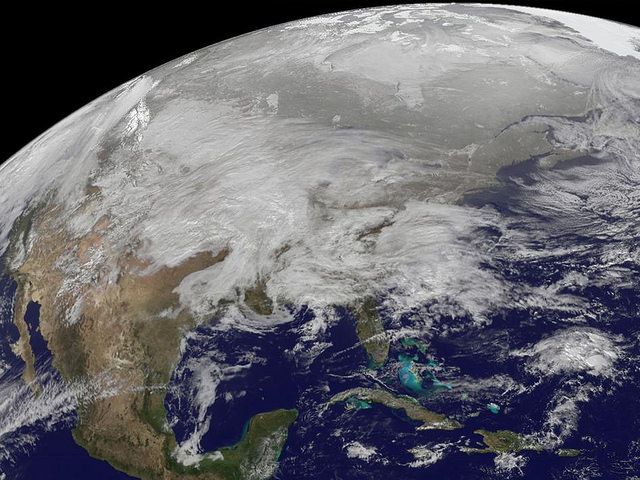
The GOES-13 satellite captured this image on Jan. 31, 2011 of a major winter storm covering a large portion of the US. Image Credit: NOAA/NASA GOES Project

[/caption]

The roads are a skating rink where I live! This visible image was captured by the GOES-13 satellite on January 31, 2011 and it shows the low pressure area bringing snowfall to the Midwest US. Heavy snow is expected today in portions of northern Iowa, southern Minnesota and Wisconsin. Snowfall from the system extends from Michigan west to Montana, Idaho, Utah and Arizona. A mix of rain and snow also stretches into the Ohio and Tennessee valleys, and it is all moving east. This system appears to be as large as 1/3rd of the Continental U.S.

Meanwhile, in another hemisphere on the other side of the world a huge tropical cyclone threatens parts of Australia that has already been suffering from flooding.

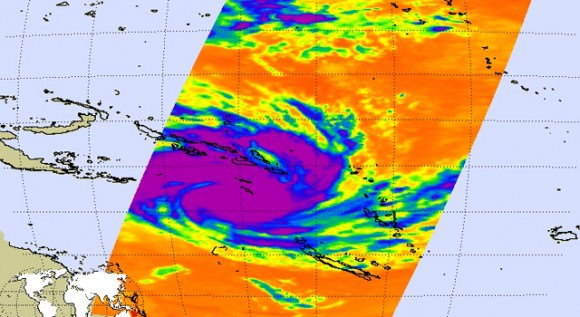
of Tropical Cyclone Yasi taken at 6:29 a.m. PST (9:29 a.m. EST) on Jan. 31, 2011. Areas colored purple represent the storm's coldest cloud-top temperatures and areas of heaviest precipitation. Image credit: NASA/JPL-Caltech

The northeastern Australian state of Queensland is now bracing for what could become one of the largest tropical cyclones the state has ever seen.

The Atmospheric Infrared Sounder (AIRS) instrument on NASA’s Aqua satellite captured this infrared image of Yasi on Jan. 31, 2011, at 6:29 a.m. PST (9:29 a.m. EST). The AIRS data create an accurate 3-D map of atmospheric temperature, water vapor and clouds, data that are useful to forecasters. The image shows the temperature of Yasi’s cloud tops or the surface of Earth in cloud-free regions.

The coldest cloud-top temperatures appear in purple, indicating towering cold clouds and heavy precipitation. The infrared signal of AIRS does not penetrate through clouds. Where there are no clouds, AIRS reads the infrared signal from the surface of the ocean waters, revealing warmer temperatures in orange and red.

At the approximate time this image was taken, Yasi had maximum sustained winds near 90 knots (166 kilometers per hour, or 103 mph), equivalent to a Category Two hurricane on the Saffir-Simpson Scale. It was centered about 1,400 kilometers (875 miles) east of Cairns, Australia, moving west at about 19 knots per hour (35 kilometers per hour, or 22 mph). Cyclone-force winds extend out to 48 kilometers (30 miles) from the center.

Yasi is forecast to move west, then southwestward, into an area of low vertical wind shear (strong wind shear can weaken a storm). Forecasters at the Joint Typhoon Warning Center expect Yasi to continue to strengthen over the next 36 hours. The Center forecasts a landfall just south of Cairns as a large 100-plus knot-per-hour (185 kilometers per hour, or 115 mph) system by around midnight local time on Wednesday, Feb. 2.

Sources: JPL, NASA Earth Observatory

How Satellites Stay in Orbit

GPS Satellite
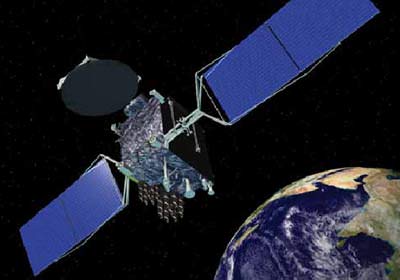
According to a new proposal, GPS satellites may be the key to finding dark matter. Credit: NASA

[/caption]
An artificial satellite is a marvel of technology and engineering. The only thing comparable to the feat in technological terms is the scientific know-how that goes into placing, and keeping, one in orbit around the Earth. Just consider what scientists need to understand in order to make this happen: first, there’s gravity, then a comprehensive knowledge of physics, and of course the nature of orbits themselves. So really, the question of How Satellites Stay in Orbit, is a multidisciplinary one that involves a great of technical and academic knowledge.

First, to understand how a satellite orbits the Earth, it is important to understand what orbit entails. Johann Kepler was the first to accurately describe the mathematical shape of the orbits of planets. Whereas the orbits of planets about the Sun and the Moon about the Earth were thought to be perfectly circular, Kepler stumbled onto the concept of elliptical orbits. In order for an object to stay in orbit around the Earth, it must have enough speed to retrace its path. This is as true of a natural satellite as it is of an artificial one. From Kepler’s discovery, scientists were also able to infer that the closer a satellite is to an object, the stronger the force of attraction, hence it must travel faster in order to maintain orbit.

Next comes an understanding of gravity itself. All objects possess a gravitational field, but it is only in the case of particularly large objects (i.e. planets) that this force is felt. In Earth’s case, the gravitational pull is calculated to 9.8 m/s2. However, that is a specific case at the surface of the planet. When calculating objects in orbit about the Earth, the formula v=(GM/R)1/2 applies, where v is velocity of the satellite, G is the gravitational constant, M is the mass of the planet, and R is the distance from the center of the Earth. Relying on this formula, we are able to see that the velocity required for orbit is equal to the square root of the distance from the object to the center of the Earth times the acceleration due to gravity at that distance. So if we wanted to put a satellite in a circular orbit at 500 km above the surface (what scientists would call a Low Earth Orbit LEO), it would need a speed of ((6.67 x 10-11 * 6.0 x 1024)/(6900000))1/2 or 7615.77 m/s. The greater the altitude, the less velocity is needed to maintain the orbit.

So really, a satellites ability to maintain its orbit comes down to a balance between two factors: its velocity (or the speed at which it would travel in a straight line), and the gravitational pull between the satellite and the planet it orbits. The higher the orbit, the less velocity is required. The nearer the orbit, the faster it must move to ensure that it does not fall back to Earth.

We have written many articles about satellites for Universe Today. Here’s an article about artificial satellites, and here’s an article about geosynchronous orbit.

If you’d like more info on satellites, check out these articles:
Orbital Objects
List of satellites in geostationary orbit

We’ve also recorded an episode of Astronomy Cast about the space shuttle. Listen here, Episode 127: The US Space Shuttle.

Sources:
http://en.wikipedia.org/wiki/Satellite
http://science.howstuffworks.com/satellite6.htm
http://www.bu.edu/satellite/classroom/lesson05-2.html
http://library.thinkquest.org/C007258/Keep_Orbit.htm#

It’s Alive! NanoSail-D Suddenly and Spontaneously Comes Back to Life

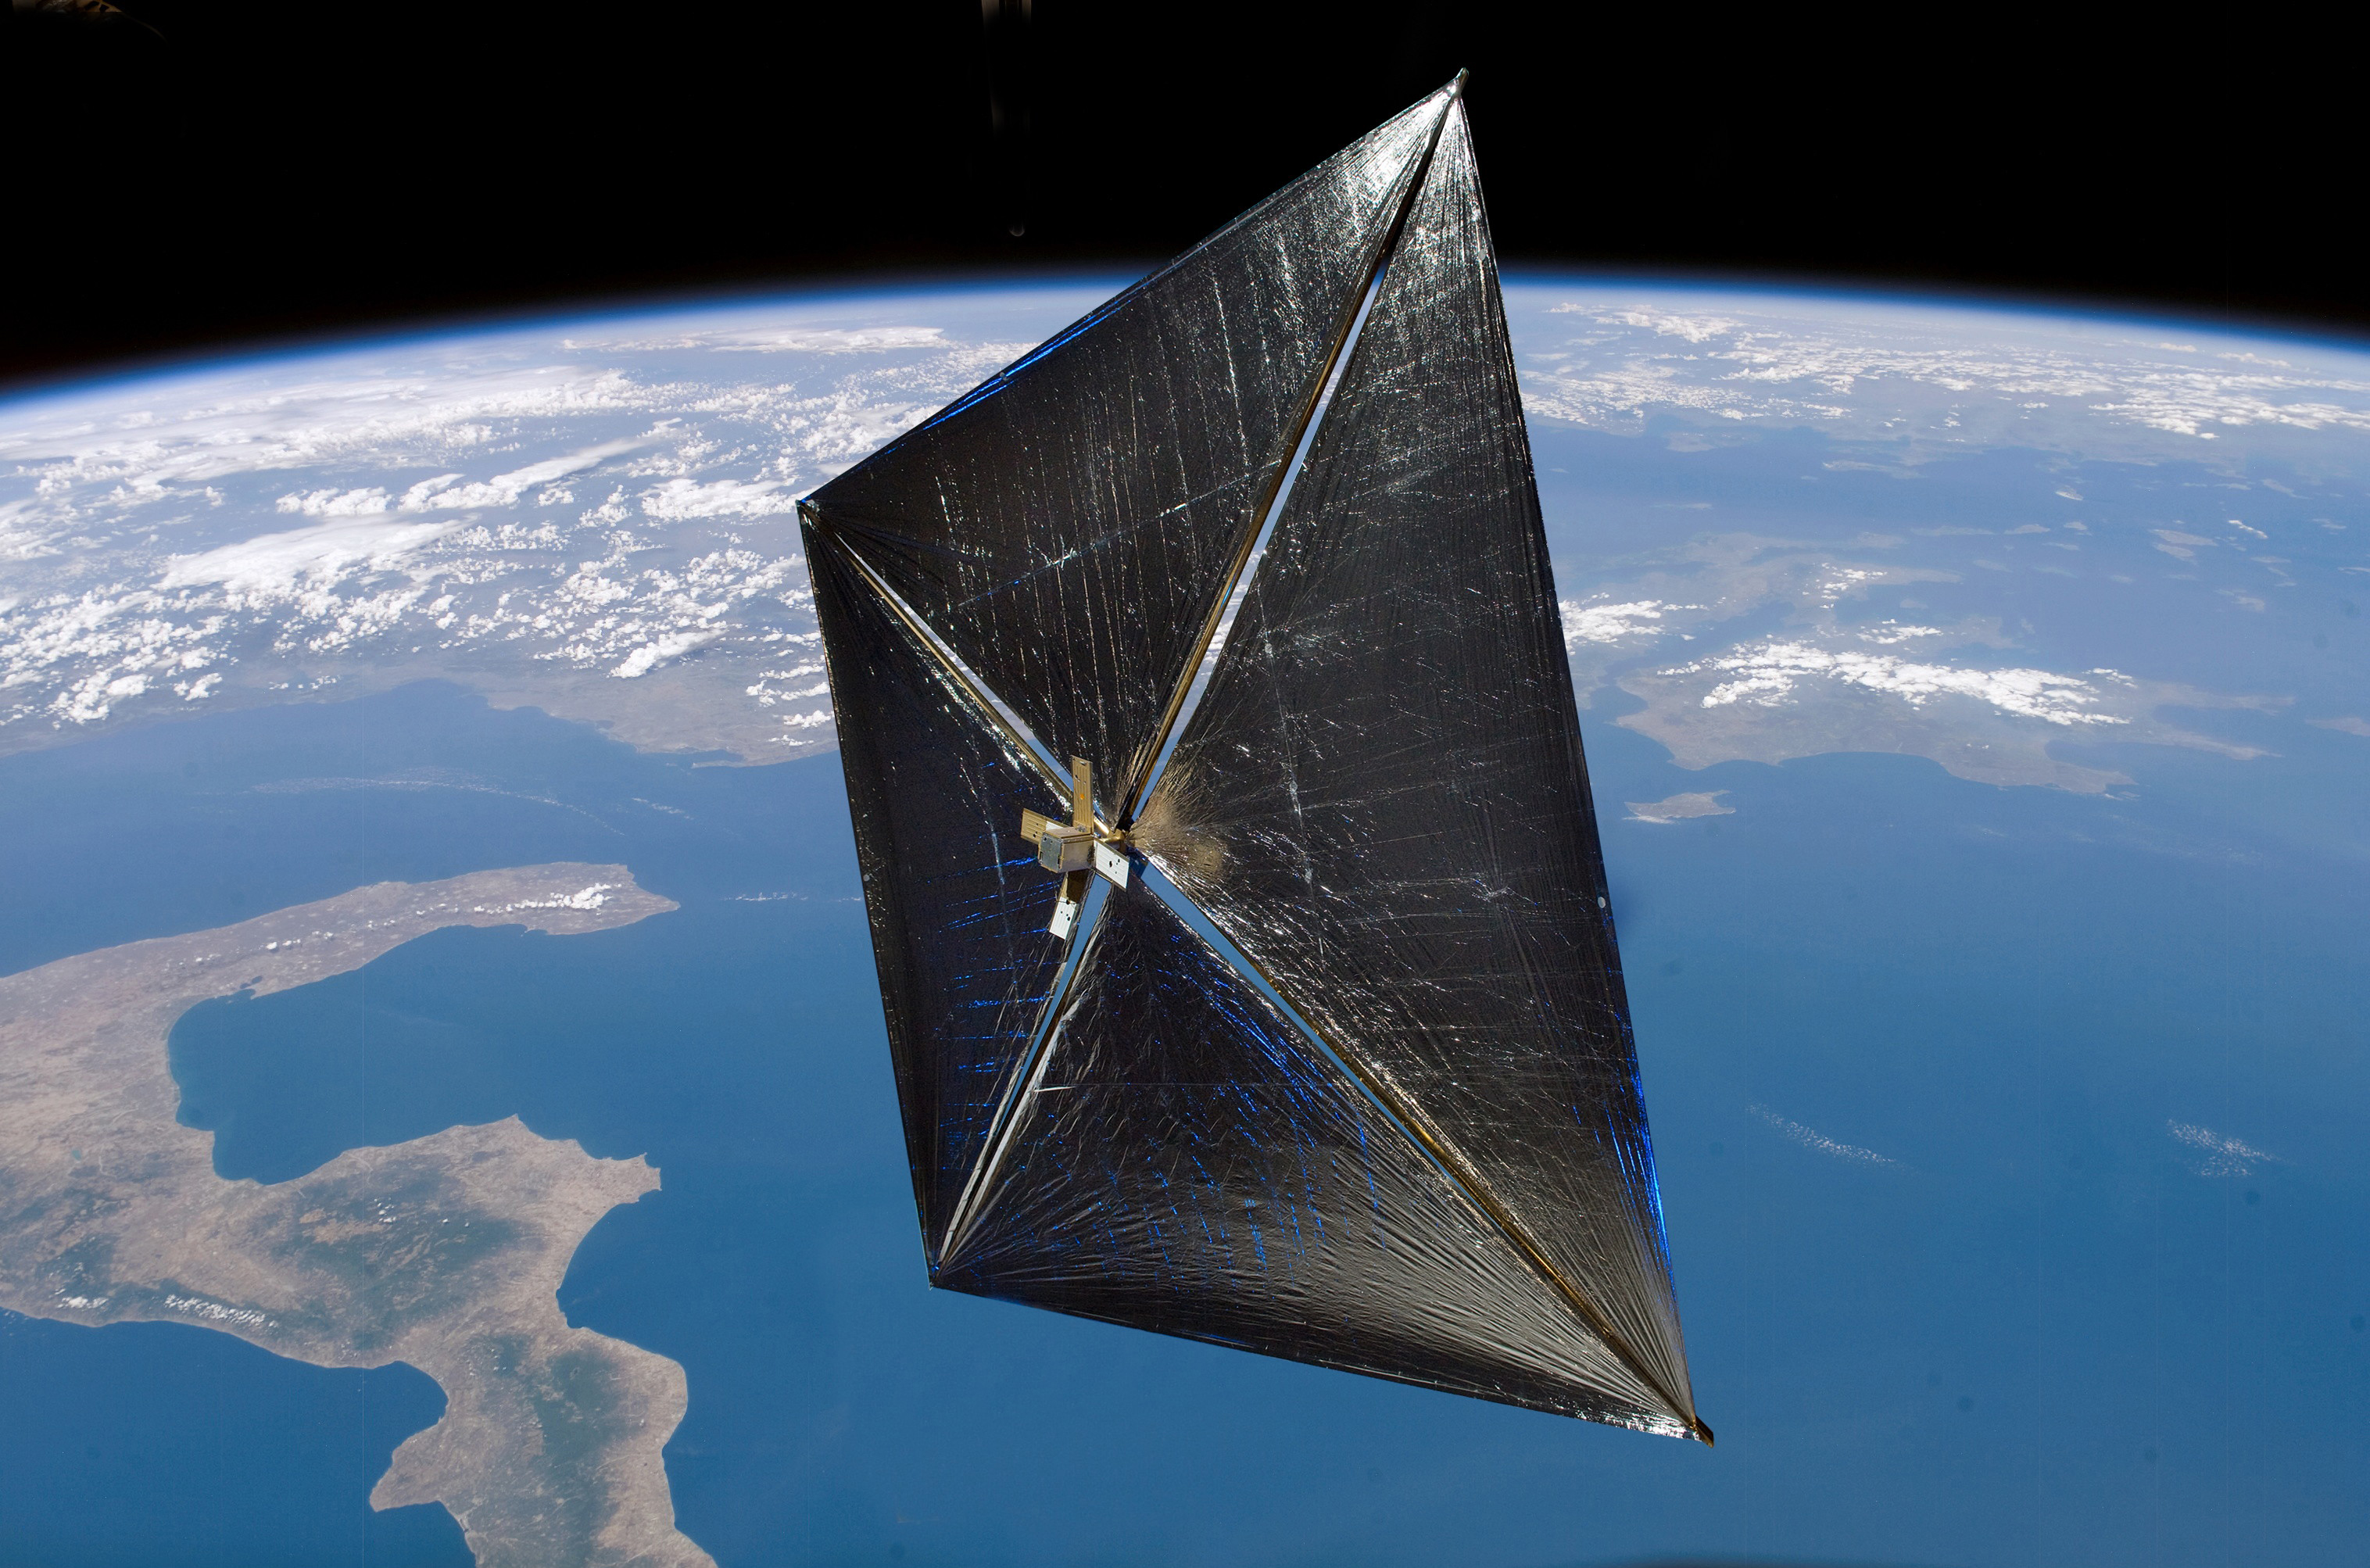
Artist concept of Nanosail-D in Earth orbit. Credit: NASA

[/caption]

A small solar sail that was thought to be a lost cause has “spontaneously” come back to life. The NanoSail-D — a NASA-designed solar sail cubesat that launched in December but suddenly went silent without confirmation of its deployment — unexpectedly ejected from its host satellite on Wednesday, Jan. 19 at 11:30 a.m. EST. Engineers at Marshall Space Flight Center confirmed that the NanoSail-D nanosatellite ejected from Fast Affordable Scientific and Technology Satellite, FASTSAT, when they looked at onboard FASTSAT telemetry. The ejection of NanoSail-D also has been confirmed by ground-based satellite tracking.

Now NASA is asking for help from ham radio operators to listen for the signal to verify NanoSail-D is operating. And knowing the status of the solar sail is time critical.

“This is great news for our team. We’re anxious to hear the beacon which tells us that NanoSail-D is healthy and operating as planned,” said Dean Alhorn, NanoSail-D principal investigator and aerospace engineer at the Marshall Center. “The science team is hopeful to see that NanoSail-D is operational and will be able to unfurl its solar sail.”

If you are a ham operator, This information should be sent to the NanoSail-D dashboard at: http://nanosaild.engr.scu.edu/dashboard.htm. The NanoSail-D beacon signal can be found at 437.270 MHz. You can learn more at the MSFC’s Ham Radio Operator’s webpage.

NanoSail-D was designed to test the potential for solar sails in atmospheric braking. On December 6, 2010, it was schedule to eject from the FASTSAT, and initially it looked as though it did. But later, ground controllers were unable to confirm if the solar sail had ejected or deployed. Further analysis showed no evidence of NanoSail-D in low-Earth orbit, leading the team to believe NanoSail-D remained inside FASTSAT.

Now, with this latest news that the loaf-of-bread-sized satellite has ejected on its own, the NanoSail-D science team is hopeful the nanosatellite is healthy and can complete its solar sail mission. But the sequence of events are time critical.

After ejection, a timer within NanoSail-D begins a three-day countdown as the satellite orbits the Earth. Once the timer reaches zero, four booms will quickly deploy and the NanoSail-D sail will start to unfold to a 100-square-foot polymer sail. Within five seconds the sail fully unfurls.

“We knew that the door opened and it was possible that NanoSail-D could eject on its own,” said Mark Boudreaux, FASTSAT project manager at the Marshall Center. “What a pleasant surprise this morning when our flight operations team confirmed that NanoSail-D is now a free flyer.”

If the deployment is successful, NanoSail-D will stay in low-Earth orbit between 70 and 120 days, depending on atmospheric conditions. NanoSail-D is designed to demonstrate deployment of a compact solar sail boom system that could lead to further development of this alternative solar sail propulsion technology and FASTSAT’s ability to eject a nano-satellite from a micro-satellite — while avoiding re-contact with the FASTSAT satellite bus.

Source: Marshall Space Flight Center

Palette Earth: Recent Artwork As Seen From Space

Phytoplankton bloom off of the Atlantic coast of Patagonia on December 21, 2010. NASA image created by Norman Kuring, Ocean Color Web. Instrument: Aqua - MODIS

[/caption]

The view from space of our home planet is often breathtaking and sobering. Lately, there has been a plethora of amazing images on NASA’s Earth Observatory website. Take the one above, for example. A swirling Van Gogh painting? No, phytoplankton blooming off of the Atlantic coast of Patagonia, and the swirls are created from two strong ocean currents stirring up a colorful brew of floating nutrients and microscopic plant life. Amazing that the tiny life joins together in huge assemblages that we can see from space. This image was taken on the southern hemisphere’s summer solstice on December 21, 2010. Scientists used seven separate different spectral bands to highlight the differences in the plankton communities across this swath of ocean.

Want more Earthly beauty? See below.

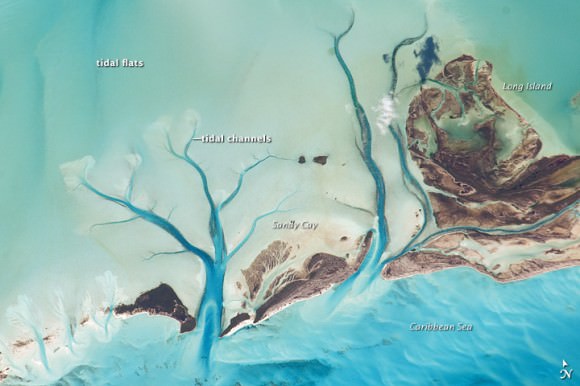
Tidal flats and channels in the Bahamas. Credit: NASA, astronaut photography from the ISS.

A giant dried rose laying across the ocean? No, this astronaut photograph provides a view of tidal flats and channels near Sandy Cay, on the western side of Long Island and along the eastern margin of the Great Bahama Bank. The continuously exposed parts of the island are brown, a result of soil formation and vegetation growth. To the north of Sandy Cay, an off-white tidal flat composed of carbonate sediments is visible; light blue-green regions indicate shallow water on the tidal flat. The tidal flow of seawater is concentrated through gaps in the land surface, leading to the formation of relatively deep channels that cut into the sediments. The channels and areas to the south of the island have a vivid blue color that indicates deeper water.

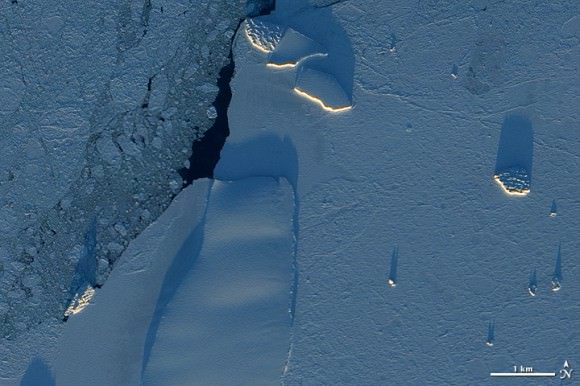
Antarctic icebergs. Credit: NASA; Instrument: EO-1 - ALI

While those of us in the northland have had long nights, Antarctica enjoys round-the-clock sunlight. The light arrives at a low angle, however, as the Sun makes a daily circuit around the horizon, and icebergs cast long shadows over the surrounding sea ice. This image, acquired on December 13, 2010, from the Advanced Land Imager (ALI) on NASA’s Earth Observing-1 (EO-1) satellite shows icebergs along the Princess Ragnhild Coast in East Antarctica. Besides distinguishing between icebergs and thinner ice, the low-angled Sun highlights the differences between the icebergs themselves.

The icebergs with rough surfaces likely broke off from the coast, far from this area, and spent time bobbing over the open ocean. Smooth icebergs likely originated in this area and have not yet traveled far.

For more great images, see NASA’s Earth Observatory website.

Ariane 5 Rocket Lifts Off for Final Launch of 2010

One final rocket launch in 2010 took place as Arianespace successfully launched the Hispasat 1E and KOREASAT 6 telecommunication satellites aboard an Ariane 5 ECA rocket from the Kourou spaceport in French Guiana. Liftoff was at 4:27 p.m. EST (21:27 GMT).

KOREASAT 6 is a commercial telecommunications satellite of the KT Corporation of the Republic of Korea and was built by Orbital Sciences Corporation. Hispasat 1E is a telecommunications satellite designed to expand Hispasat’s coverage in Europe, the Americas, and North Africa.

This is the sixth and final flight of the year for Arianespace’s heavy-lift rocket.

SOHO Finds Its 2000th Comet

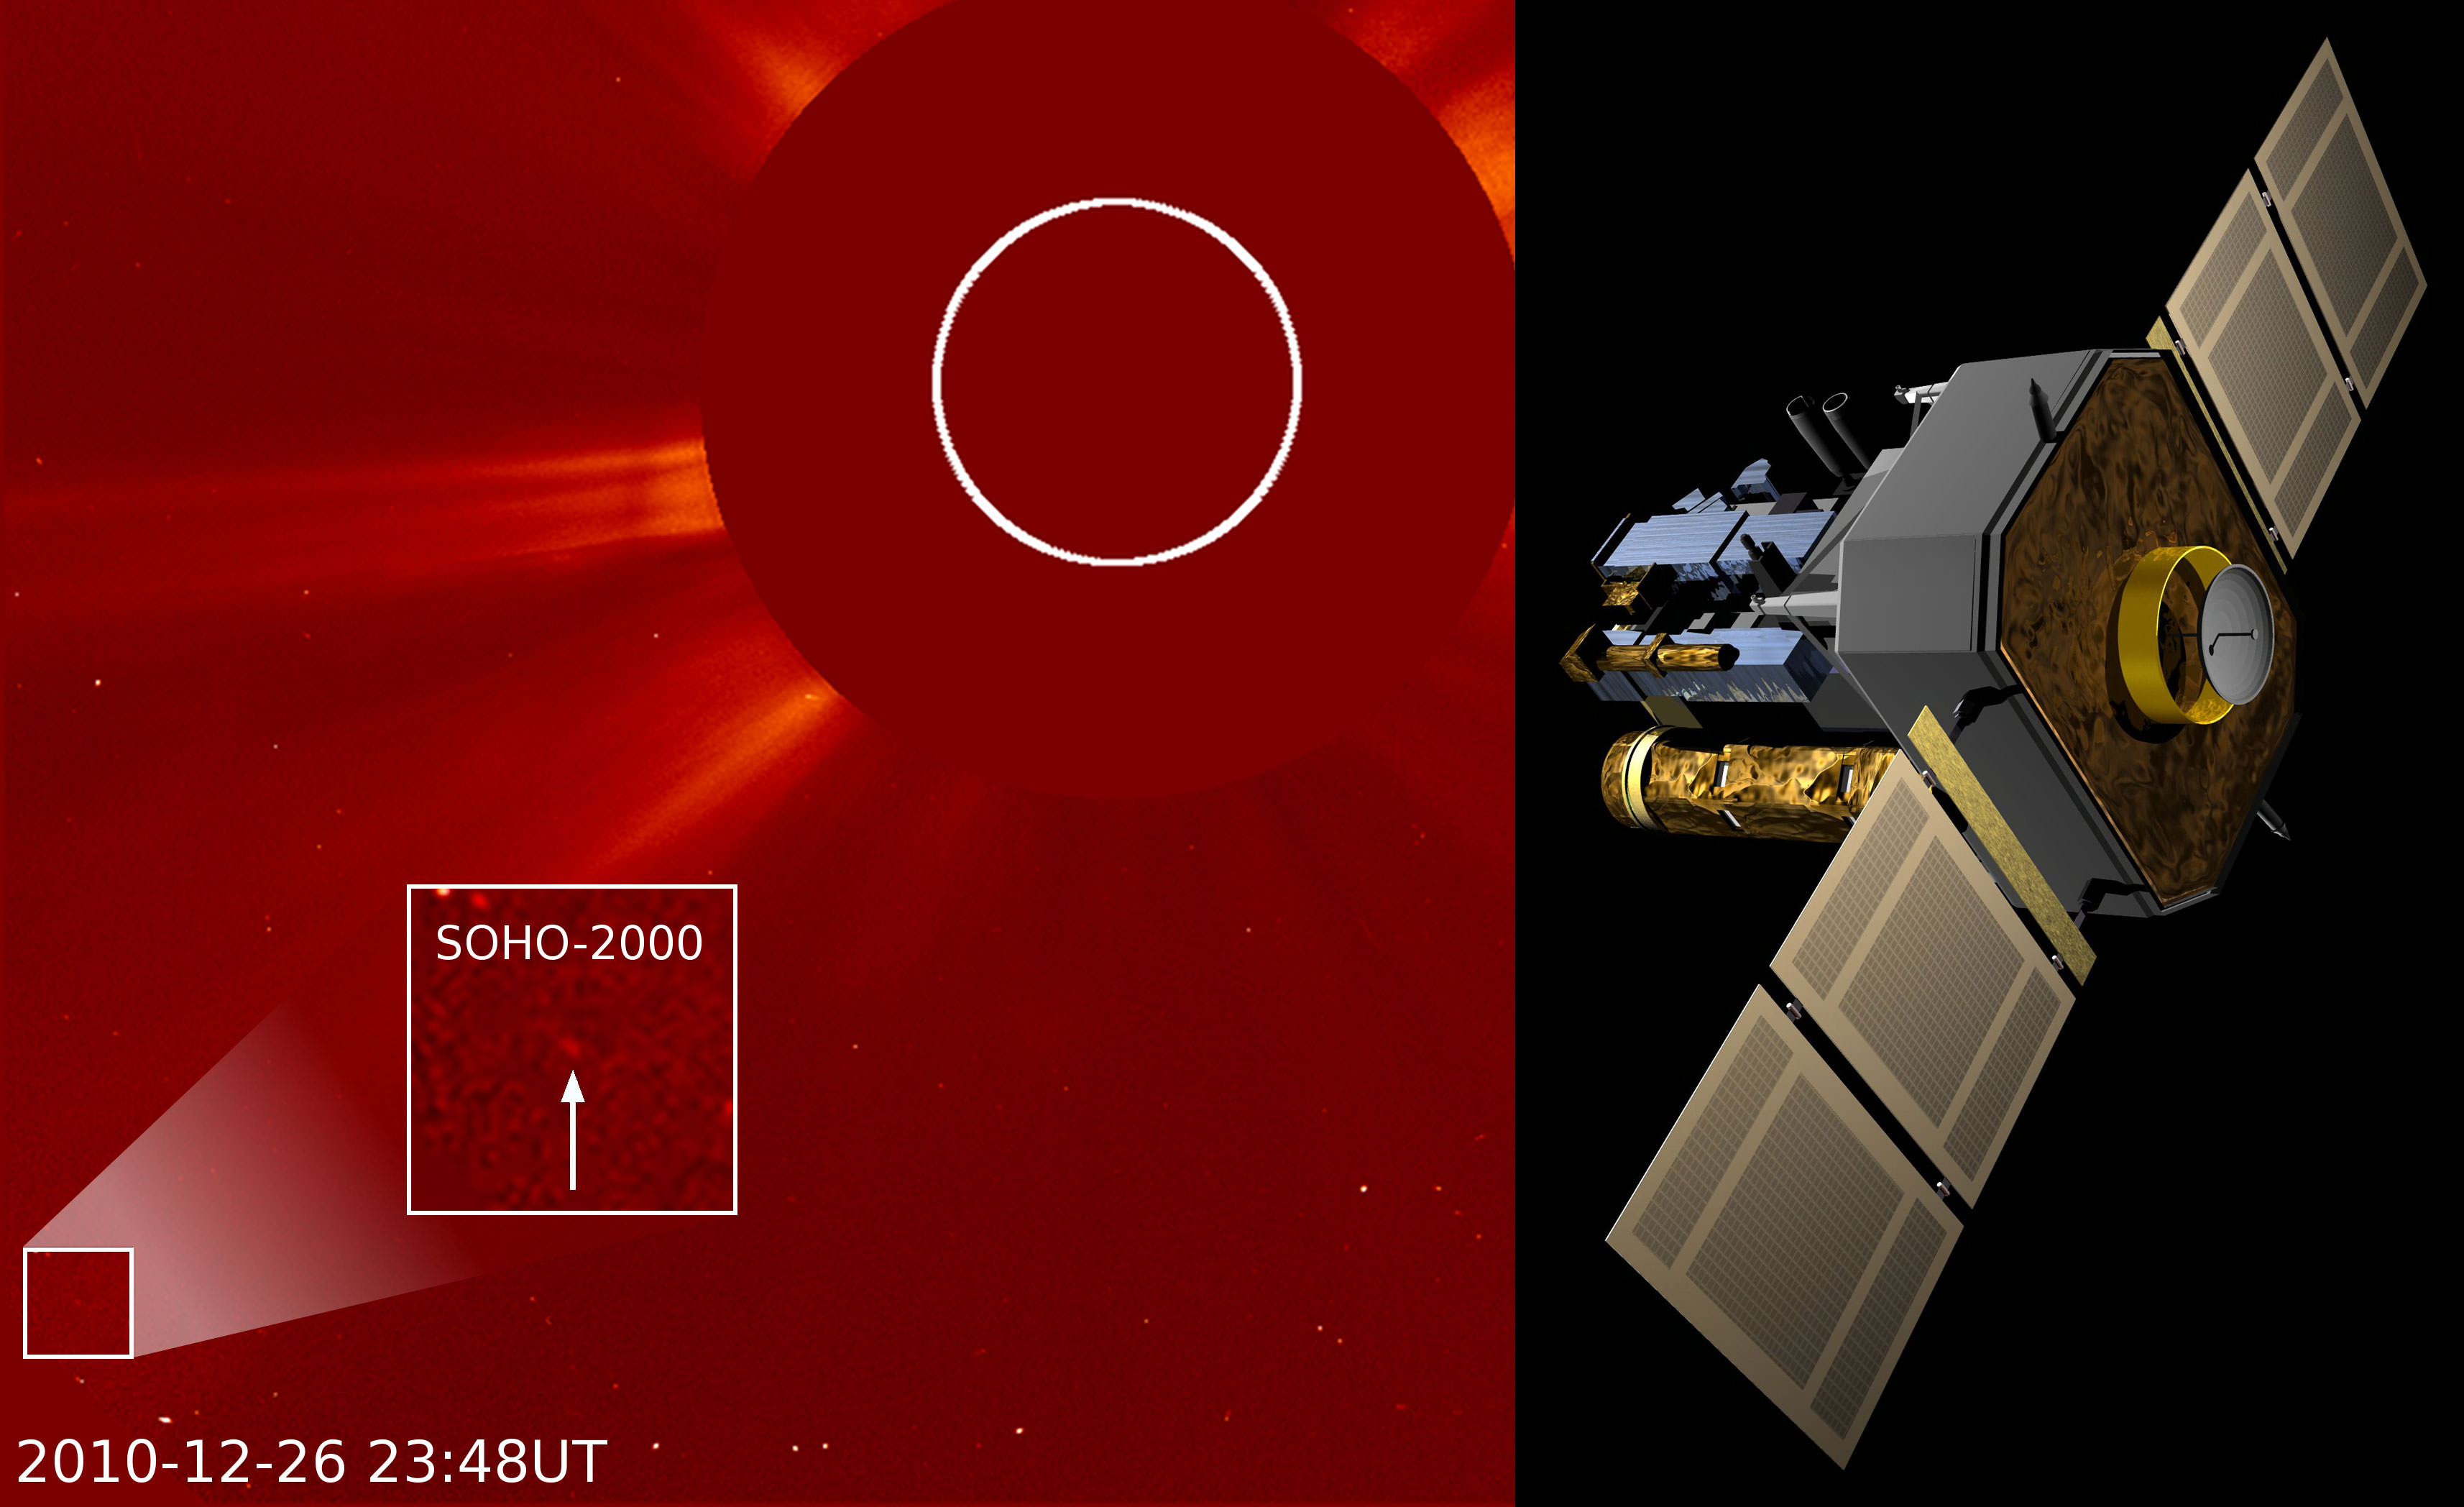
Image Left: SOHO's 2000th comet, spotted by a Polish amateur astronomer on December 26, 2010. Credit: SOHO/Karl Battams. Image Right: In 15 years since it launched in December 1995, the SOHO spacecraft, has doubled the number of comets sighted in the three hundred years previously. Credit: NASA/ESA/Alex Lutkus

[/caption]

From a NASA Press Release:

As people on Earth celebrate the holidays and prepare to ring in the New Year, an ESA/NASA spacecraft has quietly reached its own milestone: on December 26, the Solar and Heliospheric Observatory (SOHO) discovered its 2000th comet.

Drawing on help from citizen scientists around the world, SOHO has become the single greatest comet finder of all time. This is all the more impressive since SOHO was not specifically designed to find comets, but to monitor the sun.

“Since it launched on December 2, 1995 to observe the sun, SOHO has more than doubled the number of comets for which orbits have been determined over the last three hundred years,” says Joe Gurman, the U.S. project scientist for SOHO at NASA’s Goddard Space Flight Center in Greenbelt, Md.

Of course, it is not SOHO itself that discovers the comets — that is the province of the dozens of amateur astronomer volunteers who daily pore over the fuzzy lights dancing across the pictures produced by SOHO’s LASCO (or Large Angle and Spectrometric Coronagraph) cameras. Over 70 people representing 18 different countries have helped spot comets over the last 15 years by searching through the publicly available SOHO images online.

The 1999th and 2000th comet were both discovered on December 26 by Michal Kusiak, an astronomy student at Jagiellonian University in Krakow, Poland. Kusiak found his first SOHO comet in November 2007 and has since found more than 100.

“There are a lot of people who do it,” says Karl Battams who has been in charge of running the SOHO comet-sighting website since 2003 for the Naval Research Lab in Washington, where he also does computer processing for LASCO. “They do it for free, they’re extremely thorough, and if it wasn’t for these people, most of this stuff would never see the light of day.”

Battams receives reports from people who think that one of the spots in SOHO’s LASCO images looks to be the correct size and brightness and headed for the sun – characteristics typical of the comets SOHO finds. He confirms the finding, gives each comet an unofficial number, and then sends the information off to the Minor Planet Center in Cambridge, Mass, which categorizes small astronomical bodies and their orbits.

It took SOHO ten years to spot its first thousand comets, but only five more to find the next thousand. That’s due partly to increased participation from comet hunters and work done to optimize the images for comet-sighting, but also due to an unexplained systematic increase in the number of comets around the sun. Indeed, December alone has seen an unprecedented 37 new comets spotted so far, a number high enough to qualify as a “comet storm.”

LASCO was not designed primarily to spot comets. The LASCO camera blocks out the brightest part of the sun in order to better watch emissions in the sun’s much fainter outer atmosphere, or corona. LASCO’s comet finding skills are a natural side effect — with the sun blocked, it’s also much easier to see dimmer objects such as comets.

“But there is definitely a lot of science that comes with these comets,” says Battams. “First, now we know there are far more comets in the inner solar system than we were previously aware of, and that can tell us a lot about where such things come from and how they’re formed originally and break up. We can tell that a lot of these comets all have a common origin.” Indeed, says Battams, a full 85% of the comets discovered with LASCO are thought to come from a single group known as the Kreutz family, believed to be the remnants of a single large comet that broke up several hundred years ago.

The Kreutz family comets are “sungrazers” – bodies whose orbits approach so near the Sun that most are vaporized within hours of discovery – but many of the other LASCO comets boomerang around the sun and return periodically. One frequent visitor is comet 96P Machholz. Orbiting the sun approximately every six years, this comet has now been seen by SOHO three times.

SOHO is a cooperative project between the European Space Agency (ESA) and NASA. The spacecraft was built in Europe for ESA and equipped with instruments by teams of scientists in Europe and the USA.

For more information see the SOHO website. .

See SOHO realtime data.

Zombie Satellite Now Under Control

Artist concept of the Galaxy 15 satellite in orbit. Credit: Orbital Sciences.

[/caption]

A geostationary satellite that become a “zombie” earlier this year and stopped communicating with ground controllers has now finally been reset and is under control. The Galaxy 15 communications satellite had its “brains fried” by a solar flare and went rogue in early May. Although it was still functional, its navigation and communications systems would not accept commands, and the satellite drifted out of its orbit. On December 23, 2010, engineers at the company Intelsat were finally able to command the unit to reset after a battery drained. Shortly thereafter Galaxy 15 began accepting commands, and then was put into safe mode. “We are pleased to report it no longer poses any threat of satellite interference to either neighboring satellites or customer services,” IntelSat said on their website.

While there was little chance that Galaxy 15 would crash into another satellite, it caused some problems when it entered an orbital space occupied by other satellites and “stole” their signal, thereby interrupting other vendor’s services to customers on Earth.

Engineers will now do some diagnostic tests and load updated commanding software to the satellite.

“We expect to relocate the satellite to an Intelsat orbital location where engineers at our Satellite Operations Control Center will initiate extensive in-orbit testing to determine the functionality of every aspect of the spacecraft,” Intelsat said.

The satellite is currently pointed towards the Sun, allowing the spacecraft’s batteries to become fully charged and the satellite thermally balanced.

Once initial diagnostic testing has been completed, IntelSat will attempt to stop the drift of the satellite. This phase could take as long as two weeks to complete.

Intelsat is hoping full functionality of Galaxy 15 can be regained and they hope to relocate the satellite to an orbital location where we they can assess the viability of the payload, and conduct extensive in-orbit testing to determine the functionality of every aspect of the spacecraft.

Source: Intelsat

Video: Satellite Views of the “Christmas Blizzard”

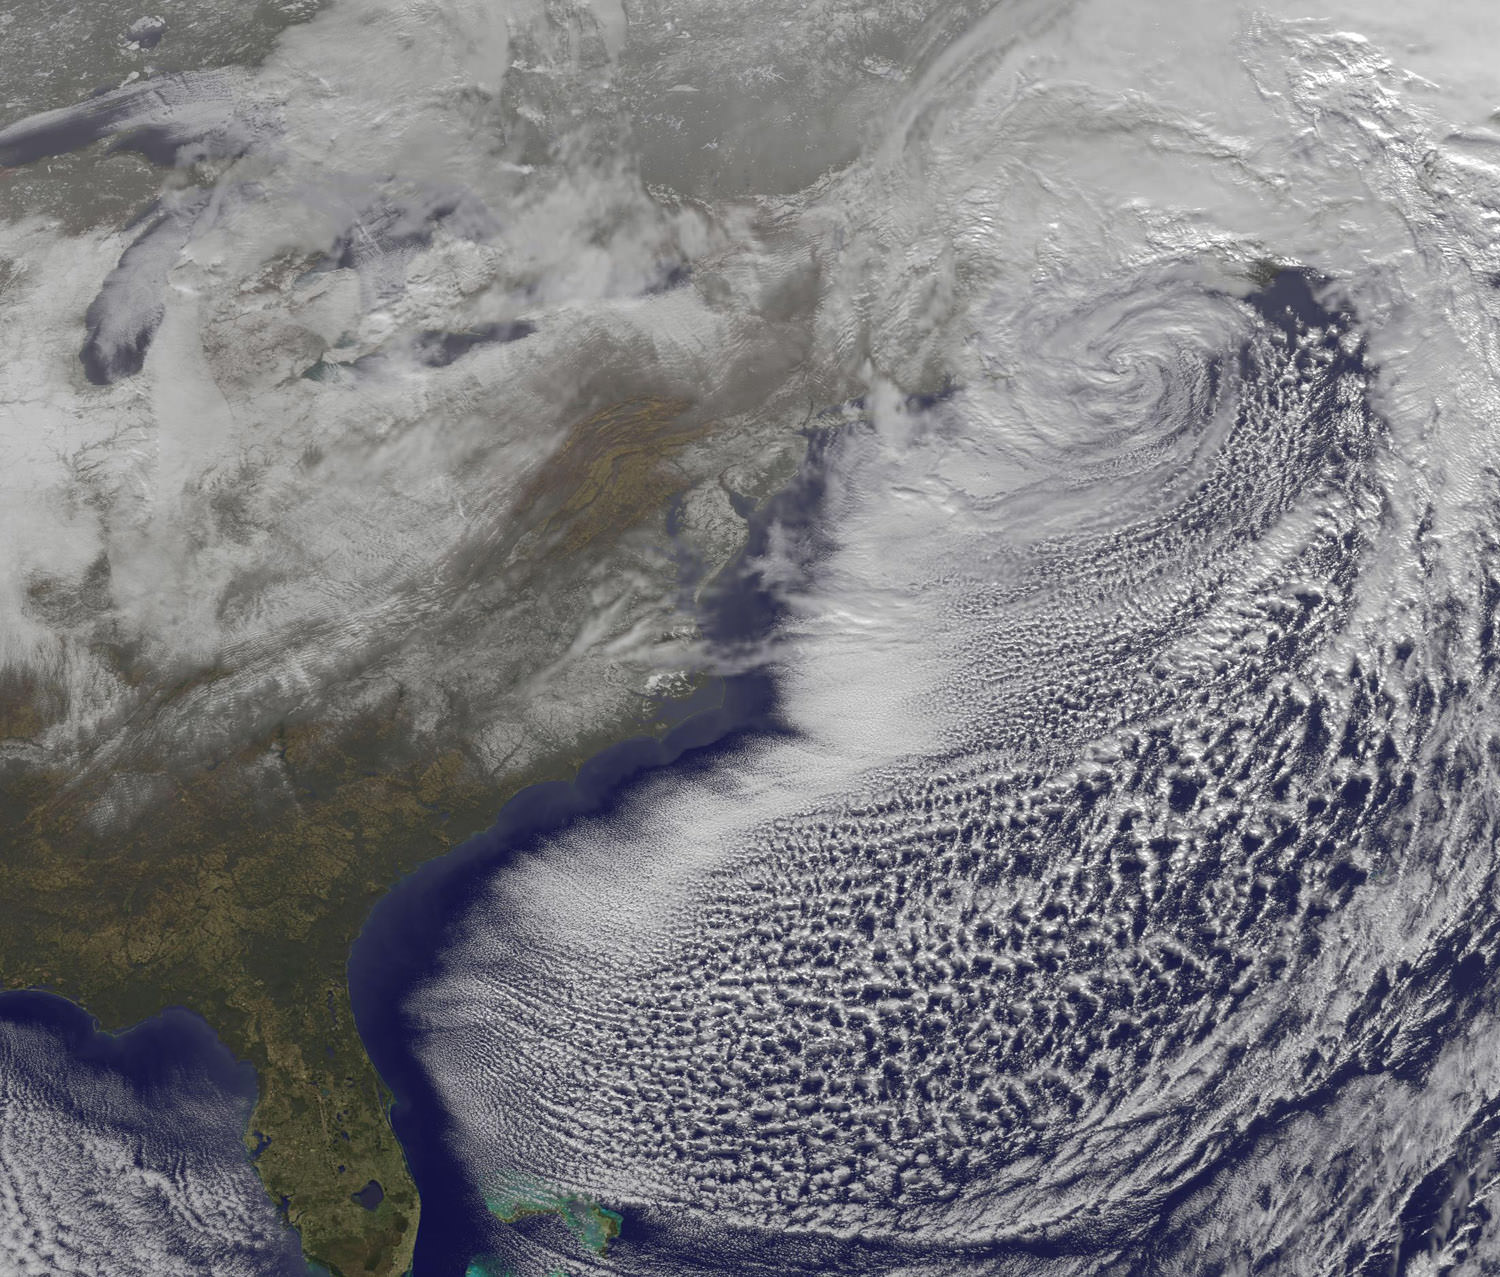
On Monday, Dec. 27 at 1731 UTC (12:31 p.m. EST) the GOES-13 satellite captured this visible image of the powerful low pressure system that brought snows from Georgia to Maine along the US east coast. Some of the snowfall can be seen over South and North Carolina, Virginia, Maryland, Delaware, eastern Pennsylvania, New Jersey and southeastern New York. The clouds of the low obscure New England in the image. Credit: NOAA/NASA GOES Project

The Christmas Blizzard of 2010 dumped up to 30 inches of snow in the northeast United States, with winds gusts up to 60 mph. An Earth-orbiting satellite, GOES-13 captured a series of visible images of the storm, showing its progression. News reports from New York City say this is the sixth largest snowstorm in the city’s history and it buried the streets in four-foot drifts, bringing transit to a halt with cars and buses stranded in the streets.

Snowfall ranged from 1.5 inches in Atlanta, Georgia to more than two feet in various areas of New Jersey, New York and the New England states.

[/caption]

Some of those snows are visible in the above GOES-13 satellite image. Snowfall on the ground can be seen in the image over South and North Carolina, Virginia, Maryland, Delaware, eastern Pennsylvania, New Jersey, and southeastern New York. The clouds of the low obscure New England in the image.

Photographer Michael Black took an amazing timelapse of the blizzard, with a Canon DLSR on tripod with remote timer taking a photo once every five minutes (approximately 20 hours in 40 seconds.) — and obviously having to go outside and readjust the clock and markers.

December 2010 Blizzard Timelapse from Michael Black on Vimeo.