Living with a Capricious Star: What Drives the Solar Cycle?

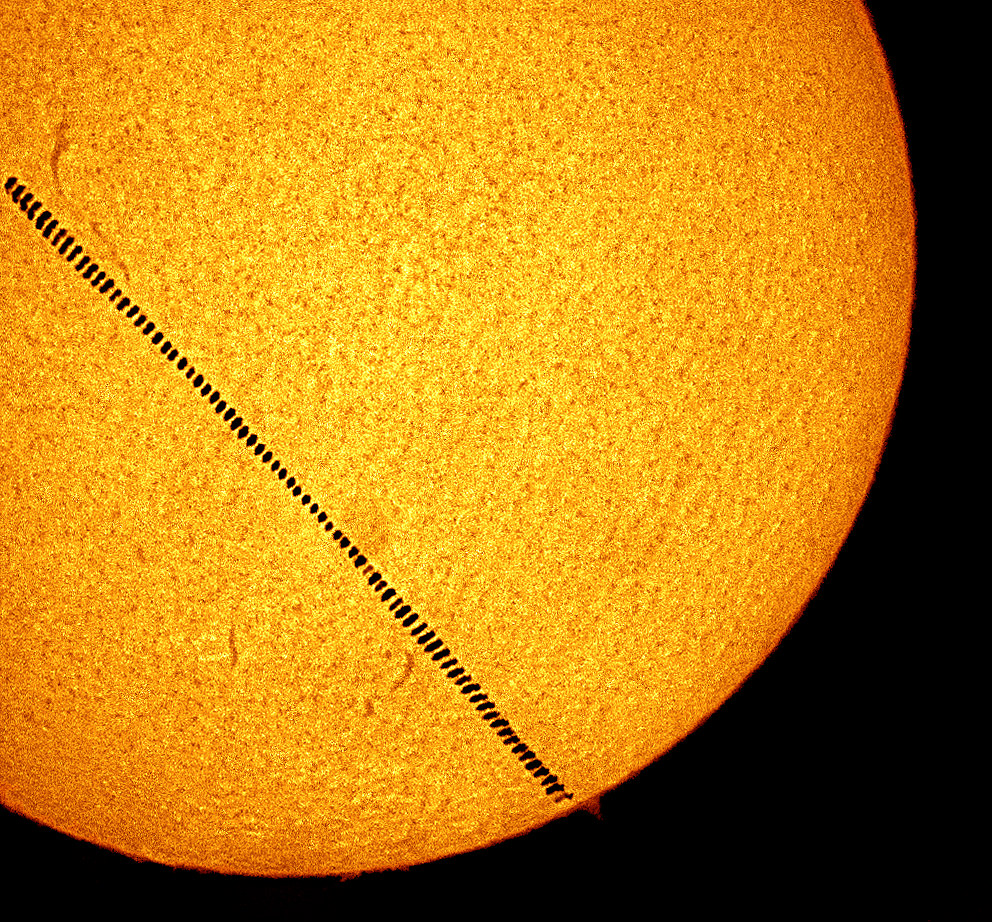
Solar energy energizes the drama of life on Earth, such as the bird caught transiting the solar disk as seen here. Image credit and copyright: Roger Hutchinson

You can be thankful that we bask in the glow of a relatively placid star. Currently about halfway along its 10 billion year career on the Main Sequence, our Sun fuses hydrogen into helium in a battle against gravitational collapse. This balancing act produces energy via the proton-proton chain process, which in turn, fuels the drama of life on Earth.

Looking out into the universe, we see stars that are much more brash and impulsive, such as red dwarf upstarts unleashing huge planet-sterilizing flares, and massive stars destined to live fast and die young.

Our Sun gives us the unprecedented chance to study a star up close, and our modern day technological society depends on keeping a close watch on what the Sun might do next. But did you know that some of the key mechanisms powering the solar cycle are still not completely understood?
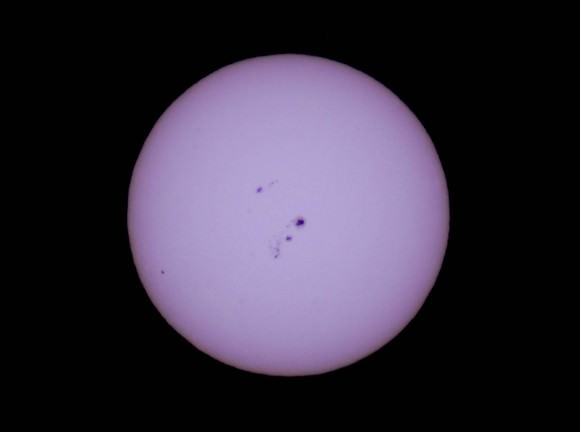
Image credit: David Dickinson
One of the exceptionally active sunspot groups seen for Cycle #24 in early 2014. Image credit: David Dickinson

One such mystery confronting solar dynamics is exactly what drives the periodicity related to the solar cycle. Follow our star with a backyard telescope over a period of years, and you’ll see sunspots ebb and flow in an 11 year period of activity. The dazzling ‘surface’ of the Sun where these spots are embedded is actually the photosphere, and using a small telescope tuned to hydrogen-alpha wavelengths you can pick up prominences in the warmer chromosphere above.

This cycle is actually is 22 years in length (that’s 11 years times two), as the Sun flips polarity each time. A hallmark of the start of each solar cycle is the appearance of sunspots at high solar latitudes, which then move closer to the solar equator as the cycle progresses. You can actually chart this distribution in a butterfly diagram known as a Spörer chart, and this pattern was first recognized by Gustav Spörer in the late 19th century and is known as Spörer’s Law.

Sunspot_butterfly_graph
The ‘Butterfly diagram’ of sunspot distribution by latitude over previous solar cycles. Image credit: NASA/Marshall Spaceflight Center

We’re currently in the midst of solar cycle #24, and the measurement of solar cycles dates all the way back to 1755. Galileo observed sunspots via projection (the tale that he went blind observing the Sun in apocryphal). We also have Chinese records going back to 364 BC, though historical records of sunspot activity are, well, spotty at best. The infamous Maunder Minimum occurred from 1645 to 1717 just as the age of telescopic astronomy was gaining steam. This dearth of sunspot activity actually led to the idea that sunspots were a mythical creation by astronomers of the time.

But sunspots are a true reality. Spots can grow larger than the Earth, such as sunspot active region 2192, which appeared just before a partial solar eclipse in 2014 and could be seen with the unaided (protected) eye. The Sun is actually a big ball of gas, and the equatorial regions rotate once every 25 days, 9 days faster than the rotational period near the poles. And speaking of which, it is not fully understood why we never see sunspots at the solar poles, which are tipped 7.25 degrees relative to the ecliptic.

Other solar mysteries persist. One amazing fact about our Sun is the true age of the sunlight shining in our living room window. Though it raced from the convective zone and through the photosphere of the Sun at 300,000 km per second and only took 8 minutes to get to your sunbeam-loving cat here on Earth, it took an estimated 10,000 to 170,000 years to escape the solar core where fusion is taking place. This is due to the terrific density at the Sun’s center, over seven times that of gold.

Another amazing fact is that we can actually model the happenings on the farside of the Sun utilizing a new fangled method known as helioseismology.

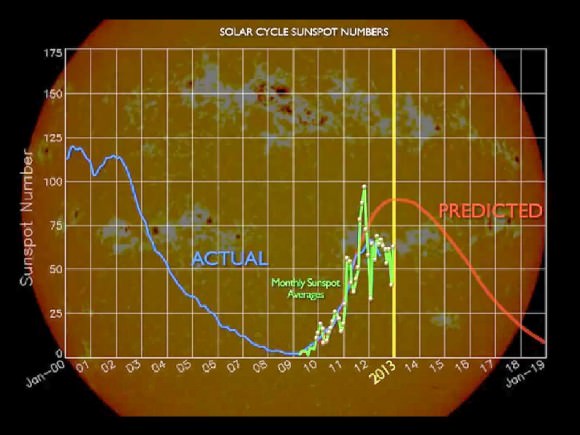
Another key mystery is why the current solar cycle is so weak… it has even been proposed that solar cycle 25 and 26 might be absent all together. Are there larger solar cycles waiting discovery? Again, we haven’t been watching the Sun close enough for long enough to truly ferret these ‘Grand Cycles’ out.
Solar cycle
The sunspot number predicted for the current Cycle #24 versus reality. Image credit: NASA

Are sunspot numbers telling us the whole picture? Sunspot numbers are calculated using formula that includes a visual count of sunspot groups and the individual sunspots in them that are currently facing Earthward, and has long served as the gold standard to gauge solar activity. Research conducted by the University of Michigan in Ann Arbor in 2013 has suggested that the orientation of the heliospheric current sheet might actually provide a better picture as to the goings on of the Sun.

Another major mystery is why the Sun has this 22/11 year cycle of activity in the first place. The differential rotation of the solar interior and convective zone known as the solar tachocline drives the powerful solar dynamo.  But why the activity cycle is the exact length that it is is still anyone’s guess. Perhaps the fossil field of the Sun was simply ‘frozen’ in the current cycle as we see it today.

There are ideas out there that Jupiter drives the solar cycle. A 2012 paper suggested just that. It’s an enticing theory for sure, as Jupiter orbits the Sun once every 11.9 years.
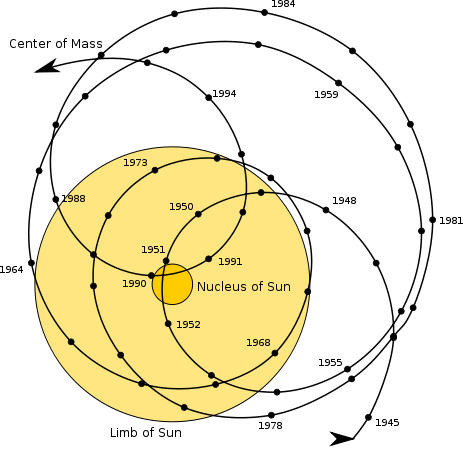
The motion of the solar barycenter through the last half of the 20th century. Image credit: Carl Smith/Wikimedia Commons

And a recent paper has even proposed that Uranus and Neptune might drive much longer cycles…

Color us skeptical on these ideas. Although Jupiter accounts for over 70% of the planetary mass in the solar system, it’s 1/1000th as massive as the Sun. The barycenter of Jupiter versus the Sun sits 36,000 kilometres above the solar surface, tugging the Sun at a rate of 12.4 metres per second.
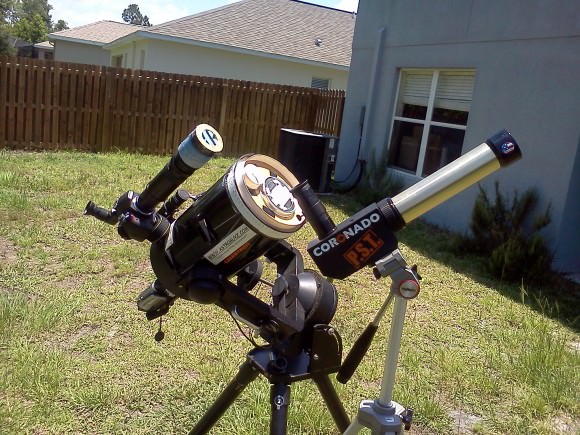
Rigs to view the Sun in both hydrogen-alpha and visible light. Credit: David Dickinson

I suspect this is a case of coincidence: the solar system provides lots of orbital periods of varying lengths, offering up lots of chances for possible mutual occurrences. A similar mathematical curiosity can be seen in Bode’s Law describing the mathematical spacing of the planets, which to date, has no known basis in reality. It appears to be just a neat play on numbers. Roll the cosmic dice long enough, and coincidences will occur. A good test for both ideas would be the discovery of similar relationships in other planetary systems. We can currently detect both starspots and large exoplanets: is there a similar link between stellar activity and exoplanet orbits? Demonstrate it dozens of times over, and a theory could become law.

That’s science, baby.

RAISE: How to Capture 1,500 Solar Images in a Five Minute Flight

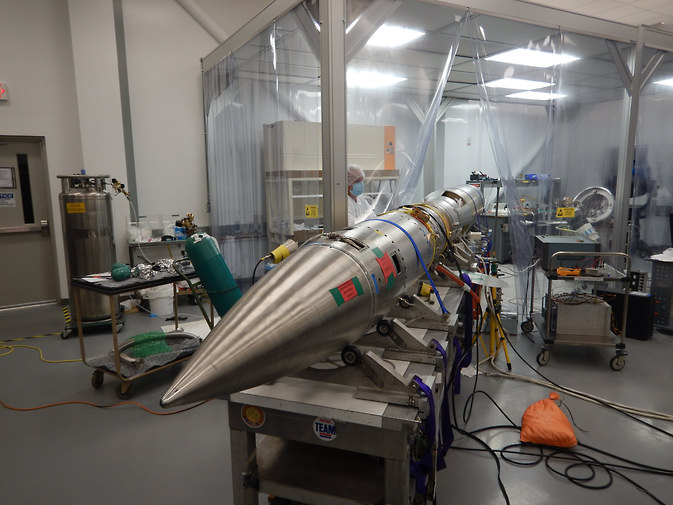
RAISE in the cleanroom prior to launch. Credit: NASA/RAISE.

Quick: how do you aim an instrument at the Sun from a moving rocket on a fifteen minute suborbital flight?

The answer is very carefully, and NASA plans to do just that today, Thursday, November 6th as the Rapid Acquisition Imaging Spectrograph Experiment, also known as RAISE, takes to the skies over White Sands, New Mexico, to briefly study the Sun.

Capturing five images per second, RAISE is expected to gather over 1,500 images during five minutes of data collection near apogee.

Why use sub-orbital sounding rockets to do observations of the Sun? Don’t we already have an armada of space and ground-based instruments to accomplish this that stare at our nearest star around the clock? Well, it turns out that sounding rockets are still cost-effective means of testing and demonstrating new technologies.

“Even on a five-minute flight, there are niche areas of science we can focus on well,” said solar scientist Don Hassler of the Southwest Research Institute in Boulder, Colorado in a recent press release. “There are areas of the Sun that need to be examined with the high-cadence observations that we can provide.”

Indeed, there’s a long history of studying the Sun by use of high-altitude sounding rockets, starting with the detection of solar X-rays by a detector placed in a captured V-2 rocket launched from White Sands in 1949.

Credit: NASA.
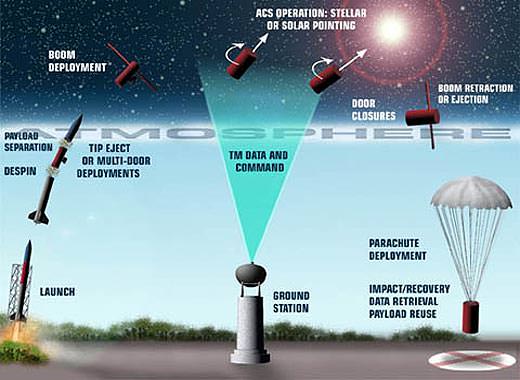
Sub-orbital astronomy in 5 minutes: the flight of a sounding rocket. Credit: NASA.

RAISE will actually scrutinize an active region of the Sun turned Earthward during its brief flight to create what’s known as a spectrogram, or an analysis of solar activity at differing wavelengths. This gives scientists a three dimensional layered snapshot of solar activity, as different wavelengths correspond to varying velocities of solar material and wavelengths. Think of looking at layers of cake. This, in turn, paints a picture of how material is circulated and moved around the surface of the Sun.

This will be RAISE’s second flight, and this week’s launch will sport a brand new diffraction grating coated with boron carbide to enhance wavelength analysis. RAISE will also look at the Sun in the extreme ultraviolet which cannot penetrate the Earth’s lower atmosphere. Technology pioneered by missions such as RAISE may also make its way into space permanently on future missions, such as the planned European Space Agency and NASA joint Solar Orbiter Mission, set for launch in 2017. The Solar Orbit Mission will study the Sun close up and personal, journeying only 26 million miles or 43 million kilometres from its surface, well inside the perihelion of the planet Mercury.

“This is the second time we have flown a RAISE payload, and we keep improving it along the way,” Hassler continued. “This is a technology that is maturing relatively quickly.”

As you can imagine, RAISE relies on clear weather for a window to launch. RAISE was scrubbed for launch on November 3rd, and the current window for launch is set for 2:07 PM EST/19:07 Universal Time, which is 12:07 PM MST local time at White Sands. Unlike the suborbital launches from Wallops Island, the White Sands launches aren’t generally carried live, though they tend to shut down US highway 70 between Las Cruces and Alamogordo that bisects White Sands just prior to launch.

Currently, the largest sunspot turned forward towards the Earth is active region 2205.

Another recent mission lofted by a sounding rocket to observe the Sun dubbed Hi-C was highly successful during its short flight in 2013.

RAISE will fly on a Black Brant sounding rocket, which typically reaches an apogee of 180 miles or 300 kilometres.

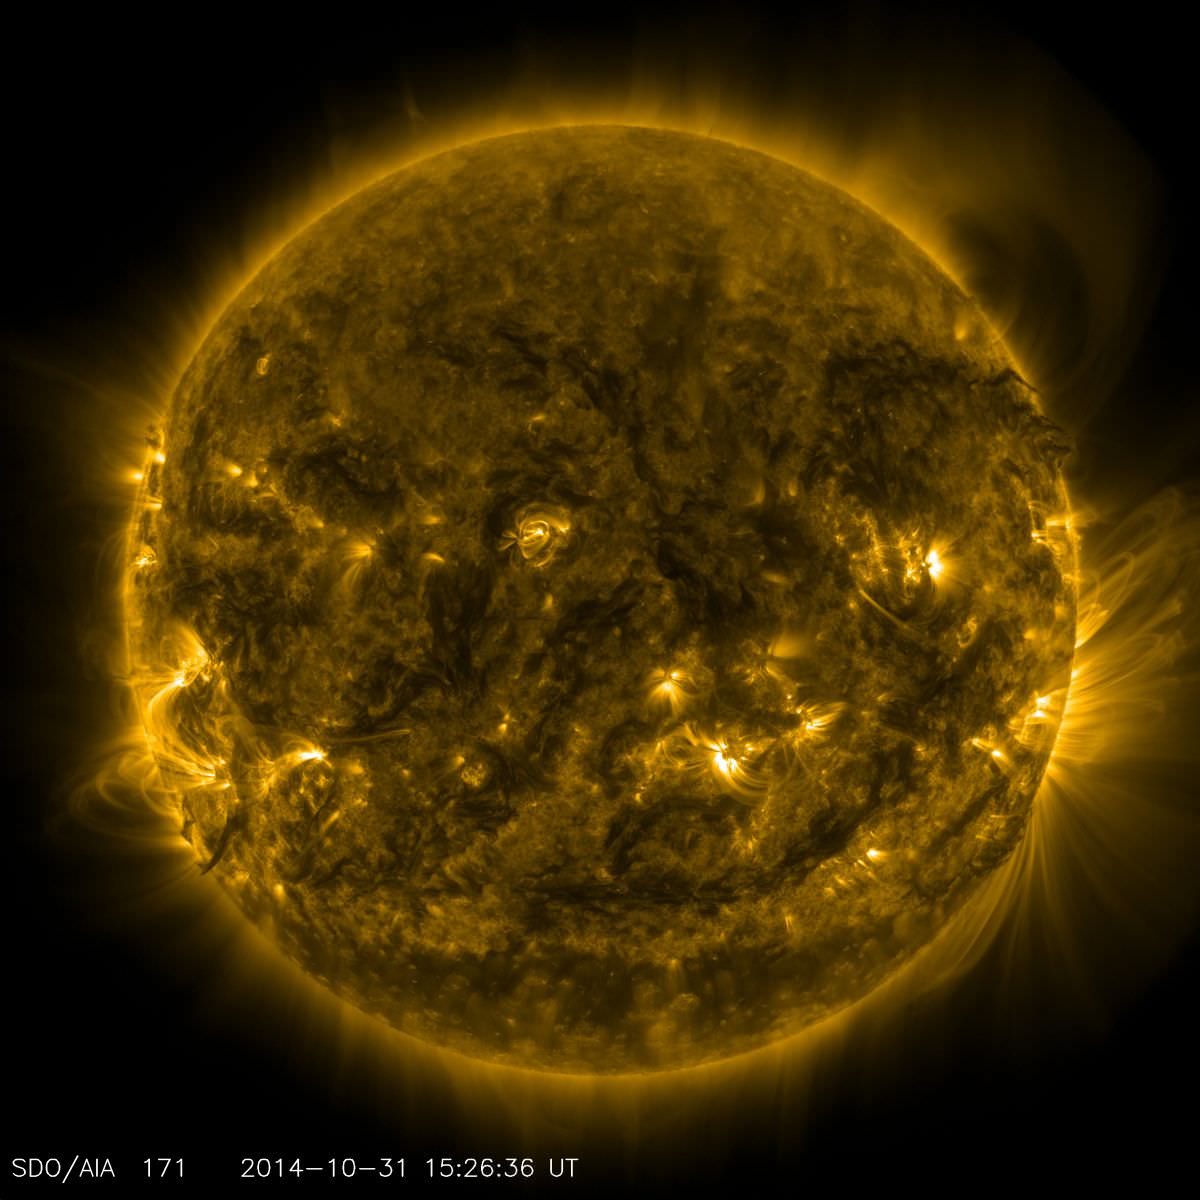
Credit: NASA/SDO
A look at recent solar activity coming around the solar limb to be targeted by RAISE. Credit: NASA/SDO

Unfortunately, the massive sunspot region AR2192 is currently turned away from the Earth and will effectively be out of RAISE’s view. The largest in over a decade, the Jupiter sized sunspot wowed viewers of the final solar eclipse of 2014 just last month. This large sunspot group will most likely survive its solar farside journey and reappear around the limb of the Sun sometime after November 9th, good news if RAISE is indeed scrubbed today due to weather.

And our current solar cycle has been a very schizophrenic one indeed. After a sputtering start, solar cycle #24 has been anemic at best, with the Sun struggling to come out of a profound minimum, the likes of which hasn’t been seen in over a century. And although October 2014 produced a Jupiter-sized sunspot that was easily seen with eclipse glasses, you wouldn’t know that we’ve passed a solar maximum from looking at the Sun now. In fact, there’s been talk among solar astronomers that solar cycle #25 may be even weaker, or absent all together.

All this makes for fascinating times to study our sometimes strange star. RAISE observations will also be coordinated with views from the Solar Dynamics Observatory and the joint NASA-JAXA Hinode satellites in Earth orbit. We’ll also be at White Sands National Park today, hoping the get a brief view of RAISE as it briefly touches space.

It’s a great time for solar astronomy!

A New Marker Might Better Track the Solar Cycle

This image from the Solar and Heliospheric Observatory (SOHO) Extreme ultraviolet Imaging Telescope (EIT) image shows large magnetically active regions and a pair of curving erupting prominences on June 28, 2000 during the current solar cycle 23 maximum. Prominences are huge clouds of relatively cool dense plasma suspended in the Sun's hot, thin corona. Magnetically active regions cause the principal total solar irradiance variations during each solar cycle. The hottest areas appear almost white, while the darker red areas indicate cooler temperatures. Credit: NASA & European Space Agency (ESA)
The Sun. Credit: NASA & European Space Agency (ESA)

Approximately every 11 years the Sun becomes violently active, putting on a show of magnetic activity for aurora watchers and sungazers alike. But the timing of the solar cycle is far from precise, making it hard to determine the exact underlying physics.

Typically astronomers use sunspots to map the course of the solar cycle, but now an international team of astronomers have discovered a new marker: brightpoints, small bright spots in the solar atmosphere that allow us to observe the constant turmoil of material inside the Sun.

The new markers provide a new method in understanding how the Sun’s magnetic field evolves over time, suggesting a deeper and longer cycle.

A well-behaved Sun flips its north and south magnetic poles every 11 years. The cycle begins when the field is weak and dipolar. But the Sun’s rotation is faster at its equator than at its poles, and this difference stretches and tangles the magnetic field lines, ultimately producing sunspots, prominences, and sometimes flares.

“Sunspots have been the perennial marker for understanding the mechanisms that rule the sun’s interior,” said lead author Scott McIntosh, from the National Center for Atmospheric Research, in a news release. “But the processes that make sunspots are not well understood, and far less, those that govern their migration and what drives their movement.”

So McIntosh and colleagues developed a new tracking devise: spots of extreme ultraviolet and X-ray light, known as brightpoints in the Sun’s atmosphere, or corona.

“Now we can see there are bright points in the solar atmosphere, which act like buoys anchored to what’s going on much deeper down,” said McIntosh. “They help us develop a different picture of the interior of the sun.”

McIntosh and colleagues dug through the wealth of data available from the Solar and Heliospheric Observatory and the Solar Dynamics Observatory. They noticed that multiple bands of these markers also move steadily toward the equator over time. But they do so on a different timescale than sunspots.

At solar minimum there might be two bands in the northern hemisphere (one positive and one negative) and two bands in the southern hemisphere (one negative and one positive). Due to their close proximity, bands of opposite charge easily cancel one another, causing the Sun’s magnetic system to be calmer, producing fewer sunspots and eruptions.

But once the two low-latitude bands reach the equator, their polarities cancel each other out and the bands abruptly disappear — a process that takes 19 years on average.

The Sun is now left with just two large bands that have migrated to about 30 degrees latitude. Without the nearby band, the polarities don’t cancel. At this point the Sun’s calm face begins to become violently active as sunspots start to grow rapidly.

Solar maximum only lasts so long, however, because the process of generating a new band of opposite polarity has already begun at high latitudes.

In this scenario, it is the magnetic band’s cycle that truly defines the solar cycle. “Thus, the 11-year solar cycle can be viewed as the overlap between two much longer cycles,” said coauthor Robert Leamon, from Montana State University in Bozeman.

The true test, however, will come with the next solar cycle. McIntosh and colleagues predict that the Sun will enter a solar minimum somewhere in the last half of 2017, and the first sunspots of the next cycle will appear near the end of 2019.

The findings have been published in the Sept. 1 issue of the Astrophysical Journal and are available online.

Is the Sun More Active Than it Looks? An Innovative Method to Characterize the Solar Cycle

A solar cycle montage from August 1991 to September 2001 in X-rays courtesy of the Yohkoh Solar Observatory. (Credit: David Chenette, Joseph B. Gurman, Loren W. Acton, image in the public Domain).

The Sun has provided no shortage of mysteries thus far during solar cycle #24.

And perhaps the biggest news story that the Sun has generated recently is what it isn’t doing. As Universe Today recently reported, this cycle has been an especially weak one in terms of performance. The magnetic polarity flip signifying the peak of the solar maximum is just now upon us, as the current solar cycle #24 got off to a late start after a profound minimum in 2009…

Or is it?

Exciting new research out of the University of Michigan in Ann Arbor’s Department of Atmospheric, Oceanic and Space Sciences published in The Astrophysical Journal this past week suggests that we’re only looking at a portion of the puzzle when it comes to solar cycle activity.

Traditional models rely on the monthly averaged sunspot number. This number correlates a statistical estimation of the number of sunspots seen on the Earthward facing side of the Sun and has been in use since first proposed by Rudolf Wolf in 1848. That’s why you also hear the relative sunspot number sometimes referred to as the Wolf or Zürich Number.

But sunspot numbers may only tell one side of the story. In their recent paper titled Two Novel Parameters to Evaluate the Global Complexity of the Sun’s Magnetic Field and Track the Solar Cycle, researchers Liang Zhao, Enrico Landi and Sarah E. Gibson describe a fresh approach to model solar activity via looking at the 3-D dynamics heliospheric current sheet.

The spiralling curve of the heliospheric current sheet through the inner solar system. (Graphic credit: NASA).
The spiraling curve of the heliospheric current sheet through the inner solar system. (Graphic credit: NASA).

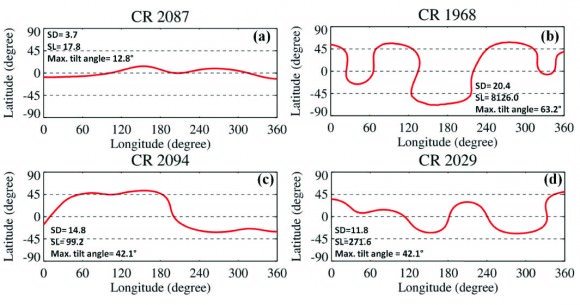
The heliospheric current sheet (or HCS) is the boundary of the Sun’s magnetic field separating the northern and southern polarity regions which extends out into the solar system. During the solar minimum, the sheet is almost flat and skirt-like. But during solar maximum, it’s tilted, wavy and complex.

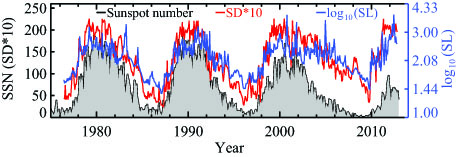
Two variables, known as SD & SL were used by researchers in the study to produce a measurement that can characterize the 3-D complexity of the HCS.  “SD is the standard deviation of the latitudes of the HCS’s position on each of the Carrington maps of the solar surface, which basically tells us how far away the HCS is distributed from the equator. And SL is the integral of the slope of HCS on that map, which can tell us how wavy the HCS is on each of the map,” Liang Zhao told Universe Today.

Ground and space-based observations of the Sun’s magnetic field exploit a phenomenon known as the Zeeman Effect, which was first demonstrated during solar observations conducted by George Ellery Hale using his new fangled invention of the spectrohelioscope in 1908. For the recent study, researchers used data covering a period from 1975 through 2013 to characterize the HCS data available online from the Wilcox Solar Observatory.

SD and SL perameters juxtaposed against the tradional monthly sunspot number.
SD and SL parameters juxtaposed against the traditional monthly sunspot number (SSN). Note the smooth fit until the end of solar cycle #23 around 2003. (Credit: Liang Zhao/The Astrophysical Journal).

Comparing the HCS value against previous sunspot cycles yields some intriguing results. In particular, comparing the SD and SL values with the monthly sunspot  number provide a “good fit” for the previous three solar cycles— right up until cycle #24.

“Looking at the HCS, we can see that the Sun began to act strange as early as 2003,” Zhao said. “This current cycle as characterized by the monthly sunspot number started a year late, but in terms of HCS values, the maximum of cycle #24 occurred right on time, with a first peak in late 2011.”

“Scientists believe there will be two peaks in the sunspot number in this solar maximum as in the previous maximum (in ~2000 and ~2002),” Zhao continued, “since the Sun’s magnetic fields in the north and south hemispheres look asymmetric, and the north evolved faster than the south recently. But so far as I can see, the highest value of monthly-averaged sunspot number in this cycle 24 is still the one in the November 2011. So we can say the first peak of cycle 24 could be in November of 2011, since it is the highest monthly sunspot number so far in this cycle. If there is a second peak, we will see it sooner or later.”

The paper also notes that although cycle 24 is especially weak when compared to recent cycles, its range of activity is not unique when compared with solar cycles over the past 260 years.

HCS curves plotted on the surface of the Sun.
HCS curves plotted on the surface of the Sun. Comparisons are made for the solar maximum on October 2000 (CR 1968), descending phase on April 2005 (2029), solar minimum on September 2009 (CR 2087), and ascending phase on March 2010 (CR2094). CR=Carrington Rotation. (Credit: Liang Zhao, The Astrophysical Journal).

The HCS value characterizes the Sun over one complete Carrington Rotation of 27 days. This is an averaged value for the rotation of the Sun, as the poles rotate slower than the equatorial regions.

The approximately 22 year span of time that it takes for the poles to reverse back to the same polarity again is equal to two average 11 year sunspot cycles. The Sun’s magnetic field has been exceptionally asymmetric during this cycle, and as of this writing, the Sun has already finished its reversal of the north pole first.

This sort of asymmetry during an imminent pole reversal was first recorded during solar cycle 19, which spanned 1954-1964. Solar cycles are numbered starting from observations which began in 1749, just four decades after the end of the 70-year Maunder Minimum.

“This is an exciting time to study the magnetic field of the Sun, as we may be witnessing a return to a less-active type of cycle, more like those of 100 years ago,” NCAR/HAO senior scientist and co-author Sarah Gibson said.

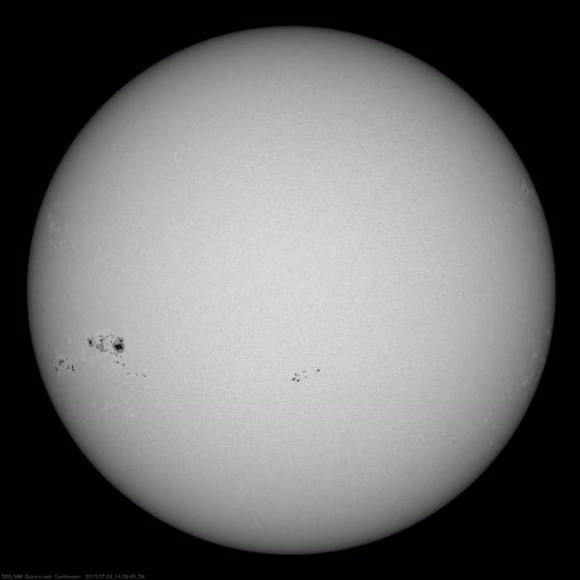
A massive sunspot group that rotated into view in early July, 2013... one of the largest seen for solar cycle #24 thus far. (Credit: NASA/SDO).
A massive sunspot group that rotated into view in early July, 2013, one of the largest seen for solar cycle #24 thus far. (Credit: NASA/SDO).

But this time, an armada of space and ground-based observatories will scrutinize our host star like never before. The SOlar Heliospheric Observatory (SOHO) has already followed the Sun through the equivalent of one complete solar cycle— and it has now been joined in space by STEREO A & B, JAXA’s Hinode, ESA’s Proba-2 and NASA’s Solar Dynamics Observatory. NASA’s Interface Region Imaging Spectrograph (IRIS) was also launched earlier this year and has just recently opened for business.

Will there be a second peak following the magnetic polarity reversal of the Sun’s south pole, or is Cycle #24 about to “leave the building?” And will Cycle #25 be absent all together, as some researchers suggest? What role does the solar cycle play in the complex climate change puzzle? These next few years will prove to be exciting ones for solar science, as the predictive significance of HCS SD & SL values are put to the test… and that’s what good science is all about!

-Read the abstract with a link to the full paper in The Astrophysical Journal by University of Michigan researchers here.

Solar Cycle #24: On Track to be the Weakest in 100 Years

Projected vs observed sunspot numbers for solar cycles #23 & #24. (Credit: Hathaway/NASA/MSFC).

Our nearest star has exhibited some schizophrenic behavior thus far for 2013.

By all rights, we should be in the throes of a solar maximum, an 11-year peak where the Sun is at its most active and dappled with sunspots.

Thus far though, Solar Cycle #24 has been off to a sputtering start, and researchers that attended the meeting of the American Astronomical Society’s Solar Physics Division earlier this month are divided as to why.“Not only is this the smallest cycle we’ve seen in the space age, it’s the smallest cycle in 100 years,” NASA/Marshall Space Flight Center research scientist David Hathaway said during a recent press teleconference conducted by the Marshall Space Flight Center.

Cycle #23 gave way to a profound minimum that saw a spotless Sol on 260 out of 365 days (71%!) in 2009. Then, #Cycle 24 got off to a late start, about a full year overdue — we should have seen a solar maximum in 2012, and now that’s on track for the late 2013 to early 2014 time frame. For solar observers, both amateur, professional and automated, it seems as if the Sun exhibits a “split-personality” this year, displaying its active Cycle #24-self one week, only to sink back into a blank despondency the next.

This new cycle has also been asymmetrical as well. One hallmark heralding the start of a new cycle is the appearance of sunspots at higher solar latitudes on the disk of the Sun. These move progressively toward the Sun’s equatorial regions as the cycle progresses, and can be mapped out in what’s known as a Spörer’s Law.

The sunspot number "butterfly" graph, illustrating Spörer's Law that susnpots gradually migrate towards the equator of the Sun as the solar cycle progresses. (Credit: NASA/MSFC).
The sunspot number “butterfly” graph, illustrating Spörer’s Law that susnpots gradually migrate towards the equator of the Sun as the solar cycle progresses. (Credit: NASA/MSFC).

But the northern hemisphere of the Sun has been much more active since 2006, with the southern hemisphere experiencing a lag in activity. “Usually this asymmetry lasts a year or so, and then the hemispheres synchronize,” said Giuliana de Toma of the High Altitude Observatory.

So far, several theories have been put forth as to why our tempestuous star seems to be straying from its usual self. Along with the standard 11-year cycle, it’s thought that there may be a longer, 100 year trend of activity and subsidence known as the Gleissberg Cycle.

The Sun is a giant ball of gas, rotating faster (25 days) at the equator than at the poles, which rotate once every 34.5 days. This dissonance sets up a massive amount of torsion, causing the magnetic field lines to stretch and snap, releasing massive amounts of energy. The Sun also changes polarity with every sunspot cycle, another indication that a new cycle is underway.

But predictions have run the gamut for Cycle #24. Recently, solar scientists have projected a twin peaked solar maximum for later this year, and thus far, Sol seems to be following this modified trend.  Initial predictions by scientists at the start of Cycle #24 was for the sunspot number to have reached 90 by August 2013; but here it is the end of July, and we’re sitting at 68, and it seems that we’ll round out the northern hemisphere Summer at a sunspot number of 70 or so.

Some researchers predict that the following sunspot Cycle #25 may even be absent all together.

“If this trend continues, there will be almost no spots in Cycle 25,” Noted Matthew Penn of the National Solar Observatory, hinting that we may be on the edge of another Maunder Minimum.

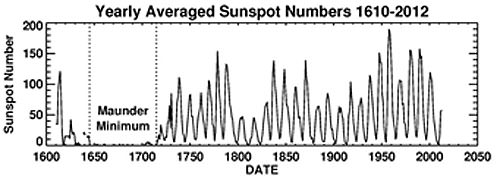
Looking back over solar cycles for the past 500 years. (Credit: D. Hathaway/NASA/MSFC).

The Maunder Minimum was a period from 1645 to 1715 where almost no sunspots were seen. This span of time corresponded to a medieval period known as the Little Ice Age. During this era, the Thames River in London froze, making Christmas “Frost Fairs” possible on the ice covered river. Several villages in the Swiss Alps were also consumed by encroaching glaciers, and the Viking colony established in Greenland perished. The name for the period comes from Edward Maunder, who first noted the minimum in papers published in the 1890s. The term came into modern vogue after John Eddy published a paper on the subject in the journal of Science in 1976. Keep in mind, the data from the period covered by the Maunder Minimum is far from complete— Galileo had only started sketching sunspots via projection only a few decades prior to the start of the Maunder Minimum. But tellingly, there was a span of time in the early 18th century when many researchers supposed that sunspots were a myth! They were really THAT infrequent…

Just what role a pause in the solar cycle might play in the climate change debate remains to be seen. Perhaps, humanity is getting a brief (and lucky) reprieve, a chance to get serious about controlling our own destiny and doing something about anthropogenic climate-forcing. On a more ominous note, however, an extended cooling phase may give us reason to stall on preparing for the inevitable while giving ammunition to deniers, who like to cite natural trends exclusively.

Down but not out? Sol looking more like its solar max-self earlier this month on July 8th. (Photo by author).

Whatever occurs, we now have an unprecedented fleet of solar monitoring spacecraft on hand to watch the solar drama unfold. STEREO A & B afford us a 360 degree view of the Sun. SOHO has now monitored the Sun for the equivalent of more than one solar cycle, and NASA’s Solar Dynamics Observatory has joined it in its scrutiny. NASA’s Interface Region Imaging Spectrograph (IRIS)  just launched earlier this year, and has already begun returning views of the solar atmosphere in unprecedented detail. Even spacecraft such as MESSENGER orbiting Mercury can give us vital data from other vantage points in the solar system.

Cycle #24 may be a lackluster performer, but I’ll bet the Sun has a few surprises in store. You can always get a freak cloud burst, even in the middle of a drought. Plus, we’re headed towards northern hemisphere Fall, a time when aurora activity traditionally picks up.

Be sure to keep a (safely filtered) eye on ol’ Sol— it may be the case over these next few years that “no news is big news!”


Happy (or is it Merry?) Aphelion This Friday

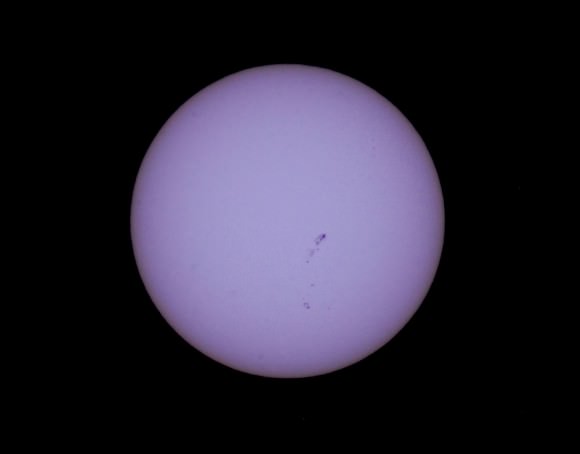
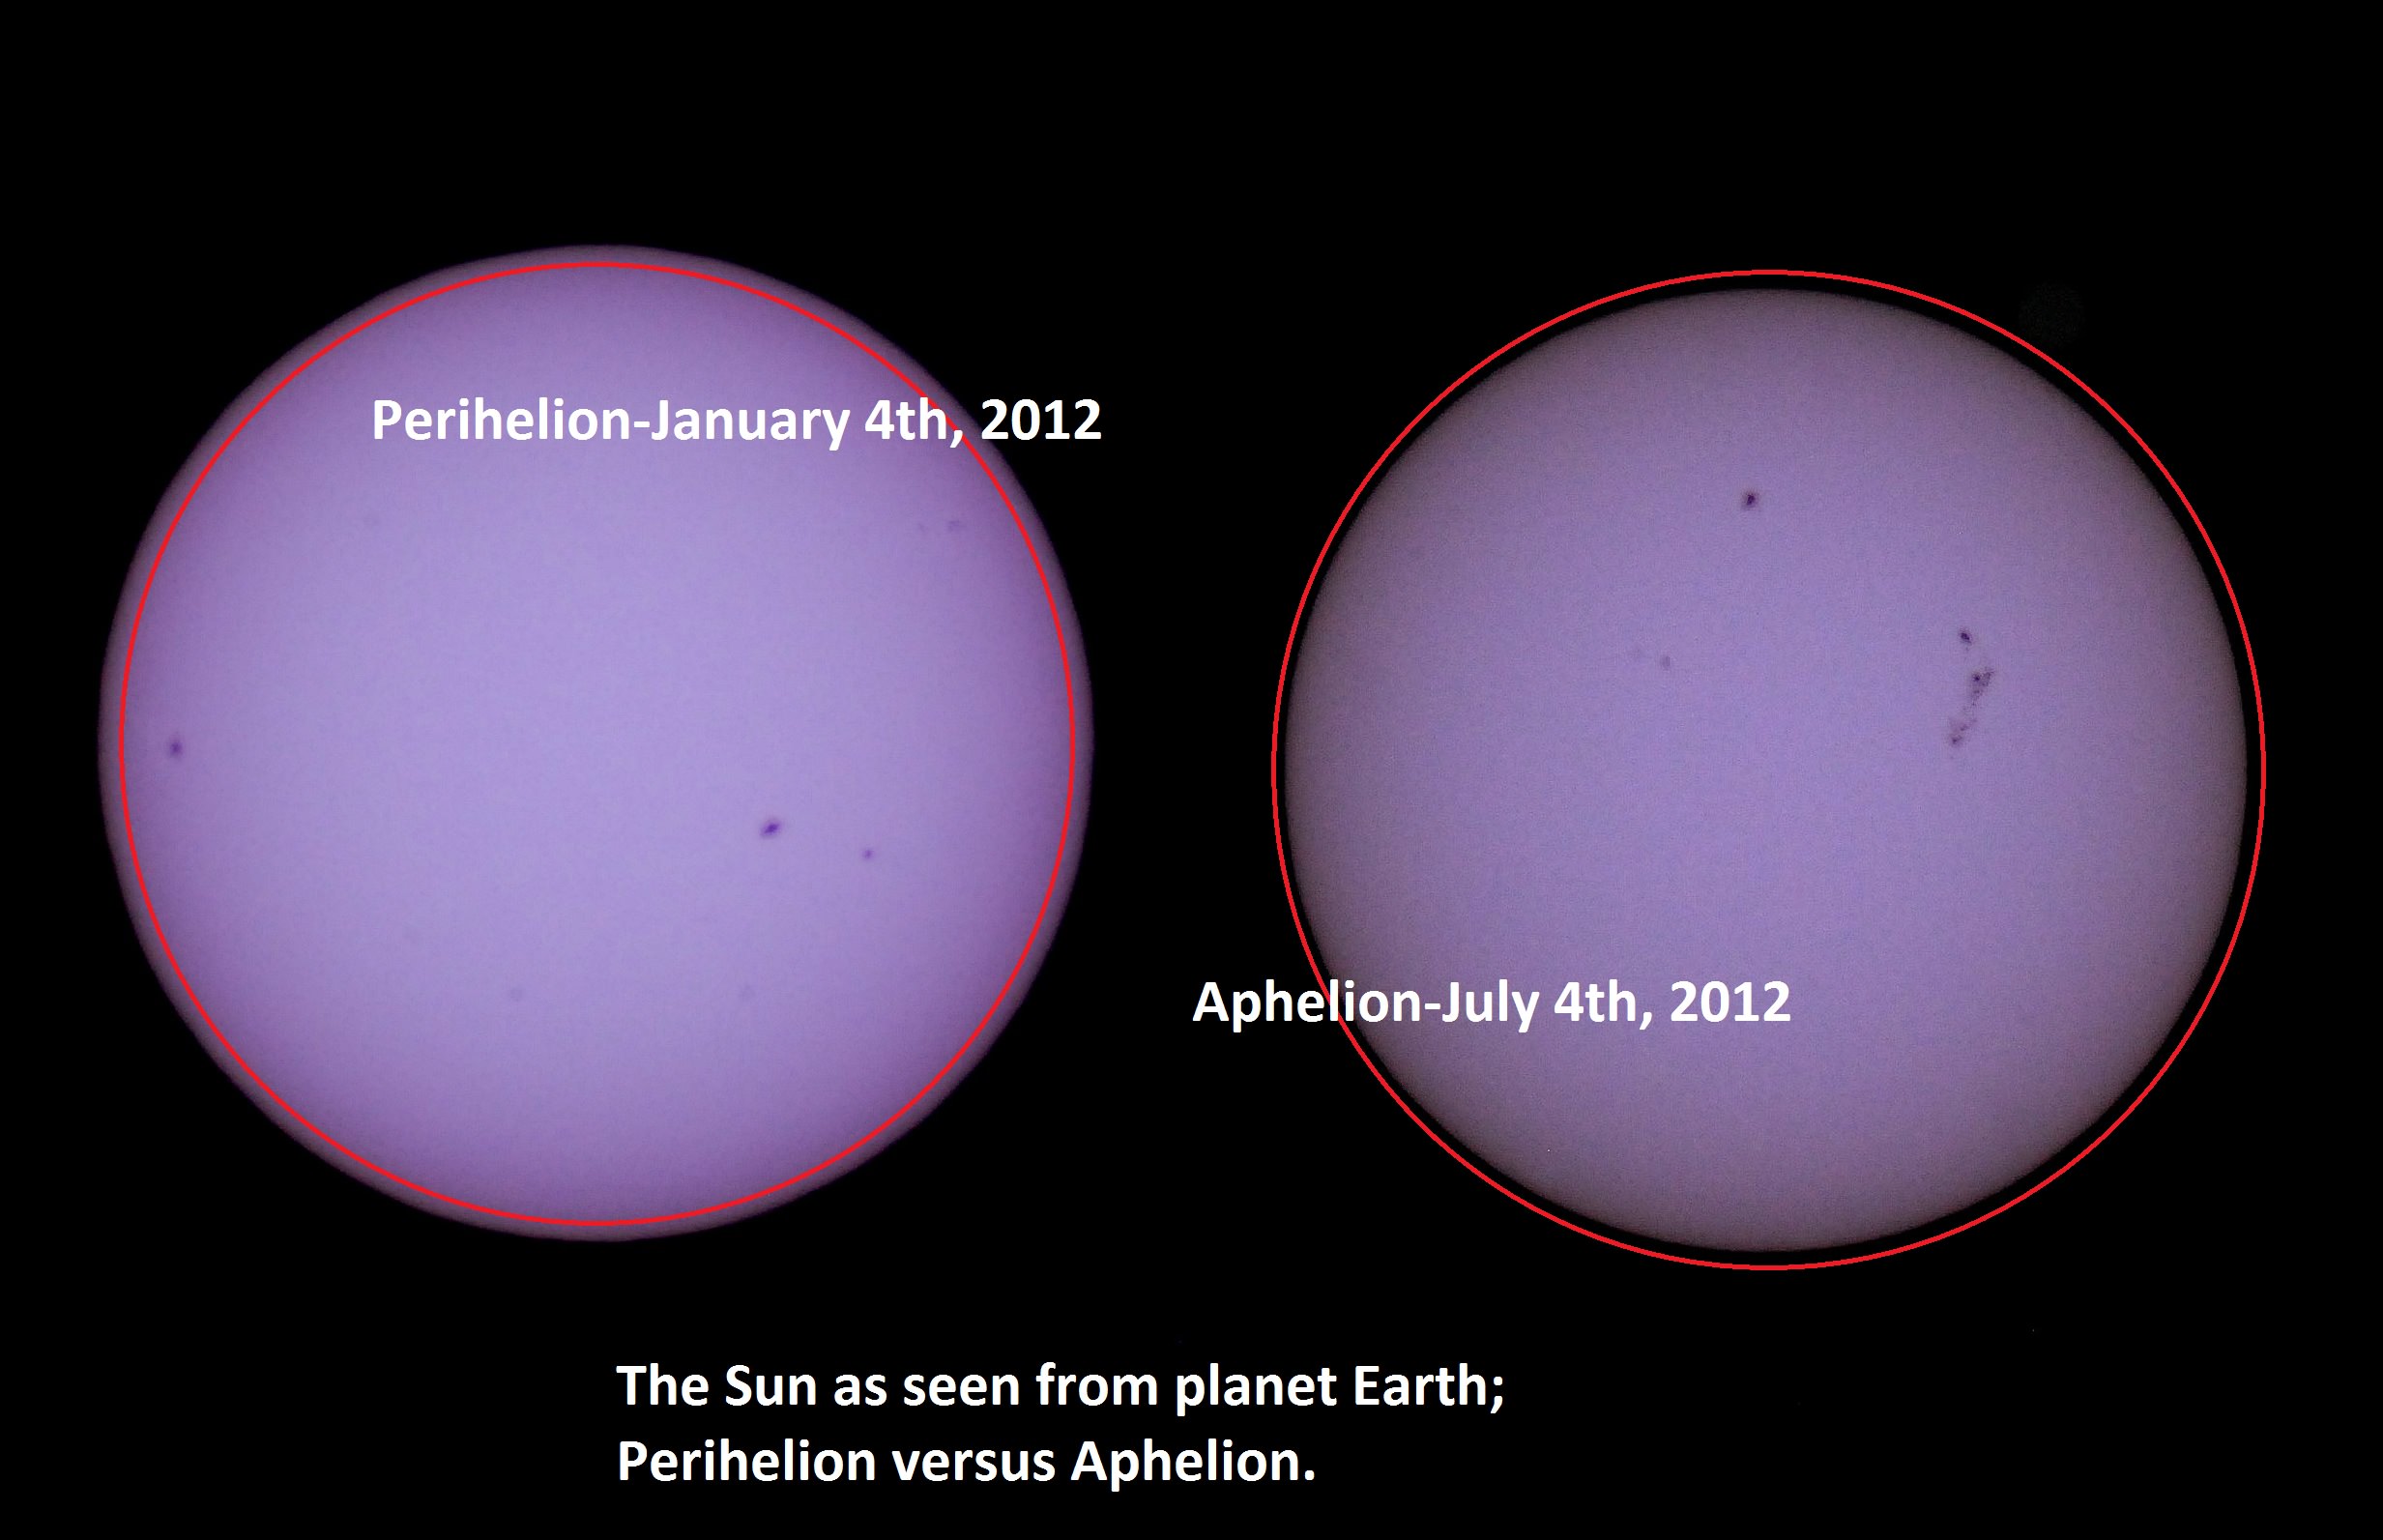
Solar apparent size- perihelion versus aphelion 2012.

This 4th of July weekend brings us one more reason to celebrate. On July 5th at approximately 11:00 AM EDT/15:00 UT, our fair planet Earth reaches aphelion, or its farthest point from the Sun at 1.0167 Astronomical Units (A.U.s) or 152,096,000 kilometres distant.

Though it may not seem it to northern hemisphere residents sizzling in the summer heat, we’re currently 3.3% farther from the Sun than our 147,098,290 kilometre (0.9833 A.U.) approach made in early January.

We thought it would be a fun project to capture this change. A common cry heard from denier circles as to scientific facts is “yeah, but have you ever SEEN it?” and in the case of the variation in distance between the Sun and the Earth from aphelion to perihelion, we can report that we have!

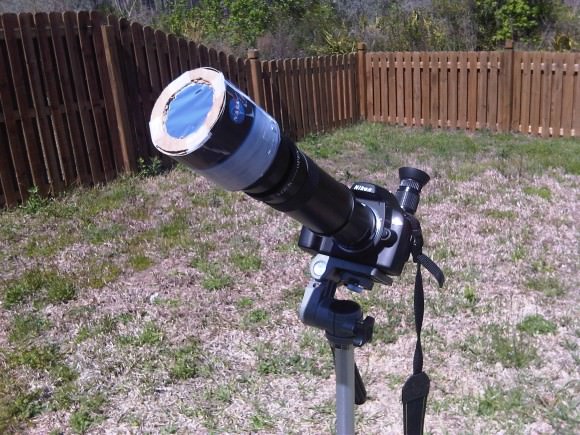
We typically observe the Sun in white light and hydrogen alpha using a standard rig and a Coronado Personal Solar Telescope  on every clear day. We have two filtered rigs for white light- a glass Orion filter for our 8-inch Schmidt-Cassegrain, and a homemade Baader solar filter for our DSLR. We prefer the DSLR rig for ease of deployment. We’ve described in a previous post how to make a safe and effective solar observing rig using Baader solar film.

Our solar imaging rig.
Our primary solar imaging rig. A Nikon D60 DSLR with a 400mm lens + a 2x teleconverter and Baader solar filter. Very easy to employ!

We’ve been imaging the Sun daily for a few years as part of our effort to make a home-brewed “solar rotation and activity movie” of the entire solar cycle.  We recently realized that we’ve imaged Sol very near aphelion and perihelion on previous years with this same fixed rig, and decided to check and see if we caught the apparent size variation of our nearest star. And sure enough, comparing the sizes of the two disks revealed a tiny but consistent variation.

It’s a common misconception that the seasons are due to our distance from the Sun. The insolation due to the 23.4° tilt of the rotational axis of the Earth is the dominant driving factor behind the seasons. (Don’t they still teach this in grade school? You’d be surprised at the things I’ve heard!) In the current epoch, a January perihelion and a July aphelion results in milder climatic summers in the northern hemisphere and more severe summers in the southern. The current difference in solar isolation between hemispheres due to eccentricity of Earth’s orbit is 6.8%.

The orbit of the Earth also currently has one of the lowest eccentricities (how far it deviates for circular) of the planets at 0.0167, or 1.67%. Only Neptune (1%) and Venus (0.68%) are “more circular.”

The orbital eccentricity of the Earth also oscillates over a 413,000 year period between 5.8% (about the same as Saturn) down to 0.5%. We’re currently at the low end of the scale, just below the mean value of 2.8%.

Variation in eccentricity is also coupled with other factors, such as the change in axial obliquity the precession of the line of apsides and the equinoxes to result in what are known as Milankovitch cycles. These variations in extremes play a role in the riddle of climate over hundreds of thousands of years.  Climate change deniers like to point out that there are large natural cycles in the records, and they’re right – but in the wrong direction. Note that looking solely at variations in the climate due to Milankovitch cycles, we should be in a cooling trend right now.  Against this backdrop, the signal of anthropogenic climate forcing and global dimming of albedo (which also masks warming via cloud cover and reflectivity) becomes even more ominous.

Aphelion can presently fall between July 2nd at 20:00 UT (as it did last in 1960) and July 7th at 00:00 UT as it last did on 2007.  The seemingly random variation is due to the position of the Earth with respect to the barycenter of the Earth-Moon system near the time of aphelion. The once every four year reset of the leap year (with the exception of the year 2000!) also plays a lesser role.

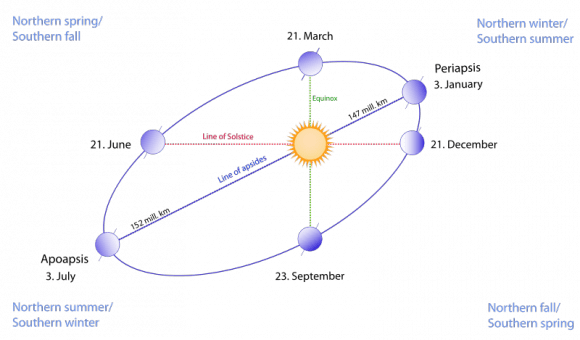
Perihelion and aphelion vs the solstices and equinoxes, an exagarated view.
Perihelion and aphelion vs the solstices and equinoxes, an exaggerated view. (Wikimedia Commons image under a 3.0 Unported Attribution-Share Alike license. Author Gothika/Doudoudou).

I love observing the Sun any time of year, as its face is constantly changing from day-to-day. There’s also no worrying about light pollution in the solar observing world, though we’ve noticed turbulence aloft (in the form of bad seeing) is an issue later in the day, especially in the summertime.  The rotational axis of the Sun is also tipped by about 7.25° relative to the ecliptic, and will present its north pole at maximum tilt towards us on September 8th. And yes, it does seem strange to think in terms of “the north pole of the Sun…”

We’re also approaching the solar maximum through the 2013-2014 time frame, another reason to break out those solar scopes.  This current Solar Cycle #24 has been off to a sputtering start, with the Sun active one week, and quiet the next. The last 2009 minimum was the quietest in a century, and there’s speculation that Cycle #25 may be missing all together.

And yes, the Moon also varies in its apparent size throughout its orbit as well, as hyped during last month’s perigee or Super Moon. Keep those posts handy- we’ve got one more Super Moon to endure this month on July 22nd. The New Moon on July 8th at 7:15UT/3:15 AM EDT will occur just 30 hours after apogee, and will hence be the “smallest New Moon” of 2013, with a lot less fanfare. Observers worldwide also have a shot at catching the slender crescent Moon on the evening of July 9th. This lunation and the sighting of the crescent Moon also marks the start of the month of Ramadan on the Muslim calendar.

Be sure to observe the aphelion Sun (with proper protection of course!) It would be uber-cool to see a stitched together animation of the Sun “growing & shrinking” from aphelion to perihelion and back. We could also use a hip Internet-ready meme for the perihelion & aphelion Sun- perhaps a “MiniSol?” A recent pun from Dr Marco Langbroek laid claim to the moniker of “#SuperSun;” in time for next January’s perihelion;

Marco quote

Could a new trend be afoot?

“Cool” Gas May Be At The Root Of Sunspots

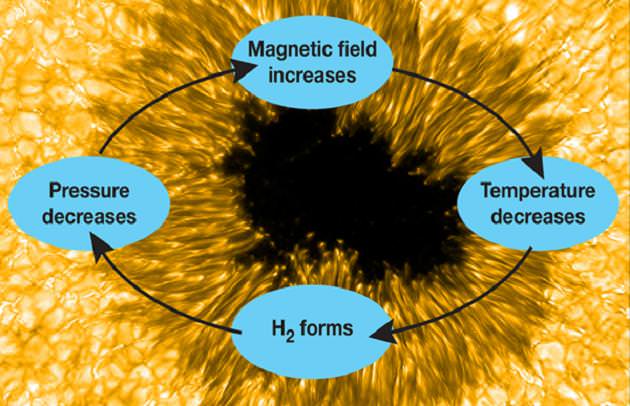
During the initial stage of sunspot emergence and cooling, the formation of H2 may trigger a temporary "runaway" magnetic field intensification. The magnetic field prevents the flow of energy from inside the sun to the outside, and the sunspot cools as the energy shines into space. They form hydrogen molecules that take half the volume of the atoms, thus dropping pressure and concentrating the magnetic field, and so on. (adapted from Jaeggli, 2011; sunspot image by F. Woeger et al

[/caption]

Although well over 40 years old, the Dunn Solar Telescope at Sunspot, New Mexico isn’t going to be looking at an early retirement. On the contrary, it has been outfitted with the new Facility Infrared Spectropolarimeter (FIRS) and is already making news on its solar findings. FIRS provides simultaneous spectral coverage at visible and infrared wavelengths through the use of a unique dual-armed spectrograph. By utilizing adaptive optics to overcome atmospheric “seeing” conditions, the team took on seven active regions on the Sun – one in 2001 and six during December 2010 to December 2011 – as Sunspot Cycle 23 faded away. The full sunspot sample has 56 observations of 23 different active regions… and showed that hydrogen might act as a type of energy dissipation device which helps the Sun get a magnetic grip on its spots.

“We think that molecular hydrogen plays an important role in the formation and evolution of sunspots,” said Dr. Sarah Jaeggli, a recent University of Hawaii at Manoa graduate whose doctoral research formed a key element of the new findings. She conducted the research with Drs. Haosheng Lin, also from the University of Hawaii at Manoa, and Han Uitenbroek of the National Solar Observatory in Sunspot, NM. Jaeggli now is a postdoctoral researcher in the solar group at Montana State University. Their work is published in the February 1, 2012, issue of The Astrophysical Journal.

You don’t have to be a solar physicist to know about the Sun’s 11 year cycle, or to understand how sunspots are cooler areas of intense magnetism. Believe it or not, even the professionals aren’t quite sure of how all the mechanisms work… especially those which cause sunspot forming areas that retard normal convective motions. Of the things we’ve learned, the spot’s inner temperature has a correlation with its magnetic field strength – with a sharp rise as the temperature cools. “This result is puzzling,” Jaeggli and her colleagues wrote. It implies some undiscovered mechanism inside the spot.

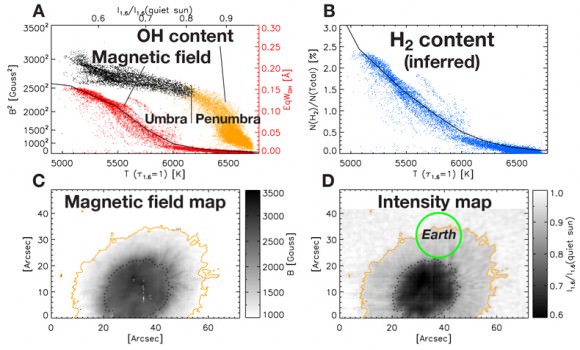
NOAA 11131 sunspot region (Dec. 6, 2010) was the most intense spot measured in this study, but far from the largest the Sun can produce. The two bottom images show the strength of the magnetic field (C) and the contrast between the interior of the spot and the surrounding photosphere (D). The first graph (A) shows how OH starts to appear in the penumbra and continues to rise as the magnetic field strength rises. Because OH forms at a lower temperature than H2, its presence implies the quantity of hydrogen molecules that could be present (B). (adapted from Jaeggli et al, 2012)

One theory is that hydrogen atoms combining into hydrogen molecules may be responsible. As for our Sun, the majority of hydrogen is ionized atoms because the average surface temperature is assessed at 5780K (9944 deg. F). However, since Sol is considered a “cool star”, researchers have found indications of heavy-element molecules in the solar spectrum – including surprising water vapor. These type of findings might prove the umbral regions could allow hydrogen molecules to combine in the surface layers – a prediction of 5% made by the late Professor Per E. Maltby and colleagues at the University of Oslo. This type of shift could cause drastic dynamic changes where gas pressure is concerned.

“The formation of a large fraction of molecules may have important effects on the thermodynamic properties of the solar atmosphere and the physics of sunspots,” Jaeggli wrote.

With direct measurements being beyond our current capabilities, the team then measured a proxy – the hydroxyl radical made of one atom each of hydrogen and oxygen (OH). According to the National Solar Observatory, “OH dissociates (breaks into atoms) at a slightly lower temperature than H2, meaning H2 can also form in regions where OH is present. By coincidence, one of its infrared spectral lines is 1565.2nm, almost the same as the 1565nm line of iron, used for measuring magnetism in a spot and one of the lines FIRS is designed to observe.”

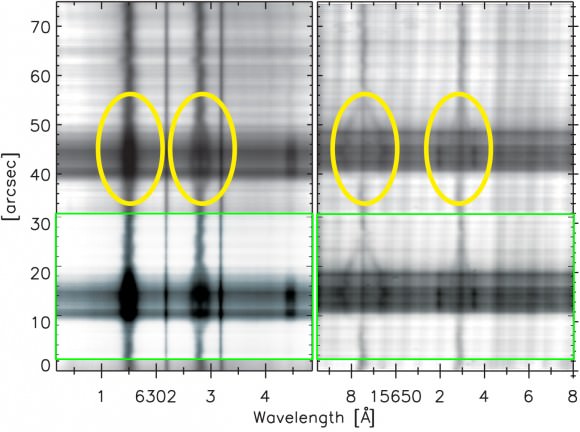
Spectral lines are the unique "fingerprints in light" that all atoms and molecules produce. In the presence of a magnetic field in a hot gas, some lines split, betraying the presence and strength of the magnetic fields. Each line corresponds to electrons giving up energy in discrete amounts, or quanta, as light. Imposing a magnetic field on the atom makes the electrons produce multiple lines instead of one. The spread of these lines is a direct measure of the strength of the magnetic field, and is greater in the red and in the infrared spectrum. This image depicts sunspot spectra taken by FIRS with lines centered at 630.2nm (left) and 1564.8nm (right). Note the broadened area in the color ellipses, indicating line splitting inside a spot, and how the broadening is greater at the longer wavelength. Contrast is adjusted to enhance visibility in the inset boxes.

By combining both old and new data, the team measured magnetic fields across sunspots, and the OH intensity inside spots, judging the H2 concentrations. “We found evidence that significant quantities of hydrogen molecules form in sunspots that are able to maintain magnetic fields stronger than 2,500 Gauss,” Jaeggli commented. She also said its presence leads to a temporary “runaway” intensification of the magnetic field.

As for the anatomy of a sunspot, magnetic flux boils up from the Sun’s interior and slows surface convection – which in turns stops cooler gas which has radiated its heat into space. From there, molecular hydrogen is created, reducing the volume. Because it is more transparent than its atomic counterpart, its energy is also radiated into space allowing the gas to cool even more. At this point the hot gas primed by the flux compresses the cooler region and intensifies the magnetic field. “Eventually it levels out, partly from energy radiating in from the surrounding gas. Otherwise, the spot would grow without bounds. As the magnetic field weakens, the H2 and OH molecules heat up and dissociate back to atoms, compressing the remaining cool regions and keeping the spot from collapsing.”

For now, the team admits that additional computer modeling is required to validate their observations and that most of the active regions so far have been mild ones. They’re hoping that Sunspot Cycle 24 will give them more fuel to be “cool”…

Original Story Source: National Solar Observatory News Release.

The Sun’s Conveyor Belt May Lengthen Solar Cycles

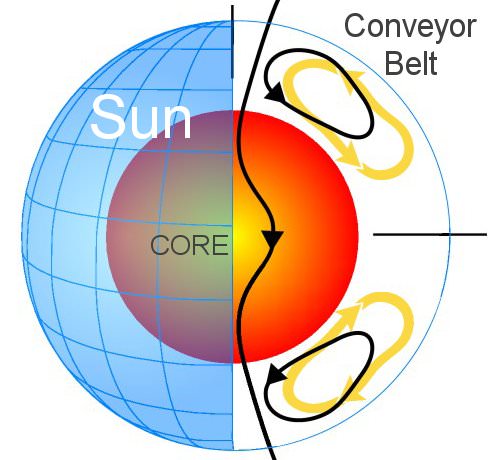
The conveyor belt of the Sun - a large flow of plasma that circulates under the surface - may be responsible for the duration of solar cycles. Image Credit: Science@NASA

[/caption]

The Sun seems to finally be waking up in earnest from the long slumber of the past cycle. Solar cycles tend to last on average about 11 years, but the last cycle – solar cycle 23 – was 12.5 years long. The cause of the most recent lull in the Sun’s activity is somewhat enigmatic, but it may be explained by the “conveyor belt” of plasma that circulates in the Sun’s chromosphere and photosophere. Just how far this conveyor belt of plasma extends underneath the Sun may heavily influence the duration of solar cycles.

In a recent paper published in Geophysical Research Letters, Dr. Mausumi Dikpati of the High Altitude Observatory National Center for Atmospheric Research in Boulder, Colorado and her team modeled data from the Mount Wilson Observatory for the duration of the last solar cycle. When they analyzed and modeled surface Doppler measurements of the flow of plasma currents that course underneath the surface of the Sun, they discovered that the flow extended all the way to the poles.

This is in contrast to data from previous, average-length solar cycles, in which the meridional plasma flow – or the Sun’s conveyor belt – flowed only to about 60 degrees latitude. This flow is not unlike thermohaline circulation here on Earth, in which the ocean transports heat around the globe.

Dr. Dikpati said in an email interview, “This is the first time that the Sun’s conveyor-belt has been measured accurately enough for two consecutive cycles (cycles 22 spanning approximately 1986-1996.5 and cycle 23 spanning 1996.5-2009). From these data we now know that cycle 22 had a shorter conveyor-belt reaching only to 60-degree latitude, while cycle 23 had a long conveyor-belt extending all the way to the pole.”

The cycles of the Sun are intricately linked to the magnetic field permeating our nearest star. Gigantic loops of the magnetic field of the Sun are what cause sunspots, and as the contours of the magnetic field change over the cycle of the Sun, more or fewer sunspots are seen, as well as solar flares and other activity. There is always a lack of sunspots between the cycles, but the minimum at the end of cycle 23 was unusually long.

The conveyor belt of plasma flowing in the chromosphere and photosphere essentially drags along with it the magnetic flux of the Sun. Because the extent of the conveyor belt reached a higher latitude, it took the magnetic flux longer to return to the equator, resulting in the delay of sunspots marking the onset of cycle 24.

Dr. Dikpati and her team determined that it wasn’t the speed of the flow of plasma conveyor belt that lengthened the solar cycle, but the extent into higher latitudes, and slower return to the equator. Though the speed of the conveyor belt was a bit higher than usual over the past five years, it also stretched much further than during a normal cycle.

Dr. Dikpati said of using data from previous solar cycles to better refine their model of the conveyor belt:

From the same data source (Mount Wilson data from Roger Ulrich) there is evidence of a short conveyor-belt in cycles 19, 20 and 21 also. All these cycles had periods (10.5 years) like cycle 22. Back beyond that we are hoping that others in the community will search for evidence of the latitudinal extent of the conveyor-belt in even earlier cycles. In fact, theory of the conveyor-belt in high-latitudes indicates that a shorter conveyor belt should be more common in the Sun, rather this long conveyor belt in cycle 23 may be the exception. There is already evidence from Mount Wilson data that, at the start of cycle 24, the conveyor-belt is shortening again, suggesting that cycle 24 is going to be more like cycles 19 – 22 in length.

By getting a better model of the interplay between the plasma flow and the Sun’s magnetic field, solar scientists may be able to better predict and explain the length of future and past solar cycles.

Dr. Dikpati said, “The conveyor belt also governs the memory of the Sun about its past magnetic features. This is an important ingredient for building prediction models for solar cycles.”

Source: Geophysical Research Letters, email interview with Dr. Mausumi Dikpati

Researchers Say Sun Cycle Alters Earth’s Climate

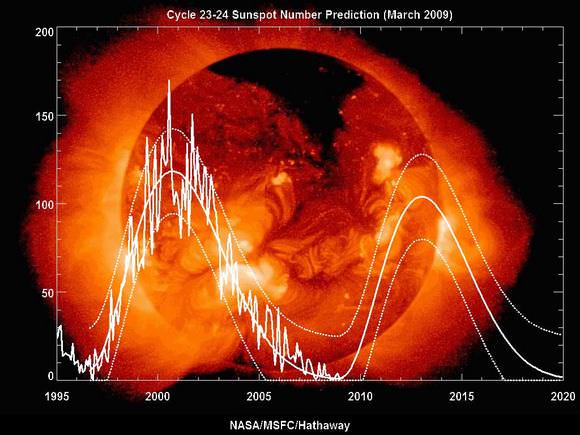
The sunspot cycle from 1995 to the present. The jagged curve traces actual sunspot counts. Smooth curves are fits to the data and one forecaster's predictions of future activity. Credit: David Hathaway, NASA/MSFC

[/caption]
If the energy from the sun varies by only 0.1 percent during the 11-year solar cycle, could such a small variation drive major changes in weather patterns on Earth? Yes, say researchers from the National Center for Atmospheric Research (NCAR) who used more than a century of weather observations and three powerful computer models in their study. They found subtle connections between solar cycle, the stratosphere, and the tropical Pacific Ocean that work in sync to generate periodic weather patterns that affect much of the globe. Scientists say this will help in predicting the intensity of certain climate phenomena, such as the Indian monsoon and tropical Pacific rainfall, years in advance.

“The Sun, the stratosphere, and the oceans are connected in ways that can influence events such as winter rainfall in North America,” says NCAR scientist Gerald Meehl, the lead author. “Understanding the role of the solar cycle can provide added insight as scientists work toward predicting regional weather patterns for the next couple of decades.”

The new study looked at the connection between the Sun’s impact on two seemingly unrelated regions. Chemicals in the stratosphere and sea surface temperatures in the Pacific Ocean respond during solar maximum in a way that amplifies the Sun’s influence on some aspects of air movement. This can intensify winds and rainfall, change sea surface temperatures and cloud cover over certain tropical and subtropical regions, and ultimately influence global weather.

The team first confirmed an earlier theory, that the slight increase in solar energy during the peak production of sunspots is absorbed by stratospheric ozone. The energy warms the air in the stratosphere over the tropics, where sunlight is most intense, while also stimulating the production of additional ozone there that absorbs even more solar energy. Since the stratosphere warms unevenly, with the most pronounced warming occurring at lower latitudes, stratospheric winds are altered and, through a chain of interconnected processes, end up strengthening tropical precipitation.

At the same time, the increased sunlight at solar maximum causes a slight warming of ocean surface waters across the subtropical Pacific, where Sun-blocking clouds are normally scarce. That small amount of extra heat leads to more evaporation, producing additional water vapor. In turn, the moisture is carried by trade winds to the normally rainy areas of the western tropical Pacific, fueling heavier rains and reinforcing the effects of the stratospheric mechanism.

The top-down influence of the stratosphere and the bottom-up influence of the ocean work together to intensify this loop and strengthen the trade winds. As more sunshine hits drier areas, these changes reinforce each other, leading to less clouds in the subtropics, allowing even more sunlight to reach the surface, and producing a positive feedback loop that further magnifies the climate response.

These stratospheric and ocean responses during solar maximum keep the equatorial eastern Pacific even cooler and drier than usual, producing conditions similar to a La Nina event. However, the cooling of about 1-2 degrees Fahrenheit is focused farther east than in a typical La Nina, is only about half as strong, and is associated with different wind patterns in the stratosphere.

Earth’s response to the solar cycle continues for a year or two following peak sunspot activity. The La Nina-like pattern triggered by the solar maximum tends to evolve into a pattern similar to El Nino as slow-moving currents replace the cool water over the eastern tropical Pacific with warmer water. The ocean response is only about half as strong as with El Nino and the lagged warmth is not as consistent as the La Nina-like pattern that occurs during peaks in the solar cycle.

Solar maximum could potentially enhance a true La Nina event or dampen a true El Nino event. The La Nina of 1988-89 occurred near the peak of solar maximum. That La Nina became unusually strong and was associated with significant changes in weather patterns, such as an unusually mild and dry winter in the southwestern United States.

The Indian monsoon, Pacific sea surface temperatures and precipitation, and other regional climate patterns are largely driven by rising and sinking air in Earth’s tropics and subtropics. Therefore the new study could help scientists use solar-cycle predictions to estimate how that circulation, and the regional climate patterns related to it, might vary over the next decade or two.

The team used three different computer models to look at all the variables and each came up with the same result, that even a small variablilty in the sun’s energy could have profound effects on Earth.

“With the help of increased computing power and improved models, as well as observational discoveries, we are uncovering more of how the mechanisms combine to connect solar variability to our weather and climate,” Meehl says.

The team’s research was published in the Journal Science.