The Atmosphere of WASP-17b

One of the greatest potentials of transiting exoplanets is the ability to monitor the spectra and examine the composition of the planet’s atmosphere. This has been done already for HD 18733b and HD 209458b. In a new article by a team of astronomers at Keele University in the UK, absorption spectroscopy has been applied to the unusual exoplanet WASP-17b, which is known to orbit retrograde.

Not only does the spectra tell astronomers the atmospheric composition, but can also give an understanding of the the composition, but can also be indicative of how the atmosphere absorbs the light from the star and how heat is transferred around the planet. Additionally, since the atmosphere will absorb differently at different wavelengths, this gives differences in the timing of the eclipse and can be used to probe the radius of the planet more tightly as well as potentially examining the layering of the atmosphere.

For their investigation, the team concentrated on the sodium doublet lines at 5889.95 and 5895.92 Å. Observations were taken by the Very Large Telescope in Chile to observe 8 transits of the planet in June of 2009. The planet itself has a short orbit of 3.74 days.

Applying these spectroscopic techniques to WASP-17b, the team discovered the presence of sodium in the atmosphere. Yet the absorption wasn’t as strong as expected based on models using formation mechanisms from a nebula with solar composition and forming a planet with a cloudless atmosphere. Instead, the team describes 17b’s atmosphere as “sodium-depleted” similar to HD 209458b.

An additional observation was that the depth of seeing dropped off when using certain filters with different bandwidths (ranges of allowed wavelengths). The team noted that at bandwidths greater than 3.0 Å, the amount of sodium absorption seen nearly disappeared. Since this property is related to how much atmosphere the light travels through, this allowed the team to speculate that this may be indicative of clouds in the upper layers of the atmosphere.

Lastly, the team speculated as to the reason on the lack of sodium in the atmosphere. They proposed that energy from the star ionizes sodium on the day side. The motion of the atmosphere carrying it to the night side would then allow it to condense and be removed from the atmosphere. Since giant exoplanets in such tight orbits would likely be tidally locked, the sodium would have little chance to return to the day side and be brought back into the atmosphere.

While the examination of extrasolar atmospheres is undoubtedly new and will certainly be revised as the number of explored atmospheres increases, these pioneering studies are among the first that can allow astronomers directly test predictions of planetary atmospheres which, until recently have been solely based on observations of our own solar system. More generally, this will allow us to develop a fuller understanding of how planets evolve.

Absorption Spectroscopy

Absorptivity
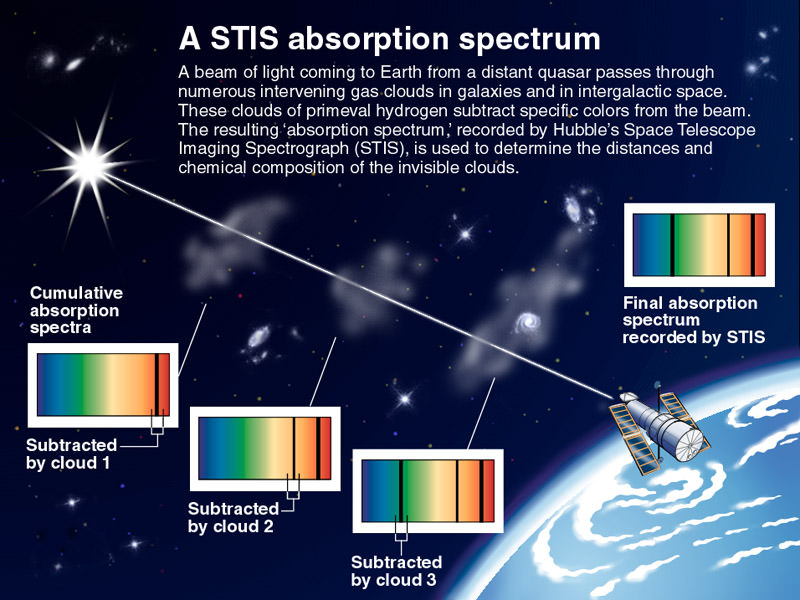
Absorption Spectrum by the Hubble Space Telescope

[/caption]

In terms of physics, absorption is defined as the way that energy from photons is taken up by matter, and transformed into other forms of energy, like heat. All of the light in the electromagnetic spectrum is made up of photons at different energy levels. Radio waves are photons with lower amounts of energy, and gamma rays are photons with very high levels of energy. When a photon strikes matter, it can either be reflected or absorbed by the material. And if it is absorbed, the energy of the photon is transformed into heat.

The absorbance of an object is a measure of what percentage of the electromagnetic radiation it’s likely to absorb. Transparent or reflective objects absorb much less than opaque, black objects.

This concept is very important to astronomers, who are able to measure which wavelengths of light are being absorbed by an object or cloud of gas, to get an idea of what it’s made of. When you put the light from a star through a prism, you get a spectrum of the light coming from that star. But in some spectra, there are blank lines, gaps where no photons of a specific wavelength are being emitted. This means that some intervening object is absorbing all of the photons of this wavelength.

For example, imagine looking at how the light from a star passes through a planet’s atmosphere which is rich in sodium. This sodium will absorb photons at a specific wavelength, creating gaps in the spectrum from the light of the star. By comparing these gaps to the absorption line pattern of known gasses, astronomers can work out what’s in the planet’s atmosphere. This general method is used in many ways by astronomers to learn what distant objects are made out of.

The opposite of absorption is emission. This is where different elements will release photons when they’re heated. Different elements will release photons at different levels of energy, and their colors on the electromagnetic spectrum help astronomers discover what elements the object is made out of. When iron is heated, it releases photons in a very specific pattern, different from the pattern released by oxygen.

Both the absorption and emission serve as a fingerprint to help astronomers understand what the Universe is made out of.

We have written many articles about Absorption Spectroscopy for Universe Today. Here’s an article about amateur spectroscopy, and here’s an article about the light spectrum.

If you’d like more info on Absorption Spectroscopy, check out the Principles of Spectroscopy, and the Infrared Spectroscopy Page.

We’ve also recorded an episode of Astronomy Cast all about the Hubble Space Telescope. Listen here, Episode 88: The Hubble Space Telescope.

Source:
Wikipedia

Atomic Spectra

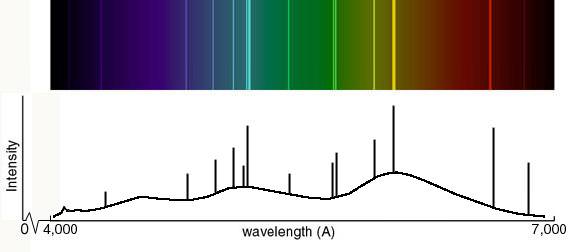
An example of an atomic spectrum, showing emission lines at particular wavelengths.

The light which atoms give off is made up of specific wavelengths, called lines; observed by a spectroscope, the lines are, collectively, atomic spectra.

In more detail …

In an atom, electrons have specific and discrete energies. There are many more energy states (or levels) in each atom than there are electrons. When an electron transitions (‘jumps’) from one energy level to another, it emits (if going from a higher level to a lower one) or absorbs (vice versa) light – a photon – with a discrete, specific wavelength. In any given set of conditions (pressure, temperature, magnetic field strength, etc), the collection of all those specific wavelengths is the spectrum of the atom … so atomic spectra are the spectra of atoms!

As the atomic electron energy levels are unique to each element, the lines in a spectrum (emission or absorption) can be used to identify the elements present in the source (a star, say) or gas between the source and us (e.g. the interstellar medium). Of course, for an extragalactic object – a quasar, perhaps – you need more than one line to make a certain identification … because the universe is expanding (and so you don’t know how much just one line may have been redshifted).

The light electronic transitions in atoms produces may not be in the visual part of the electromagnetic spectrum, but for atoms that are neutral or have lost only one or two electrons (yes, ‘atomic spectra’ refers to the line spectrum of ions too!), most lines are in the UV, visual, or near infrared. For highly ionized atoms, the lines are found in the extreme UV or x-ray region.

As the relative intensity of the lines in an atomic spectrum varies with temperature, analysis of the lines in the spectrum of a star (say) can give an estimate of the temperature of the star’s surface (photosphere). The width of the lines depends on the pressure of the gas; the structure of the lines depends on the magnetic field strength; the … (you get the idea) – atomic spectra are a wonderful window into the physical conditions of places far, far away!

Looking for more? This University of Oregon webpage has a good, brief, description of atomic spectra; and Physics Lab’s Atomic Models and Spectra covers both the historical context and a bit more of the theory.

As atomic spectra play such a vital role in optical astronomy, no wonder there are so many Universe Today articles involving atomic spectra! Here’s a random selection: New Study Find Fundamental Force Hasn’t Changed Over Time, Spitzer Discovers Early Galaxy Forming Region, and Strange Nebula Around Eta Carinae .

The Astronomy Cast episode Energy Levels and Spectra is all about atomic spectra. Other Astronomy Cast episodes well worth a listen, in regard to atomic spectra, include Optical Astronomy and In Search of Other Worlds.

Sources:
GSU Hyperphysics
NIST

Light Spectrum

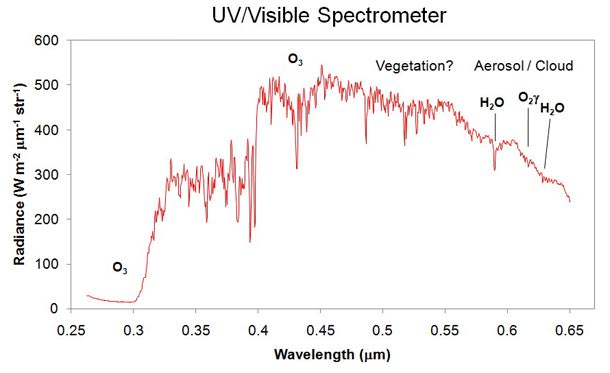
LCROSS UV/Visible spectrum. Credit: NASA

Light spectrum can mean the visible spectrum, the range of wavelengths of electromagnetic radiation which our eyes are sensitive to … or it can mean a plot (or chart or graph) of the intensity of light vs its wavelength (or, sometimes, its frequency). More possible ambiguity: ‘light’ … which can refer to what we see, or to the part of the electromagnetic spectrum that optical telescopes (especially the ones down here on the ground) work in (and sometimes, just occasionally, it means the whole of the electromagnetic spectrum, or any electromagnetic radiation). Good news: the context makes it clear!

The realization that visible light is made up of colors is most often attributed to Isaac Newton (though a strong case can be made that it was known well before him), who used a prism to create a spectrum (rainbow of colors) from a beam of white light, and another to recombine them back into white light. And what’s it called when you spread light into a spectrum, for the purpose of studying it (in astronomy, chemistry, …)? Spectroscopy. And is there a different word if it’s infrared, ultraviolet, x-rays, … which are spread into a spectrum (rather than visible light)? Nope, it’s still spectroscopy.

Visible light ranges from about 380 nanometers (nm) to about 750 nm (or, as is still common in astronomy, ~3800 angstroms (Å) to ~7500 Å); the window in the Earth’s atmosphere which allows us to do astronomy from down here on its surface (and lets the light of the Sun through, so we can see!) is a bit wider than the visible spectrum; it goes from about 300 nm to about 1100 nm (or 1.1 µ).

To an astronomer, a light spectrum has two main components, the continuum and the lines (sometimes bands as well). The lines are discrete wavelengths (well, they do have some ‘width’, hence ‘narrow lines’ and ‘broad lines’), either emission or absorption, and correspond to a particular atomic transition (an electron jumps between one allowed energy level in an atom, or ion, and another; bands are the same thing, except for molecules … and the allowed states are either vibrational or rotational). And the continuum? Well, it’s the part that isn’t lines! It varies smoothly, and generally slowly, across the spectrum.

Spectroscopy – analysis of the light spectrum – is one of the most powerful tools astronomers use to work out what’s going on, and what it’s like, way out there where the light from the sky originates. Do you know why? If not, then these two NASA webpages will help! Visible Light Waves , and Electromagnetic Spectrum.

It’s such a broad topic, light spectrum, no wonder Universe Today has so many articles on it! For example, Amateur Spectroscopy, Atmosphere of an Extrasolar Planet Measured, and Oops, the Universe is Beige.

Astronomy Cast has several good episodes on the spectrum of light; here’s two to get you started Energy Levels and Spectra, and Detectors.

Amateur Spectroscopy

Credit: Robert Kaufman's image of Tarantula and Orion spectra (used with permission)

[/caption]

Amateur astronomers are a unique species worthy of their own reality TV show. Their craftsmanship, resourcefulness, dedication, and passion is simply amazing. Many professional astronomers rely heavily on amateurs for quick spot checks, discovery followups, collaboration on research projects, the diverse locations of their telescopes and their ability/willingness to put in long hours of observation. So what is spectroscopy, and what do the amateur astronomers get up to?

Absorption spectroscopy is the study of the color and light spectrum of stars and galaxies. We all love our Hubble photos and pretty astro-photographs, however most of the real research and science comes from observing the light spectrum.

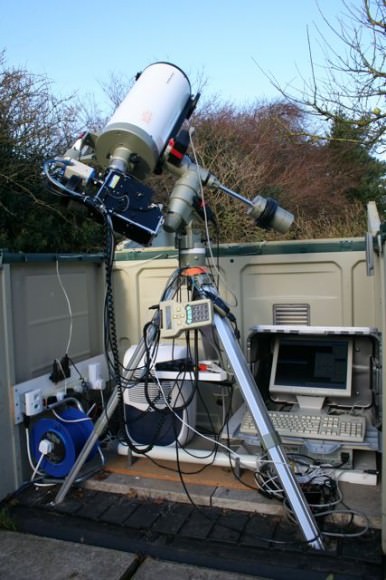
Robin Leadbeater’s LHIRESIII Spectrograph

Robin Leadbeater's telescope with LHRESIII spectrograph

Astronomers look at emission lines and absorption lines in the spectra to determine the make up of stars, nebulas and galaxies. Dopler effects, orbital behavior, elements of stars, even atmospheres can be determined by observing these absorption and emission lines. Scientists believe that a carbon dioxide absorption spectrum line signature in the spectrum of a star with a transiting exo-planet could eventually be the most exciting discovery – a possible indicator of extra-terrestrial life.

Why are amateurs interested?

I asked Ken Harrison the moderator of the Yahoo group – Astronomical Spectroscopy, why amateurs would be interested in absorption spectra?

“I see it as the “last frontier” for amateur astronomers. When you’ve taken the 100th image of the Orion nebulae – what do you do next?? It’s challenging, interesting and can give some scientific value to your work. Amateurs have successfully recorded the spectra of nova before the professionals and complimented other variable star work with observations of the changing spectral emissions of stars showing their Doppler shifts and atmospheric changes.”

Ken specializes in the spectra of Wolf-Rayet stars and is currently writing a book on amateur spectroscopy. Ken has been building his own spectrographs since 1992 and has used a variety of devices ranging from a simple star analyzer on a digital SLR camera to a sophisticated guided spectrograph.

A spectrograph allows light to pass through a narrow slit where it is then split into it’s spectra by passing through some sort of diffraction grating, before being captured on a CCD. The plate scale of the CCD then comes into play as angstroms per pixel instead of the usual (astrometric measure) arc/secs per pixel.

Rob Kaufman recently captured a Nova outburst Nova Scuti 2009 (V496 SCT) between the trees and clouds from his back yard.

Rob Kaufman spectrograph of Nova Scuti 2009 (V496 SCT) outburst
Credit: Rob Kaufman's spectrogram of Nova Scuti 2009 (V496 SCT) outburst

Italian amateur Fulvio Mete has achieved a spectrographic separation of tight binary Beta Aurigea. The double Ha absorption line is easily identifiable in his image taken with a 14inch Celestron. Some of the world’s best telescopes are unable to separate Beta Aurigea optically, so being able to do a spectrographic separation with a back yard telescope is a significant achievement.

Fulvio Metes spectrograph of Beta Aurigae
Fulvio Mete's spectrogram of Beta Aurigae

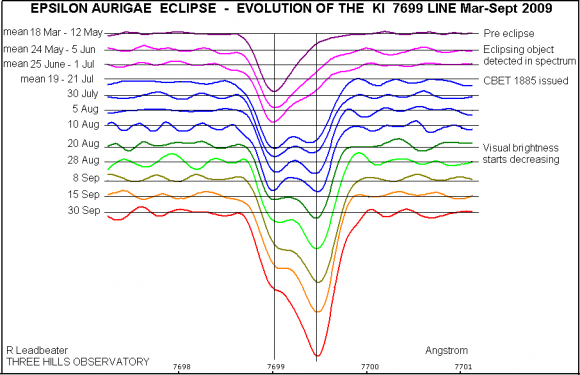
Perhaps there is no finer example of the quality of the spectroscopy done by amateurs than the current citizen science project on the eclipse of binary Epsilon Aurigae. Robin Leadbeater from Three Hills Observatory, a team member/contributor to the Citizen Sky project and avid amateur astronomer, has documented the changing spectra of Epsilon Aurigae, in particular monitoring the changing KI (neutral potassium) 7699 absorption line during the early stages of the ingress.

Robin Leadbeater's Spectrogram of KI 7699 absorption line in Epsilon Aurigae eclipse.

The eclipse happens every 27 years and this eclipse will be the first to be fully documented with advanced spectroscopy – clearly alot of that will be performed by skillful amateurs.

So what equipment do I need?

Ken Harrison comments that the equipment required is not necessarily expensive and it is a lot of fun.

“Luckily with the filter gratings available at reasonable prices (Star Analyser, Rainbow Optics etc) interested amateurs can start using their current equipment with minimal cost and outlay. Freeware programs like IRIS (C Buil) and VSpec (V Desnoux) allow the detailed analysis of spectra to be done without all the mathematics or detailed physics. As experience grows so do the questions. What do those absorption features mean? Why does this spectrum look completely different from that spectrum? How can I get benn resolution? Yes, it has its learning curve like any new adventure, but there are many others who have trodden the road before and only too willing to assist  – To boldly go where few amateurs have gone before – Spectroscopy!!!”

Dale Mais another dedicated amateur from Orange Grove, San Diego County has an excellent paper on qualitative and quantitative analysis that can be achieved by amateur astronomers.

The contribution of amateurs across all forms of astronomy is significant, and spectroscopy is no exception. If you want more information join one of the Yahoo groups or major amateur astronomy forums as they all have discussion groups with experienced people who are keen to help you get started.

Special thanks to Ken Harrison, Robin Leadbeater, Rob Kaufman, Fulvio Mete and Dale Mais for your photos and insight!