Twinkle Twinkle Little Missing Stars, How I Wonder Where you are?

Why is Our Galaxy Called the Milky Way

[/caption]

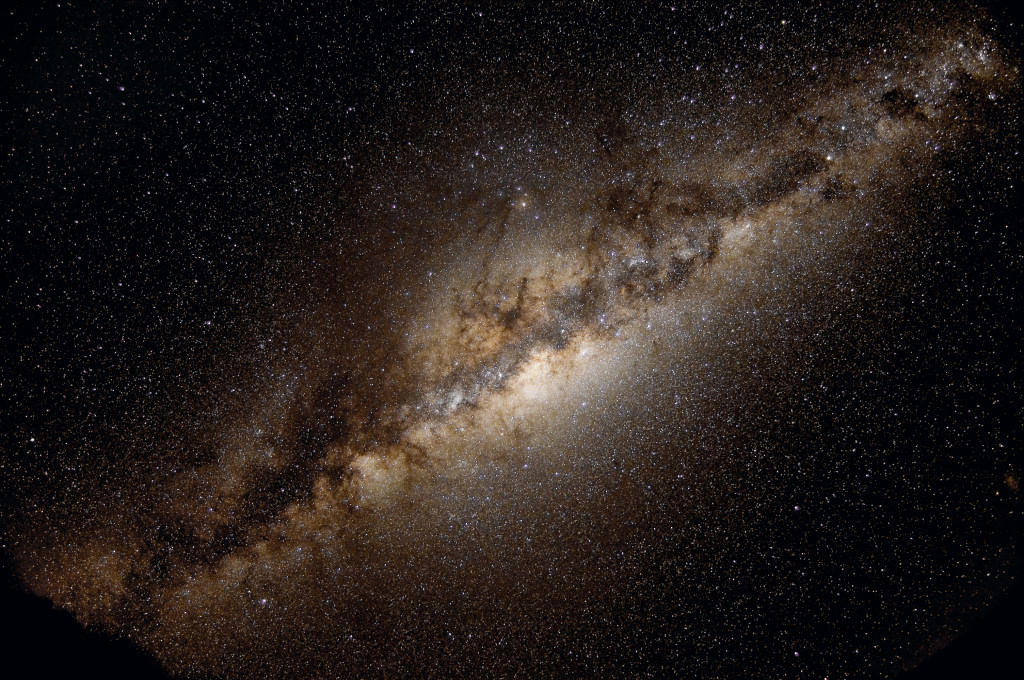
‘Twinkle twinkle little star, how I wonder what you are?’ This nursery rhyme is one of the best loved around the World. For astronomers though, stars can be a bit more of a nightmare, not only in understanding their complex evolutionary processes but also and perhaps more simply, figuring out how many there are. Until now there has been a gross mismatch between the number of stars that are found within our galaxy, the Milky Way and the amount that astronomer think should be there. In short, where are the missing stars?

The Milky Way is joined by about 30 other galaxies that make up our local group of galaxies, including the Andromeda Galaxy and according to current theories there should be about 100 billion stars in each. The calculations are based on the rate of star birth in the Milky Way, about 10 new stars per year. But according to Dr Jan Pflamm-Altenburg of the Argelander Institute for Astronomy at the University of Bonn “Actually, it would give many more stars than we actually see” and therein lies the problem.

The recent study by Dr Pflamm-Altenburg and Dr. Carsten Weidner of the Scottish St. Andrews University suggests that perhaps the estimated rate of star birth being used to calculate the number of stars could simply be too high. With galaxies in our Local Group its relatively easy to just count the number of new stars that can be seen but for more distant galaxies, they are too far away for individual stars to be seen.

By studying the nearby galaxies, Pflamm-Altenburg and Weidner discovered that for every 300 young small stars, there seems to be one large massive new star and fortunately this seems to be universal. Due to the unique nature of the massive young stars, they leave a tell tail sign in the light of distant galaxies so even though they cannot be individually identified they can still be detected and the strength of the signal determines the number of massive stars. Multiply by the number of massive stars by this ratio of 300 and the actual rate of stellar birth can be calculated.

It seems though that this rate has varied over the history of the Universe and dependent on the amount of ‘space’ available in the vicinity of the star formation. If there is a baby boom in star formation then a higher number of heavies seem to form in a theory called ‘stellar crowding’. When stars form, they form as clusters rather than individual stars but it seems that the overall mass of the group is the same, regardless of how many star embryo’s there really are. When star birth is at a high rate, space can be limited so larger more massive stars tend to form compared to smaller stars.

Massive galaxies like this where star birth is booming are called “ultra-compact dwarf galaxies” (UCDs). Sometimes its possible in these galaxies that young stars can even fuse together to form larger stars so the large to small ratio can be around 1:50 instead of 1:300. This means we have been using the wrong figure and estimating far too high.

Using this new found figure, Pflamm-Altenburg and Weidner have recalculated the number of stars that ‘should’ be in a galaxy and compared to those that we can see and rather pleasantly, the numbers match! It seems that the conundrum of the missing stars that has been perplexing astronomers for decades has finally been resolved.

Source: University of Bonn

Dissolving Star Systems Create Mess in Orion

For young stars, stellar outflows are the rule. T Tauri stars and other young stars eject matter in generally collimated jets. However, a region in Orion’s giant molecular cloud known as the Becklin-Neugebauer/Kleinmann-Low (BN/KL) region, appears to have a clumpy, scattered set of outflows with “finger-like” projections in numerous directions. A new study, led by Luis Zapata at the National Autonomous University of Mexico, explores this odd region.

To conduct their study, the team used the Submillimeter Array to trace the motion of carbon monoxide gas in the area. Flying away from this region are three massive and young stars. Tracing their paths back, astronomers had previously determined that these stars likely had a common origin as members of a multiple system that for some reason, broke apart an estimated 500 years ago. Likely related to this, the new study discovered several new fingers of gas moving away as well with velocities that implied they came from the same point of origin near the same time. But what could send stars and gas hurtling outwards?

Nearby, the team also discovered a “hot core” of material as well as a “bubble” of empty space near the point of origin of the event. To explain the combination of these three events, the team proposes that an close interaction between the three stars (or perhaps more) occurred. At that time, the interaction tore apart any potential binary system throwing the stars outwards.

Since the stars are young and still embedded in a nebula, the team suggests it was likely they also contained circumstellar disks that had not yet formed planets. During the interaction, the outer portions which would be least strongly bound, were thrown outwards, creating the finger-like projections. Material that was bound more tightly but just enough to be torn off, “would find itself with an excess of kinetic energy, and will start to expand” creating the apparent bubble. If that bubble, expanding supersonically for the local medium, encountered a region that was overly dense, it would collide, heating the region and potentially forming the hot core.

This new discovery presents a potential first for the discovery of one or more destroyed circumstellar disks. Such findings could help impose new constraints on how planetary systems form since most stars form in open clusters and associations in which such interactions may be commonplace. Yet, the very fact that such destroyed systems have never been found until now imply that interactions sufficiently close to cause such disruption are rare. Regardless, such things will help astronomers form a better picture of the formation of planets.

Star Cluster

WISE Reveals a Hidden Star Cluster

[/caption]

There are few things in astronomy more awe inspiring and spellbinding than the birth of a star. Even though we now understand how they are formed, the sheer magnitude of it is still enough to stir the imagination of even the most schooled and cynical academics. Still, there is some degree of guesswork and chance when it comes to where stars will be born and what kind of stars they will become. For example, while some stars are single field stars (like our Sun), others form in groups of two (binary) or more, sometimes much more. This is what is known as a Star Cluster, by definition, a group of stars that share a common origin and are gravitationally bound for some length of time.

Thereare two basic categories of star clusters: Globular and Open (aka. Galactic) star clusters. Globular clusters are roughly spherical groupings of stars that range from 10,000 to several million stars packed into regions ranging from 10 to 30 light years across. They commonly consist of very old Population II stars – which are just a few hundred million years younger than the universe itself – and are mostly yellow and red. Open clusters, on the other hand, are very different. Unlike the spherically distributed globulars, open clusters are confined to the galactic plane and are almost always found within the spiral arms of galaxies. They are generally made up of young stars, up to a few tens of millions of years old, with a few rare exceptions that are as old as a few billion years. Open clusters also contain only a few hundred members within a region of up to about 30 light-years. Being much less densely populated than globular clusters, they are much less tightly gravitationally bound, and over time, will become disrupted by the gravity of giant molecular clouds and other clusters.

Star clusters are particularly useful to astronomers as they provide a way to study and model stellar evolution and ages. By estimating the age of globular clusters, scientists were able to get a more accurate picture of how old the universe is, putting it at roughly 13 billion years of age. In addition, the location of star clusters and galaxies is believed to be a good indication of the physics of the early universe. This is based on aspects of the Big Bang theory where it is believed that immediately after the creation event, following a period of relatively homogenous distribution; cosmic matter slowly gravitated to areas of higher concentration. In this way, star clusters and the position of galaxies provide an indication of where matter was more densely distributed when the universe was still young.

Some popular examples of star clusters, many of which are visible to the naked eye, include Pleiades, Hyades, the Beehive Cluster and the star nursery within the Orion Nebula.

We have written many articles about star cluster for Universe Today. Here’s an article about a massive star cluster discovered, and here are some amazing star cluster wallpapers.

If you’d like more information on stars, check out Hubblesite’s News Releases about Stars, and here’s the stars and galaxies homepage.

We’ve done many episodes of Astronomy Cast about stars. Listen here, Episode 12: Where Do Baby Stars Come From?

Sources:
http://en.wikipedia.org/wiki/Star_cluster
http://universe-review.ca/F06-star-cluster.htm
http://outreach.atnf.csiro.au/education/senior/astrophysics/stellarevolution_clusters.html
http://www.sciencedaily.com/articles/s/star_cluster.htm
http://en.wikipedia.org/wiki/Stellar_populations#Populations_III.2C_II.2C_and_I
http://www.sciencedaily.com/articles/g/galaxy_formation_and_evolution.htm

Interstellar Scintilation

Barnard 68 (Credit: ESO)

[/caption]

Anyone who has looked at stars in the night sky (especially ones low on the horizon) has undoubtedly seen the common effect of twinkling. This effect is caused by turbulence in the atmosphere as small over densities cause the path of the light to bend ever so slightly. Often, vivid color shifts occur since the effects are wavelength dependent. All of this happens in the short distance between the edge of the atmosphere and our eyes. Yet often times, giant molecular clouds lie between our detectors and a star. Could these clouds of gas and dust cause a twinkling effect as well?


In theory, there’s no reason they shouldn’t. As the giant molecular clouds intercepting the incoming starlight move and distort, so too should the path of the light. The difference is that, due to the extremely low density and extremely large size, the timescales over which this distortion would take place would be far longer. Should it be discovered, it would provide astronomers another method by which to discover previously hidden gas.

Doing this is precisely the goals of a team of astronomers working from the Paris University and Sharif University in Iran. To get and understanding of what to expect, the team first simulated the effect, taking into account the properties of the cloud (distribution, velocity, etc…) as well as refraction and reflection. They estimated that, for a star in the Large Magellanic Cloud with light passing through typical galactic H2 gas, this would produce twinkles with changes taking around 24 minutes.

Yet there are many other effects which can produce modulations on the same timescale such as variable stars. Additional constraints would be necessary to claim that a change would be due to a twinkling effect and not a product of the star itself. As stated before, the effect is different for different wavelengths which would produce a “variation of the characteristic time scale … between the red side of the optical spectrum and the blue side.”

With expectations in hand, the team began searching for this effect in areas of the sky in which they knew especially high densities of gas to exist. Thus, they pointed their telescopes towards dense nebulae known as Bok globules like Barnard 68 (pictured above). Observations were taken using the 3.6 meter ESO NTT-SOFI telescope since it had the capabilities to also take infrared images and better explore the potential effects on the red side of the spectrum.

From their observations over two nights, the team discovered one instance in which the modulation of brightness in the different wavelengths followed the predicted effects. However, they note that from a single observation of their effects, it does not conclusively demonstrate the principle. The team also observed stars in the direction of the Small Magellanic Cloud to attempt to observe this twinkling effect in that direction due to previously undetected clouds along the line of sight. In this attempt, they were unsuccessful. Further similar observations along these lines in the future could help to constrain the amount of cold gas within the galaxy.

Where are Stars Born?

Spitzer Uncovers Star Hatchery

Have you ever wondered where stars are born? Stars are formed in nebulas, interstellar clouds of dust and gas. Nebulas are either remnants of matter from the original big bang or the result of stars either collapsing or going supernova. Nebulas have long been noted and observed by astronomers but very little was known about them until the 21st century.

Galaxies because of their similar appearance were once thought of as nebulas. It was later determined that they were actually larger grouping of stars a great distance away from the Earth. So how are Nebulas star forming regions? The answers lie in the gravitational force and nuclear fusion.

Most nebulas are disparate clouds of gas and cosmic dust floating in the interstellar medium. Nebulas are the more dense parts of the gas and dust that exist in the space between stars and galaxies. We know due to the law of universal gravitation that every particle in the universe exerts an attractive force on every other particle. This happens over times with nebulas as the particles that make up the interstellar medium start to gather together.

Since gases have mass it is inevitable that the process will continue as great mass will create a stronger gravitational field. At some undefined point in time a tipping point between the gas pressure and the gravity of the nebula is crossed and the nebula collapses under its own gravity. Since molecular hydrogen is the most abundant element in the nebula the pressure from the collapse causes the nebula to undergo nuclear fusion. This starts the birth of a star.

As evidenced by how many stars and galaxies are in the universe you can see that is process that happens just about everywhere. More recently scientists have started become interested in how common it is for stars to from planets, especially those that are likely to support life. Scientists have recently discovered one such planet Gliese 581-g. This planet while closer to it star than Earth is well with in habitable zone necessary for liquid water and the right temperatures for life to occur.

The study of nebulas and the interstellar medium have yielded a lot important information about the formation and stars. As better telescopes and probes are created we will get a clearer picture about our universe and how it was formed and continues to grow over time.

We have written many articles about the birth of stars for Universe Today. Here’s an article about the star birth myth, and here’s an article about the birth of the biggest stars.

If you’d like more information on stars, check out Hubblesite’s News Releases about Stars, and here’s the stars and galaxies homepage.

We’ve done many episodes of Astronomy Cast about stars. Listen here, Episode 12: Where Do Baby Stars Come From?

References:
http://burro.astr.cwru.edu/stu/stars_birth.html
http://sunshine.chpc.utah.edu/labs/star_life/starlife_proto.html

Gemini’s New Filters Reveal the Beauty of Star Birth

Sharpless 2-106 (Gemini Observatory/AURA, right; left: copyright Subaru Telescope, National Astronomical Observatory of Japan; All rights reserved)

[/caption]
About 2,000 light-years away, in the constellation of Cygnus (the Swan), lies Sharpless 2-106 (after Stewart Sharpless who put the catalog together in 1959), the birth-place of a star cluster-to-be.

Two recent image releases – by Subaru and Gemini – showcase their new filter sets and image capabilities; they also reveal the stunning beauty of the million-year-long process of the birth of a star.

Sharpless 2-106 (Gemini Observatory/AURA)

The filter set is part of the Gemini Multi-Object Spectrograph (GMOS) toolkit, and includes ones centered on the nebular lines of doubly ionized oxygen ([OIII] 499 nm), singly ionized sulfur ([SII] 672 nm), singly ionized helium (HeII 468nm), and hydrogen alpha (Hα 656 nm). The filters are all narrowband, and are also used to study planetary nebulae and excited gas in other galaxies.

The hourglass-shaped (bipolar) nebula in the new Gemini image is a stellar nursery made up of glowing gas, plasma, and light-scattering dust. The material shrouds a natal high-mass star thought to be mostly responsible for the hourglass shape of the nebula due to high-speed winds (more than 200 kilometers/second) which eject material from the forming star deep within. Research also indicates that many sub-stellar objects are forming within the cloud and may someday result in a cluster of 50 to 150 stars in this region.

The nebula’s physical dimensions are about 2 light-years long by 1/2 light-year across. It is thought that its central star could be up to 15 times the mass of our Sun. The star’s formation likely began no more than 100,000 years ago and eventually its light will break free of the enveloping cloud as it begins the relatively short life of a massive star.

For this Gemini image four colors were combined as follows: Violet – HeII filter; Blue – [SII] filter; Green – [OIII] filter; and Red – Hα filter.

Sharpless 2-106 (Copyright Subaru Telescope, National Astronomical Observatory of Japan. All rights reserved)

The Subaru Telescope image was made by combining images taken through three broadband near-infrared filters, J (1.25 micron), H (1.65 micron), and K’ (2.15 micron).

Sources: Gemini Observatory, NAOJ

Do Eruptions of P Cygni Point to a Companion?

The other day, I wrote an article on Luminous Blue Variables (LBVs) which made reference to P Cygni as a well established LBV to which a group made comparisons. While P Cygni is a good example of an LBV, it has many interesting characteristics in its own right. Prior to August 8, 1600, the star was not known to exist, when suddenly, it appeared, flaring to 3rd magnitude. Over the next hundred years it continued to undergo outbursts, fading and brightening.

New research by Amit Kashi of the Israel Institute of Technology suggests this series of flares may be due to the presence of a second star in orbit around P Cygni.Many other Luminous Blue Variables, such as Eta Carinae, are suspected to be binary systems. However, the overwhelming brightness of LBV stars makes it difficult to directly detect stars that would otherwise be considered bright. Kashi takes this further and suggests “all major LBV eruptions are triggered by stellar companions”. In this scenario, as a smaller companion in the system came on its closest approach (periastron) the outer layers of the LBV, which are already unstable and loosely bound due to the size of the star, are pulled off due to tidal forces. The gravitational energy as it merges with the companion is turned into thermal energy and this increases the overall brightness until it is fully absorbed. The cause of such a mass transfer would decrease the orbital size of the companion and result in the next outburst being sooner than if the orbit were constant. Kashi suggests “[t]his process repeats until the instability in the LBV stops. From that point on the orbital period remains approximately stable, changing only very slightly due to mass loss from the LBV, and tidal interaction.”

To test his hypothesis, Kashi modeled a system with a LBV star of similar mass to that estimated for P Cygni and put a 3 solar mass star in a highly eccentric orbit around it. With these simple starting parameters, Kashi showed that it was possible to produce a situation in which the onset of eruptions was similar to the periastron approach. However, there were some uncertainties due to a lack of records during the time period which puts the true beginning of the eruptions in question. Furthermore, Kashi retested his model for a 6 solar mass companion and showed the similarity between periastrons and eruptions was still a good fit making the model robust.

Image from Kashi (2009) showing model orbit superimposed on historical light curve data

However, this still leaves many variables for the models unconstrained and able to be fiddled with to make the model fit (Insert joke about being able to fit a curve to a cow with enough degrees of freedom here). Unfortunately, Kashi notes that further testing may be difficult. As earlier mentioned, direct detection of a companion would be hampered by the brightness of the LBV. Even detecting a companion spectroscopically would be difficult if not impossible. The reason is that the wind from P Cygni causes the absorption lines in its spectra to be broadened. For Kashi’s model system, the doppler shift from the companion is not large enough to shift the lines more than they are already broadened which would make detecting the change in radial velocity a challenge. He notes, “the probability of detecting radial velocity due to orbital motion in spectral lines is small for most of the orbit, but might be possible every 7 years, if the inclination angle is large enough. I therefore predict that a continuous 7 year long observation of pronounced lines may reveal a small doppler shift variation, close to the periastron passage.”

MN112 – A New Luminous Blue Variable Found From Its Nebula?

Eta Carinae. One of the most massive stars known. Image credit: Hubble

[/caption]

Luminous Blue Variables (LBVs) are a rare class of extremely massive stars that teeter on the very edge of being stable. The most famous of this class of stars is the well studied Eta Carinae. Like many other LBVs, Eta Carinae is shrouded in a nebula of its own making. The instability of the star causes it to throw off large amounts of mass even during its brief main sequence lifetime. What makes these stars so unstable is an open question which has been difficult to answer do the the paucity of known LBVs. Given that the initial mass function predicts that such massive stars should be rare, this is not surprising, but identifying these stars is often made even more difficult due to the reddening caused by their nebulae.

However, an international team working from Russia and South Africa proposes that the nebula itself may be able to help identify potential candidates of LBVs. To test out their hypothesis, they scanned the Spitzer image archives for nebulae with features similar to those of known LBVs. The feature that distinguished potential LBV nebulae from other nebulae was emission only in the 24 ?m images (likely due to the fact that nebulae do not operate as model blackbodies at such wavelengths, but instead emit most strongly at specific wavelengths due to fluorescence).

In their review of potential nebulae, they identified a one known as MN112. To further explore the possibility, the team took high resolution spectra of the central star. They determined the central star had strong similarities to the known LBV P Cygni. Most notably, the candidate LBV showed very strong emission lines for hydrogen and He I right next to absorption lines for the same elements. This is caused by high pressure regions, either in the atmosphere of the star, or as the faster wind from the star interacts with a slower moving nebula around it. The high pressure region becomes more dense and gives emission lines. Since it moves outwards, it is slightly blueshifted and thus, does not appear directly on top of the absorption line caused by the relatively less dense atmosphere. This time of feature is known as a P Cygni profile.

Another identifying feature of Luminous Blue Variables is that they are variable (Surprise!) up to as much as 1-2 magnitudes. The team had records of the star from photographic plates dating back as far as 1965 as well as more recent CCD measurements and found that the star had not been seen to vary significantly from an apparent blue magnitude (mB) of 17. However, in the infrared region, they determined (using their own photometric observations) that the star had brightened by 0.4 magnitudes over the past 19 years. Although this falls short of the expected variability for a LBV, they suggest “it is quite possible that a significant fraction of LBVs (if not all of them) goes through the long quiescent periods (lasting centuries or more; e.g. Lamers 1986) so that the fast variability (on time
scales from years to decades) observed in the vast majority of classical LBVs could be merely due to the selection effect.”

The authors state their intention to continue observation of this candidate LBV “in the hope that the ”duck” will ”quack” in the foreseeable future.”

Distance to Alpha Centauri

Alpha Centauri is the closest known star system to the Solar System. Also known as Rigil Kentaurus, Alpha Centauri is actually a multiple star system. It’s certainly a binary star, with two sunlike stars orbiting one another. And there’s also a red dwarf star, Proxima Centauri, which astronomers still argue about whether it’s part of the system.

The closest star in the group is Proxima Centauri, located only 4.243 light-years from the Sun. And then the Alpha Centauri AB stars are located 4.37 light-years away.

With the unaided eye, Alpha Centauri looks like a single star. But then under the power of a telescope, it’s possible to split them and see the individual stars separately. Alpha Centauri is only really prominent in the southern skies, and below the horizon to astronomers in the north.

Alpha Centauri A is slightly larger and more luminous than the Sun, while Alpha Centauri B is smaller and cooler than the Sun. But Proxima Centauri is a tiny red dwarf star, with only 1/8th the mass of the Sun.

We’ve written several articles about the Alpha Centauri system. Here’s an article about how we might be able to detect Earthlike planets around Alpha Centauri, and here’s an article about the sounds of Alpha Centauri.

Here’s a cool image of Alpha Centauri at Astronomy Picture of the Day.

We’ve also recorded an episode of Astronomy Cast about what it might take to travel to Alpha Centauri. Listen here, Episode 145: Interstellar Travel.

Can the Recurrent Novae RS Oph Become Type Ia Supernovae?

A new kind of supernova. Credit: Tony Piro

[/caption]

The classical scenario for creating Type Ia supernovae is a white dwarf star accreting mass from a nearby star entering the red giant phase. The growing red giant fills its Roche lobe and matter falls onto the white dwarf, pushing it over the Chandrasekhar limit causing a supernova. However, this assumes that the white dwarf is already right at the tipping point. In many cases, the white dwarf is well below the Chandrasekhar limit and matter piles up on the surface. It then ignites as a smaller nova blowing off most (if not all) of the material it worked so hard to collect.

A new paper by a group of European astronomers considers how this cycle will affect the overall accumulation of mass on the white dwarfs which undergo recurrent novae. In a previous, more simplistic 1D study (Yaron et al. 2005) simulations revealed that a net mass gain is possible if the white dwarf accumulates an average of 10-8 times the mass of the Sun each year. However, at this rate, the study suggested that most of the mass would be lost again in the resulting novae, and even a minuscule gain of 0.05 solar masses would take on the order of millions of years. If this was the case, then building up the required mass to explode as a Type Ia supernova would be out of reach for many white dwarfs since, if it took too much longer, the companion’s red giant phase would end and the dwarf would be out of material to gobble.

For their new study, the European team simulated the case of RS Ophiuchi (RS Oph) in a 3D situation. The simulation did not only take into consideration the mass loss from the giant onto the dwarf, but also included the evolution of the orbits (which would also influence the accretion rates) and varied rates for the velocity of the matter being lost from the giant. Unsurprisingly, the team found that for slower mass loss rates from the giant, the dwarf was able to accumulate more. “The accretion rates change from
around 10%  [of the mass of the red giant] in the slow case to roughly 2% in the fast case.”

What was not immediately obvious is that the loss of angular momentum as the giant shed its layers resulted in a decrease in the separation of the stars. In turn, this meant the giant and dwarf grew closer together and the accretion rate increased further. Overall they determined the current accretion rate for RS Oph was already higher than the 10-8 solar masses per year necessary for a net gain and due to the decreasing orbital distance, it would only improve. Since RS Oph’s mass is precipitously close to the 1.4 solar mass Chandrasekhar limit, they suggest, “RS Oph is a good candidate for a progenitor of an SN Ia.”