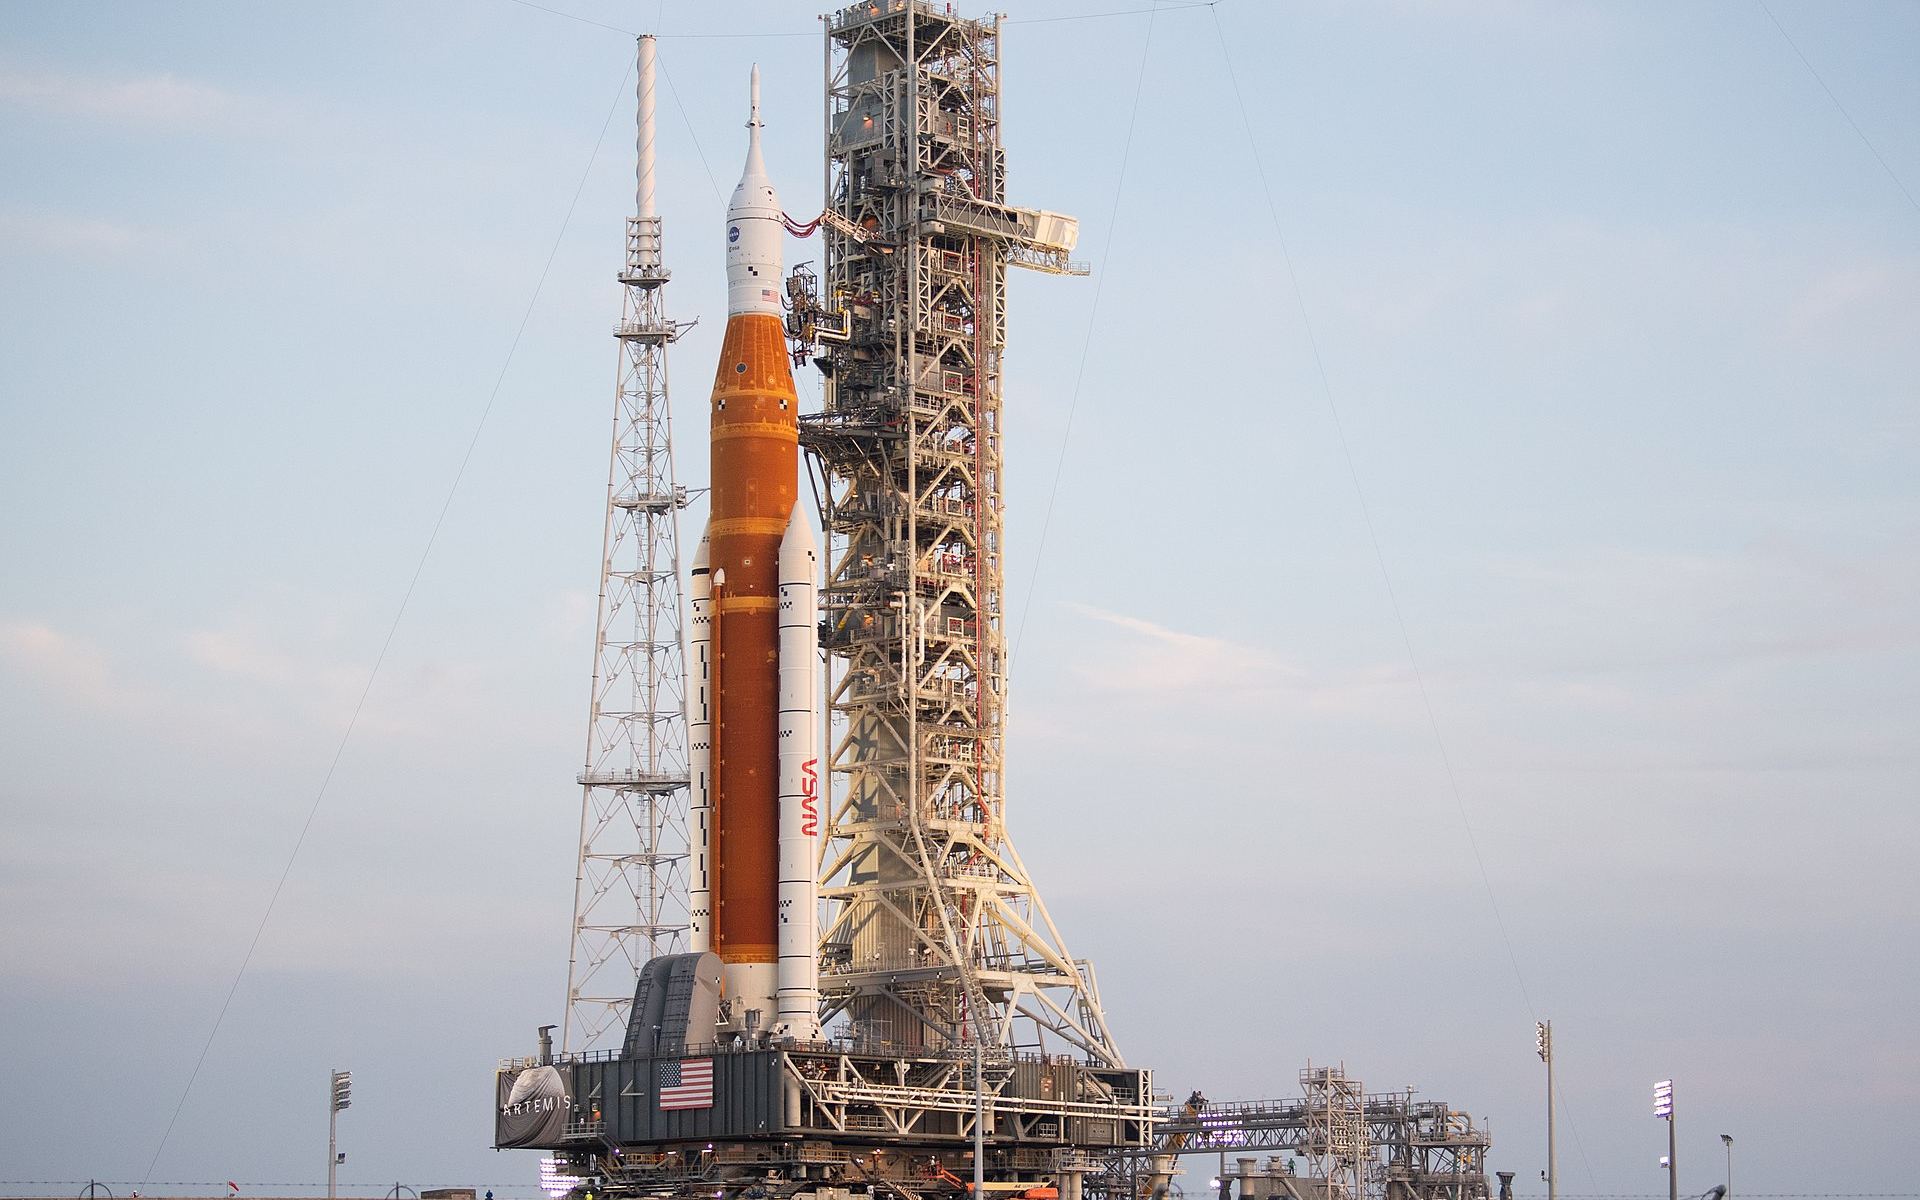
As a result of the latest weather predictions regarding Hurricane Ian, NASA managers met on the morning of September 26 and made the decision to roll Artemis 1 back into the Vehicle Assembly Building to protect the rocket from the impending storm, an operation which commenced at 11 pm EDT that evening.
Continue reading “As Hurricane Ian Bears Down on Florida, NASA Decides to Roll Artemis 1 Back to the Assembly Building”What Was the Carrington Event?
Isn’t modern society great? With all this technology surrounding us in all directions. It’s like a cocoon of sweet, fluffy silicon. There are chips in my fitness tracker, my bluetooth headset, mobile phone, car keys and that’s just on my body.
At all times in the Cain household, there dozens of internet devices connected to my wifi router. I’m not sure how we got to the point, but there’s one thing I know for sure, more is better. If I could use two smartphones at the same time, I totally would.
And I’m sure you agree, that without all this technology, life would be a pale shadow of its current glory. Without these devices, we’d have to actually interact with each other. Maybe enjoy the beauty of nature, or something boring like that.
It turns out, that terrible burning orb in the sky, the Sun, is fully willing and capable of bricking our precious technology. It’s done so in the past, and it’s likely to take a swipe at us in the future.
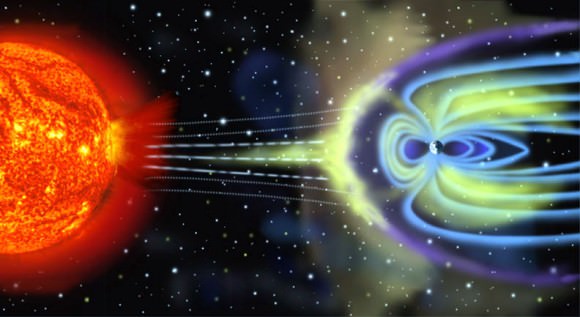
I’m talking about solar storms, of course, tremendous blasts of particles and radiation from the Sun which can interact with the Earth’s magnetosphere and overwhelm anything with a wire.
In fact, we got a sneak preview of this back in 1859, when a massive solar storm engulfed the Earth and ruined our old timey technology. It was known as the Carrington Event.
Follow your imagination back to Thursday, September 1st, 1859. This was squarely in the middle of the Victorian age.
And not the awesome, fictional Steampunk Victorian age where spectacled gentleman and ladies of adventure plied the skies in their steam-powered brass dirigibles.
No, it was the regular crappy Victorian age of cholera and child labor. Technology was making huge leaps and bounds, however, and the first telegraph lines and electrical grids were getting laid down.
Imagine a really primitive version of today’s electrical grid and internet.
On that fateful morning, the British astronomer Richard Carrington turned his solar telescope to the Sun, and was amazed at the huge sunspot complex staring back at him. So impressed that he drew this picture of it.
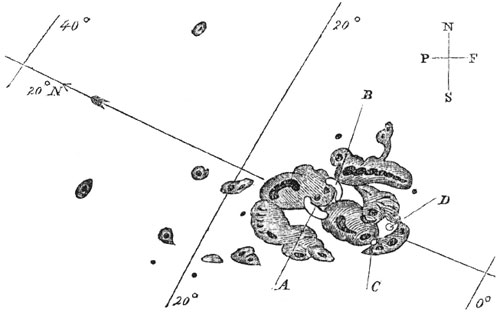
While he was observing the sunspot, Carrington noticed it flash brightly, right in his telescope, becoming a large kidney-shaped bright white flare.
Carrington realized he was seeing unprecedented activity on the surface of the Sun. Within a minute, the activity died down and faded away.
And then about 5 minutes later. Aurora activity erupted across the entire planet. We’re not talking about those rare Northern Lights enjoyed by the Alaskans, Canadians and Northern Europeans in the audience. We’re talking about everyone, everywhere on Earth. Even in the tropics.
In fact, the brilliant auroras were so bright you could read a book to them.
The beautiful night time auroras was just one effect from the monster solar flare. The other impact was that telegraph lines and electrical grids were overwhelmed by the electricity pushed through their wires. Operators got electrical shocks from their telegraph machines, and the telegraph paper lit on fire.
What happened? The most powerful solar flare ever observed is what happened.
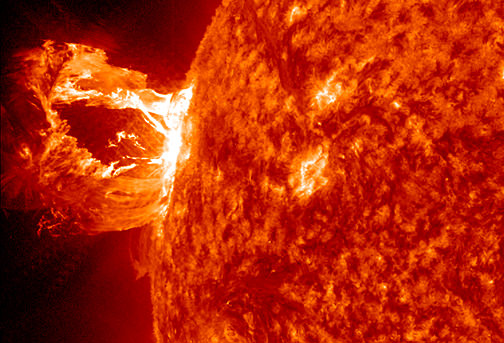
A solar flare occurs because the Sun’s magnetic field lines can get tangled up in the solar atmosphere. In a moment, the magnetic fields reorganize themselves, and a huge wave of particles and radiation is released.
Flares happen in three stages. First, you get the precursor stage, with a blast of soft X-ray radiation. This is followed by the impulsive stage, where protons and electrons are accelerated off the surface of the Sun. And finally, the decay stage, with another burp of X-rays as the flare dies down.
These stages can happen in just a few seconds or drag out over an hour.
Remember those particles hurled off into space? They take several hours or a few days to reach Earth and interact with our planet’s protective magnetosphere, and then we get to see beautiful auroras in the sky.
This geomagnetic storm causes the Earth’s magnetosphere to jiggle around, which drives charges through wires back and forth, burning out circuits, killing satellites, overloading electrical grids.
Back in 1859, this wasn’t a huge deal, when our quaint technology hadn’t progressed beyond the occasional telegraph tower.
Today, our entire civilization depends on wires. There are wires in the hundreds of satellites flying overhead that we depend on for communications and navigation. Our homes and businesses are connected by an enormous electrical grid. Airplanes, cars, smartphones, this camera I’m using.
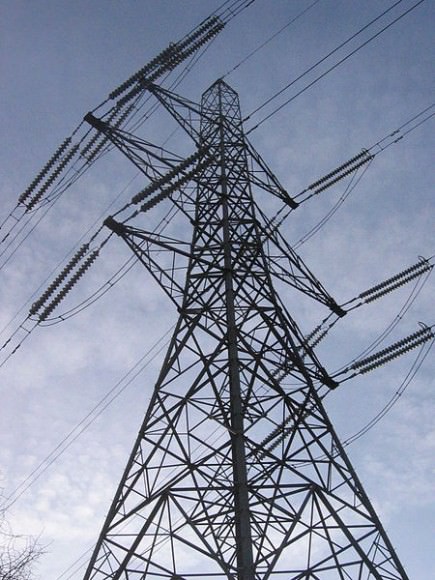
Everything is electronic, or controlled by electronics.
Think it can’t happen? We got a sneak preview back in March, 1989 when a much smaller geomagnetic storm crashed into the Earth. People as far south as Florida and Cuba could see auroras in the sky, while North America’s entire interconnected electrical grid groaned under the strain.
The Canadian province of Quebec’s electrical grid wasn’t able to handle the load and went entirely offline. For 12 hours, in the freezing Quebec winter, almost the entire province was without power. I’m telling you, that place gets cold, so this was really bad timing.
Satellites went offline, including NASA’s TDRS-1 communication satellite, which suffered 250 separate glitches during the storm.
And on July 23, 2012, a Carrington-class solar superstorm blasted off the Sun, and off into space. Fortunately, it missed the Earth, and we were spared the mayhem.
If a solar storm of that magnitude did strike the Earth, the cleanup might cost $2 trillion, according to a study by the National Academy of Sciences.
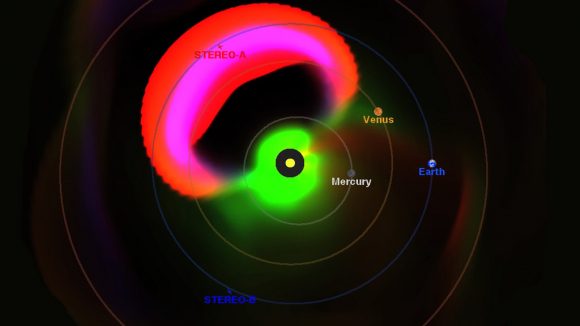
It’s been 160 years since the Carrington Event, and according to ice core samples, this was the most powerful solar flare over the last 500 years or so. Solar astronomers estimate solar storms like this happen twice a millennium, which means we’re not likely to experience another one in our lifetimes.
But if we do, it’ll cause worldwide destruction of technology and anyone reliant on it. You might want to have a contingency plan with some topic starters when you can’t access the internet for a few days. Locate nearby interesting nature spots to explore and enjoy while you wait for our technological civilization to be rebuilt.
Have you ever seen an aurora in your lifetime? Give me the details of your experience in the comments.
Juno Captures a Stunning Jovian ‘Pearl’
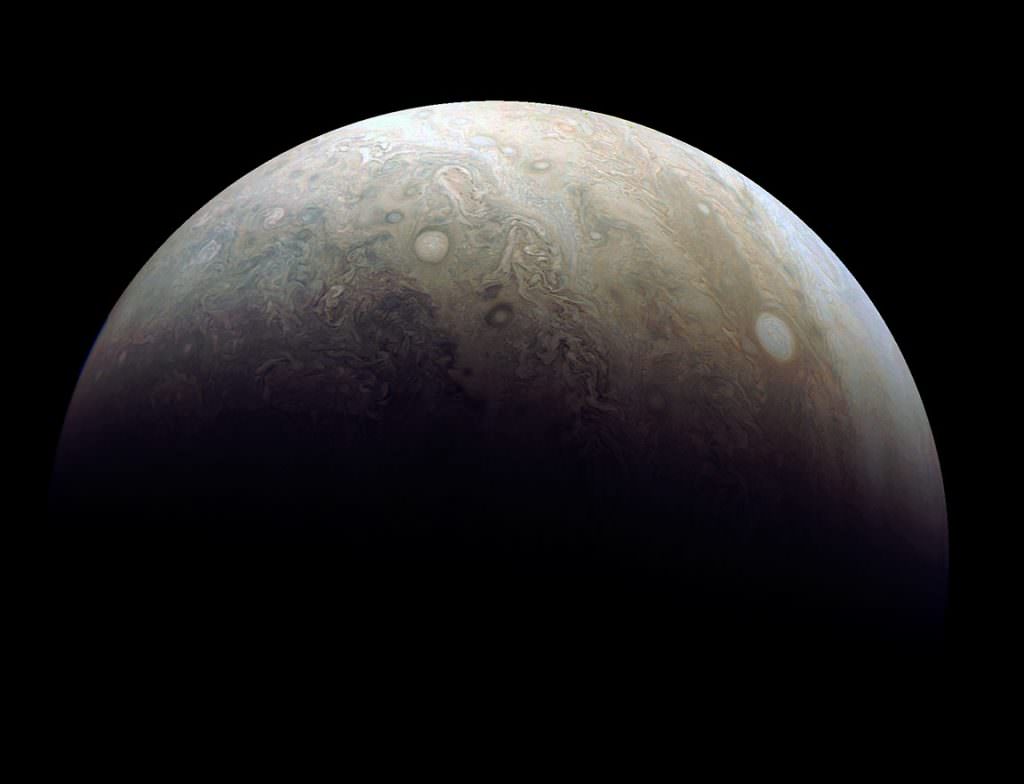
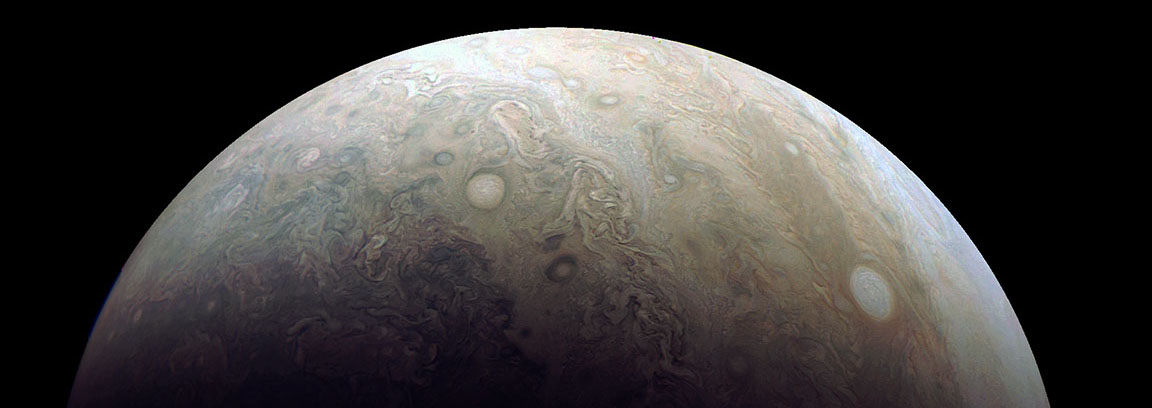
Jupiter looks beautiful in pearls! This image, taken by the JunoCam imager on NASA’s Juno spacecraft, highlights one of the eight massive storms that from a distance form a ‘string of pearls’ on Jupiter’s turbulent atmosphere. They’re counterclockwise rotating storms that appear as white ovals in the gas giant’s southern hemisphere. The larger pearl in the photo above is roughly half the size of Earth. Since 1986, these white ovals have varied in number from six to nine with eight currently visible.
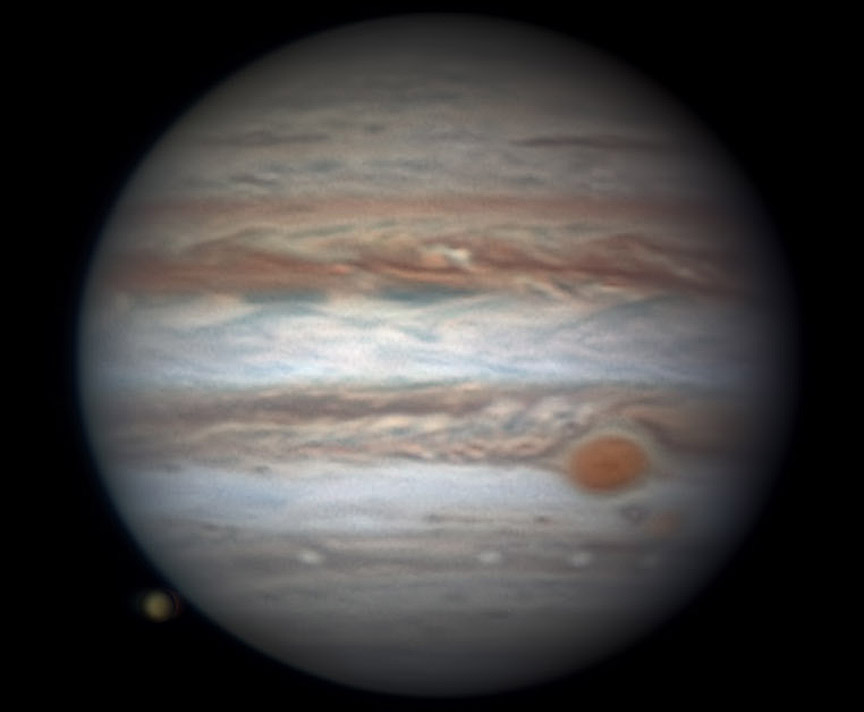
The photos were taken during Sunday’s close flyby. At the time of closest approach — called perijove — Juno streaked about 2,580 miles (4,150 km) above the gas giant’s roiling, psychedelic cloud tops traveling about 129,000 mph or nearly 60 km per second relative to the planet. Seven of Juno’s eight science instruments collected data during the flyby. At the time the photos were taken, the spacecraft was about 15,300 miles (24,600 km) from the planet.
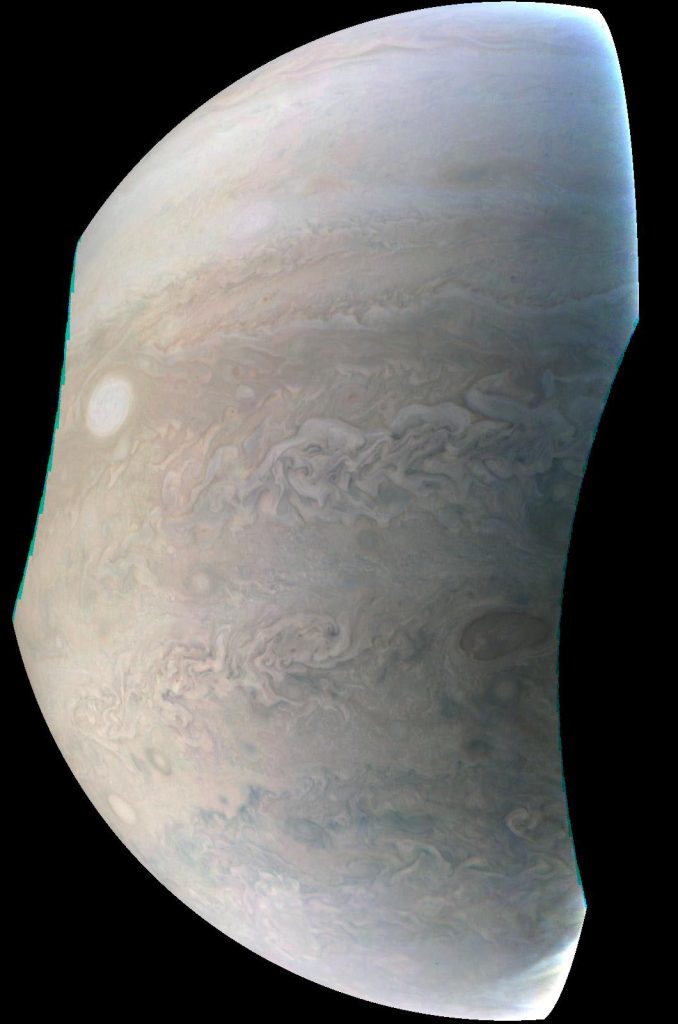
JunoCam is a color, visible-light camera designed to capture remarkable pictures of Jupiter’s poles and cloud tops. As Juno’s eyes, it will provide a wide view, helping to provide context for the spacecraft’s other instruments. JunoCam was included on the spacecraft specifically for purposes of public engagement; although its images will be helpful to the science team, it is not considered one of the mission’s science instruments.
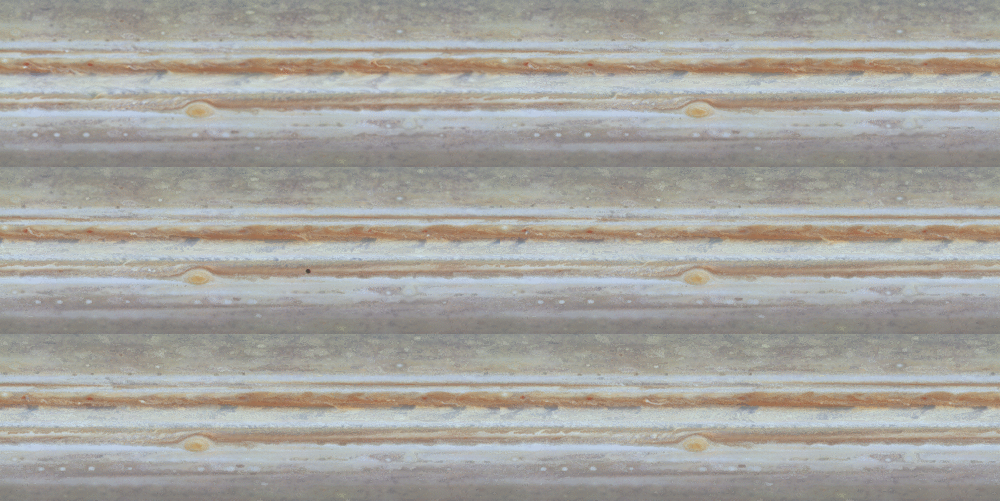
The crazy swirls of clouds we see in the photos are composed of ammonia ice crystals organized into a dozen or so bands parallel to the equator called belts (the darker ones) and zones. The border of each is bounded by a powerful wind flow called a jet, resembling Earth’s jet streams, which alternate direction from one band to the next.
Zones are colder and mark latitudes where material is upwelling from below. Ammonia ice is thought to give the zones their lighter color. Belts in contrast indicate sinking material; their color is a bit mysterious and may be due to the presence of hydrocarbons — molecules that are made from hydrogen, carbon, and oxygen as well as exotic sulfur and phosphorus compounds.
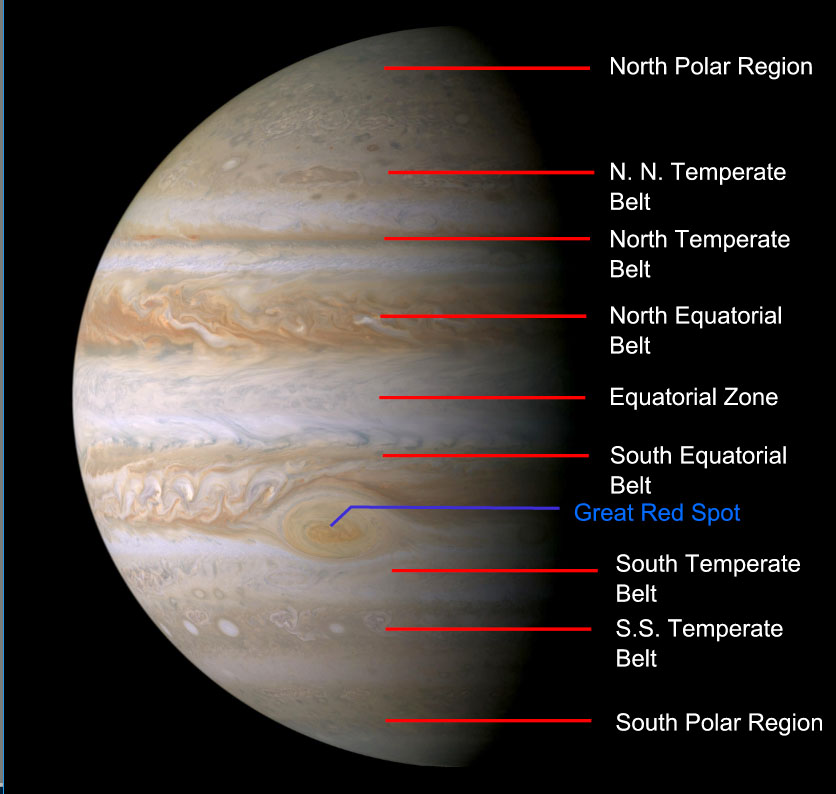
The pearls or storms form in windy Jovian atmosphere and can last many decades. Some eventually dissipate while others merge to form even larger storms. Unlike hurricanes, which fall apart when they blow inland from the ocean, there’s no “land” on Jupiter, so storms that get started there just keep on going. The biggest, the Great Red Spot, has been hanging around causing trouble and delight (for telescopic observers) for at least 350 years.
Juno’s next perijove pass will happen on Feb. 2, 2017.
What is Tornado Alley?
Tornadoes are a fascinating force of nature, as awe-inspiring as they are destructive. They form periodically due to the convergence of weather patterns, and often leave plenty of devastation in their wake. And for those who live in the active tornado regions of the world, they are an unfortunate fact of life.
Such is the nature of life for those who live in the infamous “Tornado Alley”, a region that extends from the southern US into parts of Canada. This area is so-named because of the frequency with which tornadoes take place. Compared to other active regions of the world, this area experiences the highest frequency of violent tornadoes.
Origin of the Name:
The term “Tornado Alley” was first used in 1952 as the title of a research project about severe weather in the US. This project was conducted by U.S. Air Force meteorologists Maj. Ernest J. Fawbush and Capt. Robert C. Miller, and covered a region extending from areas of Texas to locations throughout the mid-western US.
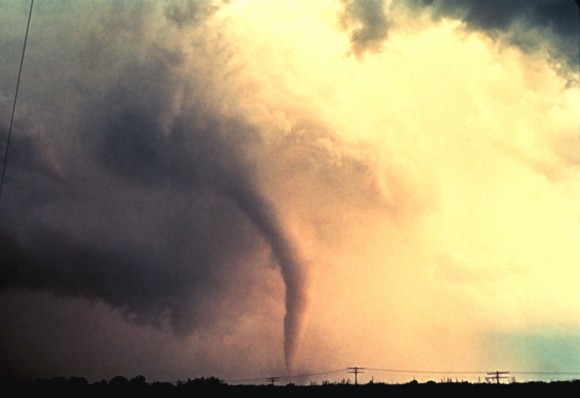
The term has since caught on thanks to media sources as well meteorologist and climatologists, though many use the term “Great Plains Tornado Belt” as well.
Geographical Area:
The geographical boundaries of “Tornado Alley” have never been very clearly defined and no official definition has been adopted by the National Weather Service (NWS). As a result, different definitions and boundaries have been adopted based on different sets of criteria. For instance, the National Severe Storms Laboratory (NSSL) states:
“‘Tornado Alley’ is just a nickname made up by the media for an area of relatively high tornado occurrence; it is not a clearly defined area. Is tornado alley the area with the most violent tornadoes, or is it the area with the most tornado-related deaths, or the highest frequency or tornadoes? It depends on what kind of information you want!”
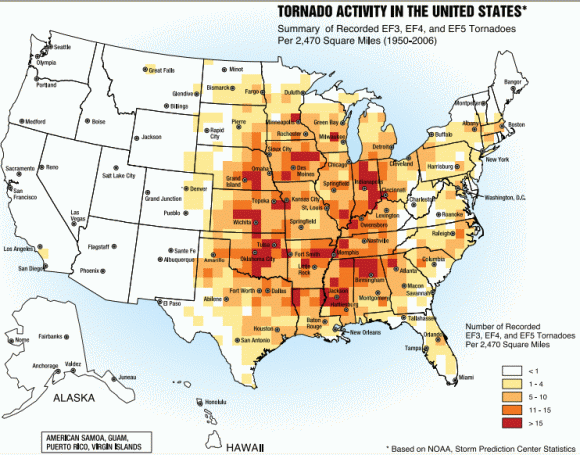
While no region of the US is entirely free of tornadoes, they occur more frequently in the mid-western US – spanning areas of Texas to parts of Oklahoma, Kansas, South Dakota, Iowa, Illinois, Missouri, New Mexico, Colorado, North Dakota, and Minnesota.
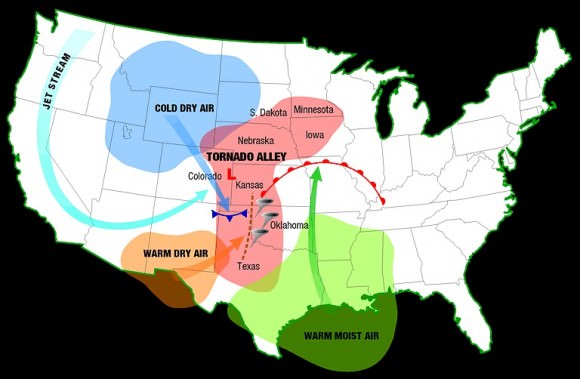
Texas reports the most tornadoes of any state, whereas Kansas and Oklahoma rank first and second respectively in the number of tornadoes per area. Florida also reports a high number and density of tornado occurrences, though tornadoes there rarely reach the strength of those that sometimes occur in the southern plains.
However, the Canadian prairies, eastern Colorado and western Pennsylvania are often included in the boundaries. And last, several smaller areas have been designated as being their own “Tornado Alley” – which include the Texas/Oklahoma/Kansas core, the Upper Midwest, the lower Ohio Valley, the Tennessee Valley and the lower Mississippi valley.
There is also the term “Dixie Alley”, a name coined by Allen Peasons, a former director of the National Severe Storms Forecasting Center (NSSFC), in 1971. This name refers to the lower Mississippi Valley and upper Tennessee Valley were tornadoes occur frequently.
Nevertheless, most definitions focus on the geographical region known as the Great Plains where no major mountain ranges are located. This is important because mountains act as breaks on weather systems, forcing them to dump the majority of their moisture before crossing over them (the reason why the southwestern US has a more arid climate).
In the case of the Great Plains, the region’s lack of these natural barriers leaves it open to cold fronts from Canada and warm fronts from Mexico and the Gulf Coast. When cold and warm front collide, they create supercells and thunderstorm systems that lead to tornadoes.
Impact:
Due to the frequency of tornadoes in certain areas of the United States, building codes and warning systems have been implemented. These include the institution of special building codes, construction of storm cellars, sirens, preparedness drills, education programs, and regular weather coverage by local media outlets.
According to the National Climatic Data Center, during the period of 1991 to 2010, those states that have the most experienced an average of 5.7 (Minnesota) to 12.2 (Florida) tornadoes. Using a long-term average (based on data collected between 1950 and 2012), the entire “Alley” experiences about 268 tornadoes per year.
In the southeastern United States, where housing is less robust and many people live in mobile homes, causalities are particularly high. According to the NOAA, almost 3600 tornadoes have occurred in the United States, which resulted in more than 20,000 deaths, between 1680 and 2000.
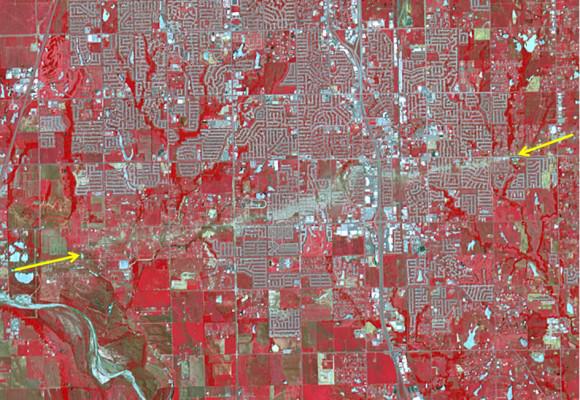
Meanwhile, data from the Tornado History Project shows there were 5,587 confirmed fatalities blamed on tornadoes across the United States between 1950 and 2012. Of those, 1,110 occurred in Tornado Alley. The injuries caused by tornadoes are much higher, with a reported 64,054 injuries being attributed to tornadoes during the same period – over 15,000 of which occurred in Tornado Alley.
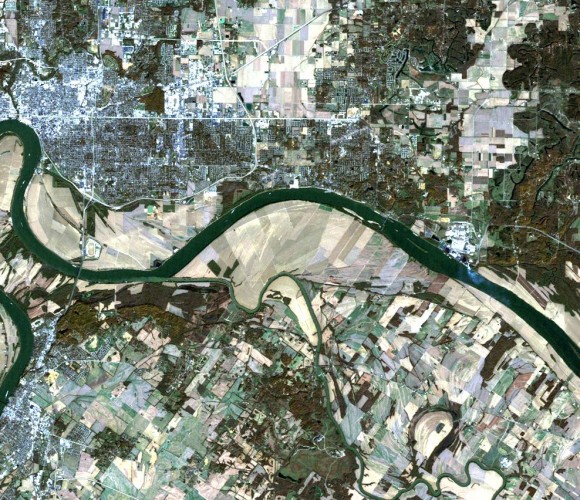
The worst year on record was 2011, when tornado activity spiked leading to 1,704 confirmed tornadoes and 553 confirmed deaths. This includes the 158 deaths that resulted from the tornado that struck Joplin, Missouri, on May 22nd, which was also the deadliest since modern record-keeping began in 1950.
In financial terms, the cost of tornadoes is also quite high. In fact, the Insurance Information Institute reports that between 1993 and 2012, the average insured loss per year was $7.78 billion for severe thunderstorm events, including tornadoes. In 2011, during the spike in storms, an estimated $27 billion was filed for in insurance claims.
No matter how you slice it, living in regions where tornadoes are known to frequent is both a dangerous and expensive prospect. As our understanding of tornadoes grows, we are able to predict where they will form and what paths they will take with greater accuracy. As such, we can reduce the cost in human and monetary terms over time.
But in the long run, the greatest safeguards against injuries and death are public awareness and education. Tornadoes are also an important aspect of Climate Change, since changes in our environment are likely to effect and exacerbate extreme weather patterns.
We have written many articles about tornadoes for Universe Today. Here’s How Do Tornadoes Form?, What was the Largest Tornado Ever Recorded?, New Gigantic Tornado Spotted on Mars, and Huge “Tornado” on the Sun.
If you’d like more info on tornado, check out the National Oceanic and Atmospheric Administration Homepage. And here’s a link to NASA’s Earth Observatory.
We’ve also recorded an episode of Astronomy Cast all about planet Earth. Listen here, Episode 51: Earth.
Sources:
May Meteor Storm Alert: All Eyes on the Sky!
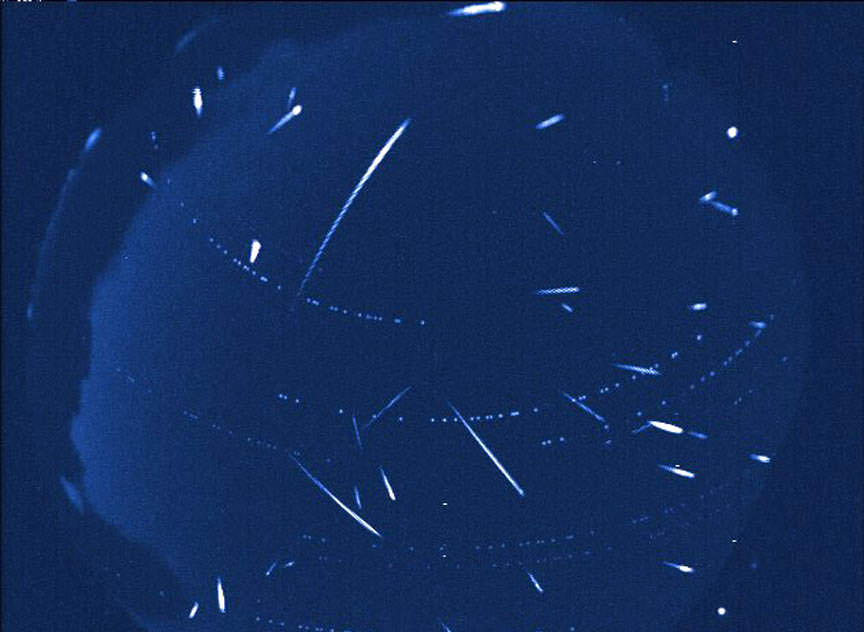
On Friday night/early Saturday May 23-24 skywatchers across the U.S. and southern Canada may witness the birth of a brand new meteor shower. If predictions hold true, Earth will pass through multiple tendrils of dust and pebbly bits left behind by comet 209P/LINEAR, firing up a celestial display on par with the strongest showers of the year. Or better.

Earlier predictions called for a zenithal hourly rate or ZHR of 1,000 per hour, pushing this shower into the ‘storm’ category. ZHR is an idealized number based on the shower radiant located at the zenith under ideal skies. The actual number is lower depending on how far the radiant is removed from the zenith and how much light pollution or moonlight is present. Meteor expert Peter Jenniskens of the SETI Institute and Finland’s Esko Lyytinen first saw the possibility of a comet-spawned meteor storm and presented their results in Jenniskens’ 2006 book Meteor Showers and Their Parent Comets.
Quanzhi Ye and Paul Wiegert (University of Western Ontario) predict a weaker shower because of a decline in the comet’s dust production rate based on observations made during its last return in 2009. They estimate a rate of ~200 per hour.
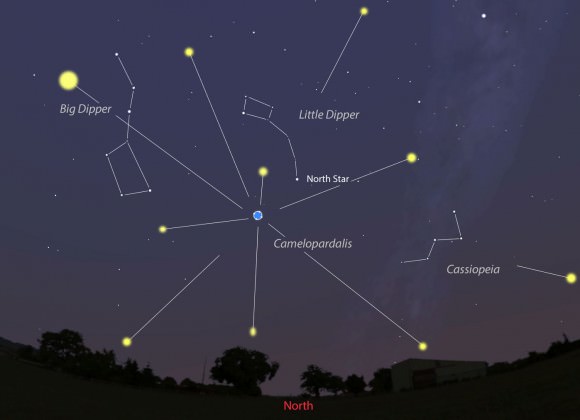
On the bright side, their simulations show that the comet sheds larger particles than usual, which could mean a shower rich in fireballs. Other researchers predict rates between 200 and 40o per hour. At the very least, the Camelopardalids – the constellation from which the meteors will appear to originate – promise to rival the Perseids and Geminids, the year’s richest showers. Motivation for setting the alarm clock if there ever was.
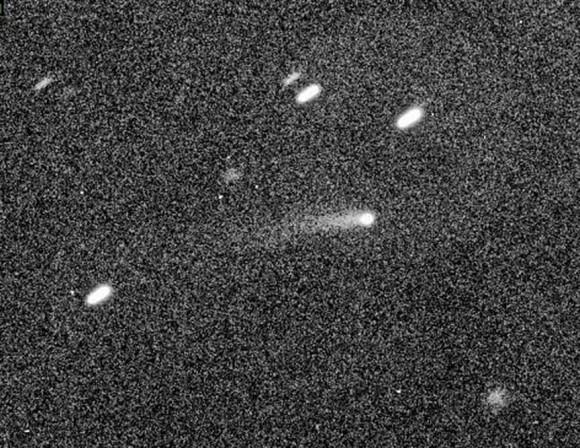
Comet 209P/LINEAR, discovered in Feb. 2004 by the automated Lincoln Laboratory Near-Earth Asteroid Research (LINEAR) sky survey, orbits the sun every 5.04 years with an aphelion (most distant point from the sun) near Jupiter. In 2012, during a relatively close pass of that planet, Jupiter perturbed its orbit, bringing it to within 280,000 miles (450,000 km) of Earth’s orbit.
That set up a remarkably close encounter with our planet on May 29 when 209P will cruise just 5 million miles (8 million km) from Earth to become the 9th closest comet ever observed. Multiple debris trails shed by the comet as long ago as the 18th century will intersect our planet’s path 5 days earlier, providing the material for the upcoming meteor shower/storm.
Shining meekly around magnitude +17 at the moment, 209P/LINEAR could brighten to magnitude +11 as it speeds from the Big Dipper south to Hydra during the latter half of May. Closer to the BIG night, we’ll provide helpful maps for you to track it down in your telescope. Cool to think that both the shower and its parent comet will be on display at the same time.
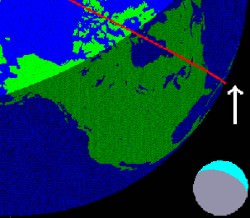
The shower’s expected to last only a few hours from about 12:40-3:50 a.m. CDT with the best viewing locations in the U.S. and southern half of Canada. This is where the radiant will be up in a dark sky at peak activity. A thick crescent moon rises around 3-3:30 a.m. but shouldn’t pose a glare problem.
Meteors from 209P/LINEAR are expected to be bright and slow with speeds around 40,000 mph compared to an average of 130,000 mph for the Perseids. Most shower meteoroids are minute specks of rock, but the Camelopardalids contain a significant number of particles larger than 1mm – big enough to spark fireballs.
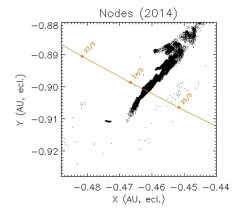
The farther north you live in the shaded area on the map, the higher the radiant stands in the northern sky and the more meteors you’re likely to see. Skywatchers living in the Deep South will see fewer shooting stars, but a greater proportion will be earthgrazers, those special meteors that skim the upper atmosphere and flare for an unusually long time before fading out.
To see the shower at its best, find a dark place with an open view to the north. Plan your viewing between 12:30 and 4 a.m. CDT (May 24), keeping the 2 a.m. forecast peak in mind. Maximum activity occurs around 3 a.m. Eastern, 1 a.m. Mountain and midnight Pacific time.
No one’s really certain how many meteors will show, but I encourage you to make the effort to see what could be a spectacular show.
Weird Gravity Waves Pulse From a Tropical Cyclone
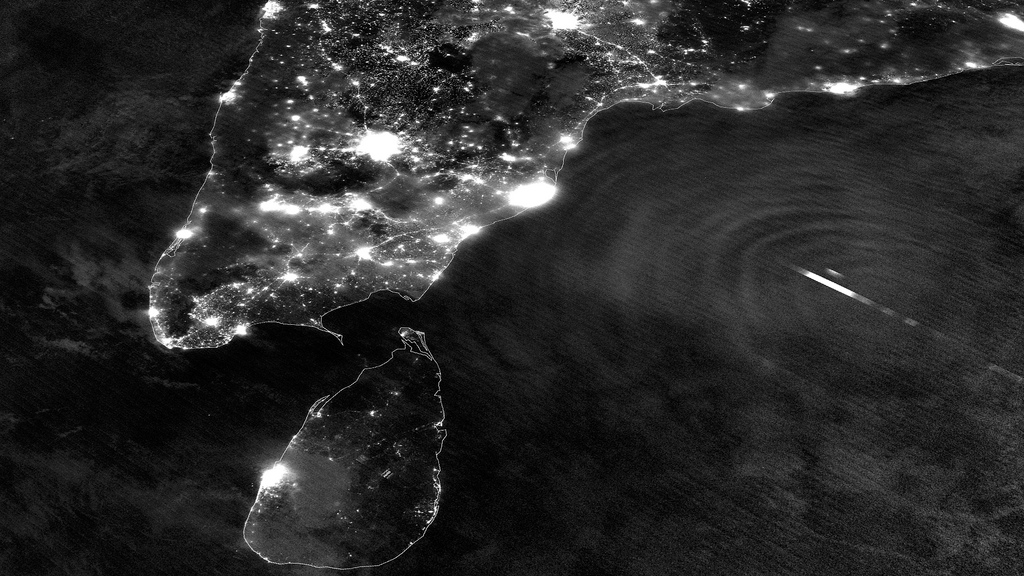
Last Monday, May 13, the Suomi NPP satellite captured a fascinating image of Tropical Cyclone Mahasen as it moved northeast over the Bay of Bengal. The clouds of the storm itself weren’t optically visible in the darkness of a nearly new Moon, but lightning flashes within it were… as well as the eerie ripples of atmospheric gravity waves spreading outwards from its center.
According to the Space Physics Research Group at the University of California, Berkeley:
Gravity waves are the oscillations of air parcels by the lifting force of bouyancy and the restoring force of gravity. These waves propagate vertically as well as horizontally, and actively transport energy and momentum from the troposphere to the middle and upper atmosphere. Gravity waves are caused by a variety of sources, including the passage of wind across terrestrial landforms, interaction at the velocity shear of the polar jet stream and radiation incident from space. They are found to affect atmospheric tides in the middle atmosphere and terrestrial weather in the lower atmosphere. (Source)
Atmospheric gravity waves aren’t to be confused with gravitational waves in space, which are created by very dense, massive objects (like white dwarf stars or black holes) orbiting each other closely.
When the image was captured, Tropical Cyclone Mahasen was moving north through the Indian Ocean along a track that placed landfall along the Bangladesh coast. As it moved off the coast of India Suomi’s VIIRS Day-Night Band was able to resolve lightning flashes towards the center of the storm, along with mesopheric gravity waves emanating outwards like ripples in a pond.
Such gravity waves are of particular interest to air traffic controllers so assist in identifying areas of turbulence.
Since the moon was in a new phase, the lights and other surface features of India and Sri Lanka are clearly visible although the clouds of Mahasen are not — a tradeoff that occurs as the amount of moonlight cycles throughout the month.
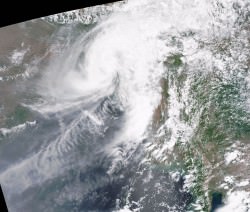
Over the course of the next few days Mahasen weakened into a deep depression, making landfall as a tropical storm on Bangladesh on May 16. In preparation for the storm large-scale evacuations were recommended for parts of Myanmar; however, this resulted in the overcrowding of boats and several vessels capsized. (Source: eosnap.com)
NASA launched the National Polar-orbiting Operational Environmental Satellite System Preparatory Project (or NPP) on October 28, 2011 from Vandenberg Air Force Base. On Jan. 24, NPP was renamed Suomi National Polar-orbiting Partnership, or Suomi NPP, in honor of the late Verner E. Suomi. It’s the first satellite specifically designed to collect data to improve short-term weather forecasts and increase understanding of long-term climate change.
Suomi NPP orbits Earth about 14 times a day, observing nearly the entire surface of the planet.
Main image source: NASA Goddard Space Flight Center
NASA Satellite Snaps Winter Storm “Nemo”
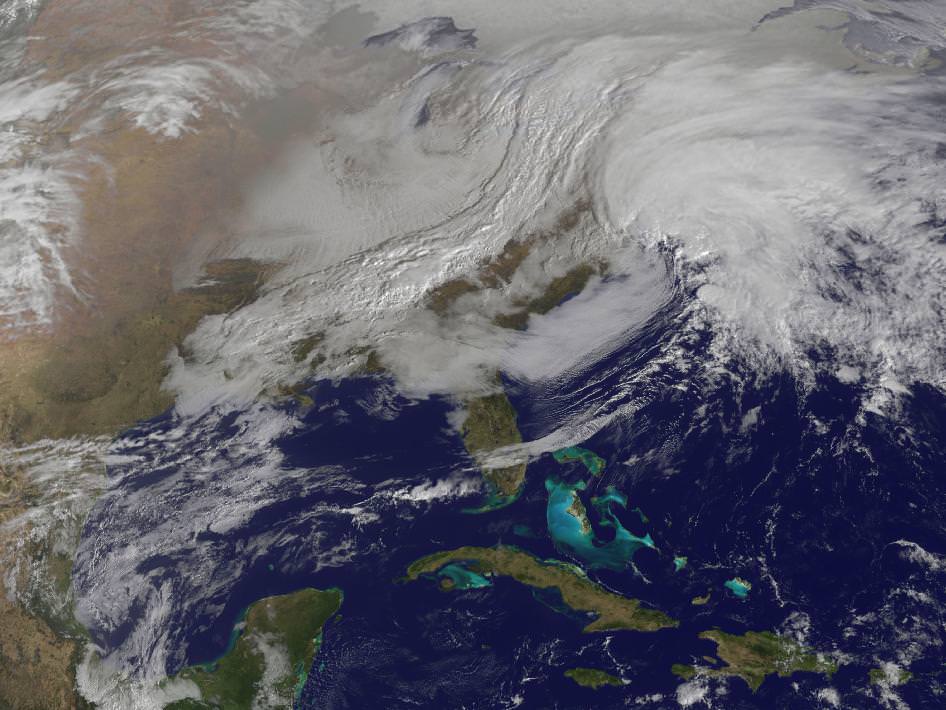
Captured by NASA’s GOES-13 weather satellite on Friday, Feb. 8, this image shows the convergence of two massive low-pressure systems that are expected to bring high winds and up to 2–3 feet of snowfall across much of New England over the next 24 hours. This is the second and most powerful “nor’easter” of the season, and states in the region are preparing for the worst.
Acquired at 9:01 a.m. EST, the GOES image shows clouds associated with the western frontal system stretching from Canada through the Ohio and Tennessee valleys and down into the Gulf of Mexico. The comma-shaped low pressure system located over the Atlantic, east of Virginia, is forecast to merge with the front and create a powerful nor’easter, which The Weather Channel (in a recent move to name winter storms) has dubbed “Nemo.”
Watch a video of this process in action below.
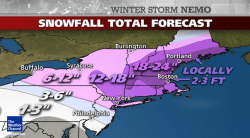
At the time of this writing, the snow has begun to fall outside this writer’s house. Accumulations are less than an inch — but that’s soon to change! Many cancellations and closings have already been announced across the region, with people making apprehensive associations with the infamous Blizzard of ’78. It’s unlikely that as many people will be caught unprepared, though, especially since modern forecasting methods have dramatically improved over the past 35 years — due in no small part to space technology like NASA’s GOES (Geostationary Operational Environment Program) satellites.
Orbiting Earth at an altitude of 35,790 km (22,240 miles) the 4 operational GOES satellites keep a constant eye on the globe, providing the NOAA with accurate, real-time measurements of water vapor and land and sea temperature variations. See more GOES image data here.
In the path of Nemo? Here’s some tips on how to be prepared.
Incredible Video of Sandy’s Swirling Progression
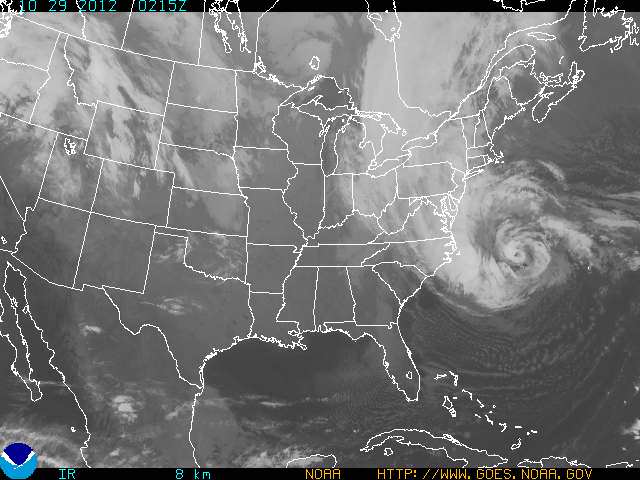
Just released, this mesmerizing animation was created by Kevin Ward from images acquired by NOAA’s GOES-O/14 satellite. It shows the progression of Hurricane Sandy, currently a Category 1 hurricane off the coast of the eastern U.S. that’s poised to make a devastating impact when its heavy rains, winds and storm surges strike the shores of many major metropolitan coastal areas — including New York City and Washington, D.C.
Nearly 12 hours of time are compressed into 30 seconds, revealing the evolution of Sandy as it churned over the Atlantic on Sunday, October 28.
From NASA’s Earth Observatory’s YouTube page:
This time-lapse animation shows Hurricane Sandy from the vantage point of geostationary orbit—35,800 km (22,300 miles) above the Earth. The animation shows Sandy on October 28, 2012, from 7:15 to 6:26 EDT. Light from the changing angles of the sun highlight the structure of the clouds. The images were collected by NOAA’s GOES-14 satellite. The “super rapid scan” images — one every minute from 7:15 a.m. until 6:30 p.m. EDT — reveal details of the storm’s motion.
Launched by NASA as GOES-O on June 27, 2009, GOES-14 is now under control by the NOAA, keeping an eye on the mid-Atlantic region from a geostationary position approximately 22,300 miles (35,800 km) above the Earth.
Sandy is expected to bring up to 10 inches of rain into New York, with a surge possible over 6 feet above high tide and wind gusts in excess of 75 mph. Once the hurricane moves inland there could be millions left without electricity. States of emergency have already been declared in many areas within Sandy’s projected path.
Read: Hurricane Sandy Barreling to Eastern Seaboard, Menacing Millions
Currently Sandy is off the coast of North Carolina (at the time of this writing, 34.5 N / 70.5 W) moving northeast at 14 mph (22 km/h) with a low pressure of 950 mb… that’s as low or lower than some of the most powerful storms to hit the eastern U.S. over the past century, including the “perfect storm” of 1991 (a low system which also struck at Halloween) and the deadly 1938 “Great Hurricane”, which devastated coastal regions all across southern New England.
Stay up to date on Hurricane Sandy’s progress on the NOAA page here, with the latest public advisories being posted here.
NASA animation by Kevin Ward, using images from NOAA and the University of Wisconsin-Madison Cooperative Institute for Meteorological Satellite Studies.
Bolt from the Blue: Giant Flash of Lightning Seen in Saturn’s Storm
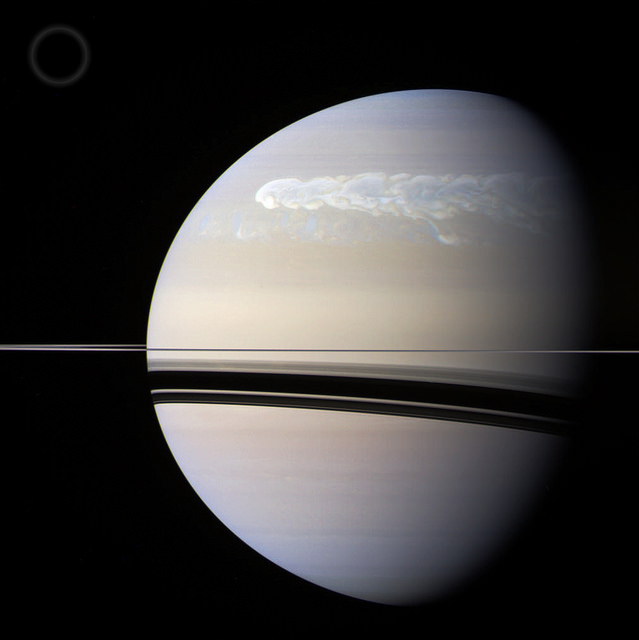
An enormous storm that wrapped its way around Saturn’s northern hemisphere during the first half of 2011 wasn’t just a churning belt of high-speed winds; it also generated some monster flashes of lightning as well — one of which was captured on camera by the Cassini spacecraft!
Check it out…
The image above was created from Cassini raw images acquired in red, green, and blue color channels and assembled to create a somewhat “true-color” image of Saturn. The image shows the storm as it looked on February 25, 2011, a couple of months after it was first noticed by amateur astronomers on the ground. (The circle at upper left illustrates the comparative size of Earth.)
Read: Studying Saturn’s Super Storm
These images were acquired by Cassini almost two weeks later, on March 6, the first showing a bright blue flash of lightning within the storm, along the eastern edge of a large eddy. The second image, taken 30 minutes later, does not have any visible flash.
Because the flash was only visible in blue light (and there was no red channel data) the images are false color. Near-infrared replaced the visible red channel.
Based on the image resolution (12 miles/20 km per pixel) the size of the lightning flash is estimated to be about 120 miles (200 km) wide — as large as the strongest lightning seen on Earth. And like on Earth, Saturn’s lightning is thought to originate deeper in the atmosphere, at the level where water droplets freeze.
Although the 2011 northern storm was a great feature to observe, this wasn’t the first time lightning had been spotted on Saturn. Cassini had observed flashes on the ringed planet in August of 2009 as well, allowing scientists to create the first movie of lightning flashing on another planet.
Since its arrival at Saturn in 2004, Cassini has detected 10 lightning storms on Saturn — although with up to 10 flashes per second and eventually covering an area of 2 billion square miles (4 billion sq. km) the 2011 storm was by far the largest ever seen.
Image credits: NASA / JPL-Caltech / Space Science Institute. Top composite by J. Major. Video: JPL
Tropical Storm Debby Douses the Gulf
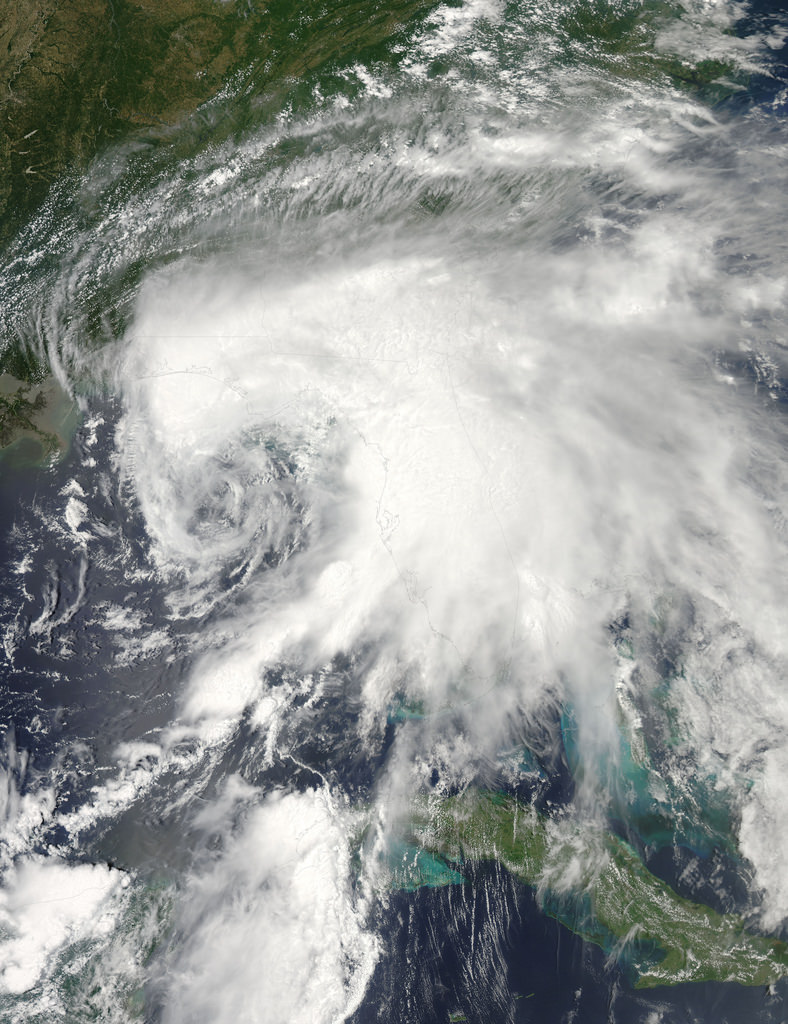
The eastern Gulf of Mexico is getting lashed by tropical storm Debby, which whipped up tornado-spawning winds and dumped inches of rain across much of Florida, Mississippi, Alabama and southern Georgia over the weekend. NASA’s Aqua satellite acquired this image on June 23, just after the depression strengthened to full tropical storm status.
Born over the warm, moist air of the Gulf off the coast of Mississippi on Saturday afternoon, Debby quickly strengthened to storm status with sustained winds currently reported at over 60 mph. Slow-moving at a 6 mph crawl to the northeast, Debby continues to drench the Gulf state coasts with inches of rain — up to 10 to 20 inches projected for some areas. Major flooding has already become a problem and reports of tornadoes have been coming in since Sunday afternoon.
Debby will likely become a hurricane at some point, although her future path is still not entirely known.
Launched on May 4, 2002, NASA’s Aqua satellite specializes in keeping track of the movement of water around the planet in all its various forms. Find out more about the Aqua mission here.
Image: NASA/GSFC/Jeff Schmaltz/MODIS Land Rapid Response Team

