The White House Releases a Report on Space Weather

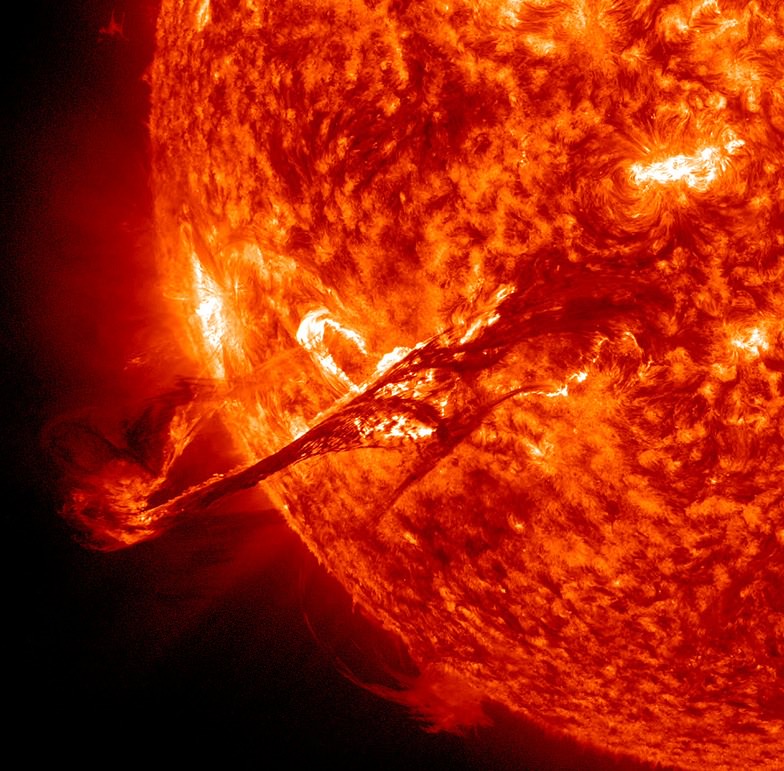
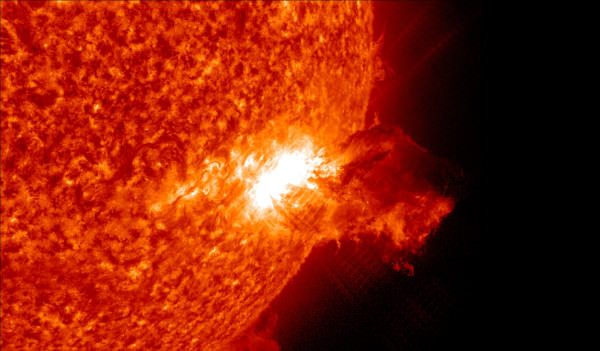
A long, magnetic filament burst out from the Sun after a C-cladd flare on(Aug. 31, 2012 (NASA/SDO/AIA)

We live on a planet dominated by weather. But not just the kind that comes in the form of wind, rain, and snow — we are also under the influence of space weather, generated by the incredible power of our home star a “mere” 93 million miles away. As we orbit the Sun our planet is, in effect, inside its outer atmosphere, and as such is subject to the constantly-flowing wind of charged particles and occasional outbursts of radiation and material that it releases. Although it may sound like something from science fiction, space weather is very real… and the more we rely on sensitive electronics and satellites in orbit, the more we’ll need to have accurate weather reports.

Fortunately, the reality of space weather has not gone unnoticed by the U.S. Federal Government.
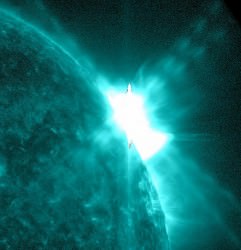
An X1.6 flare eruption on Jan. 27, 2012 (NASA/SDO/AIA)

Today the White House Office of Science and Technology Policy released a new report, Space Weather Observing Systems: Current Capabilities and Requirements for the Next Decade, which is an assessment of the United States government’s capacity to monitor and forecast potentially harmful space weather and how to possibly mitigate the damage from any exceptionally powerful solar storms in the future.

The report was made by a Joint Action Group (JAG) formed by the National Space Weather Program Council (NSWPC).

The impacts of space weather can have serious economic consequences. For example, geomagnetic storms during the 1990’s knocked out several telecommunications satellites, which had to be replaced at a cost of about $200 million each. If another “once in a century” severe geomagnetic storm occurs (such as the 1859 “super storm”), the cost on the satellite industry alone could be approximately $50 – $100 billion. The potential consequences on the Nation’s power grid are even higher, with potential costs of $1 – 2 trillion that could take up to a decade to completely repair.

– Report on Space Weather Observing Systems: Current Capabilities and Requirements for the Next Decade (April 2013)

“In other words,” according to the report, “the Nation is at risk of losing critical capabilities that have significant economic and security impacts should these key space weather observing systems fail to be maintained and replaced.”

Obviously, not good.

Read the full report here, and follow current and ongoing space weather events on the NOAA’s Space Weather Prediction Center website.

Source: White House Office of Science and Technology Policy

The National Space Weather Program is a Federal interagency initiative with the mission of advancing the improvement of space weather services and supporting research in order to prepare the country for the technological, economic, security, and health impacts that may arise from extreme space weather events. 

The Sun Blasts Out Two CME’s Towards Mercury

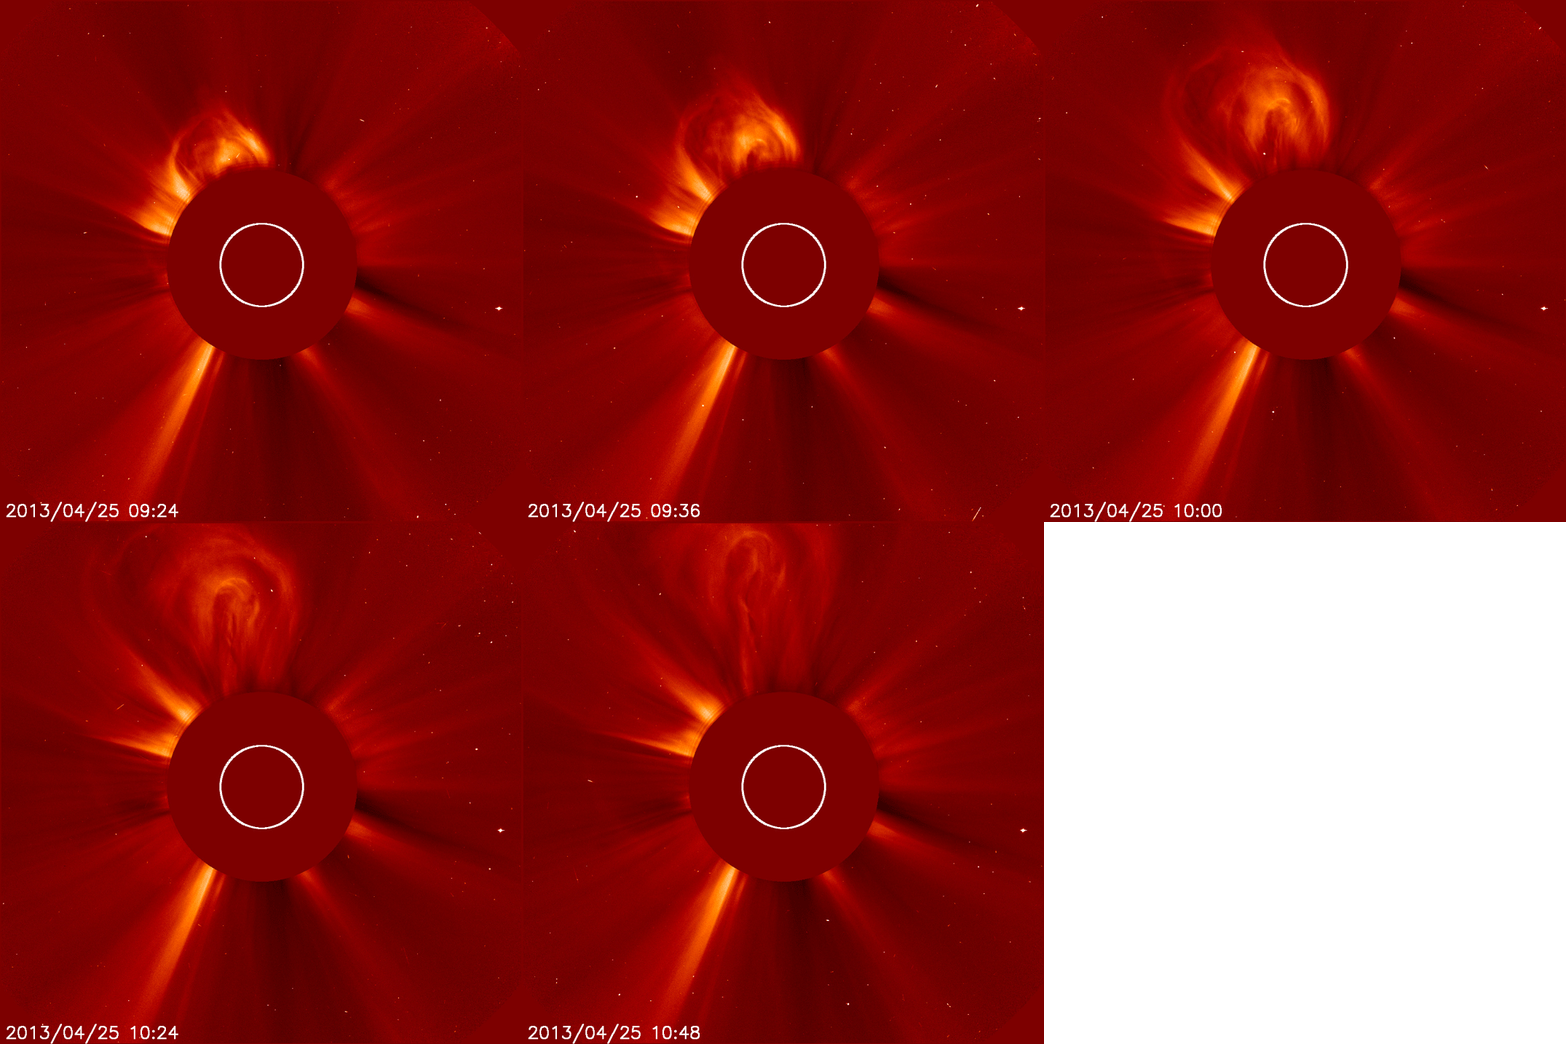
the Solar Heliospheric Observatory (SOHO) captured this series of four images of a coronal mass ejection (CME) escaping the sun on the morning of April 25, 2013. The images show the CME from 5:24 a.m. to 6:48 a.m. EDT. This was the second of two CMEs in the space of 12 hours. Both are headed away from Earth toward Mercury. Credit: ESA&NASA/SOHO.

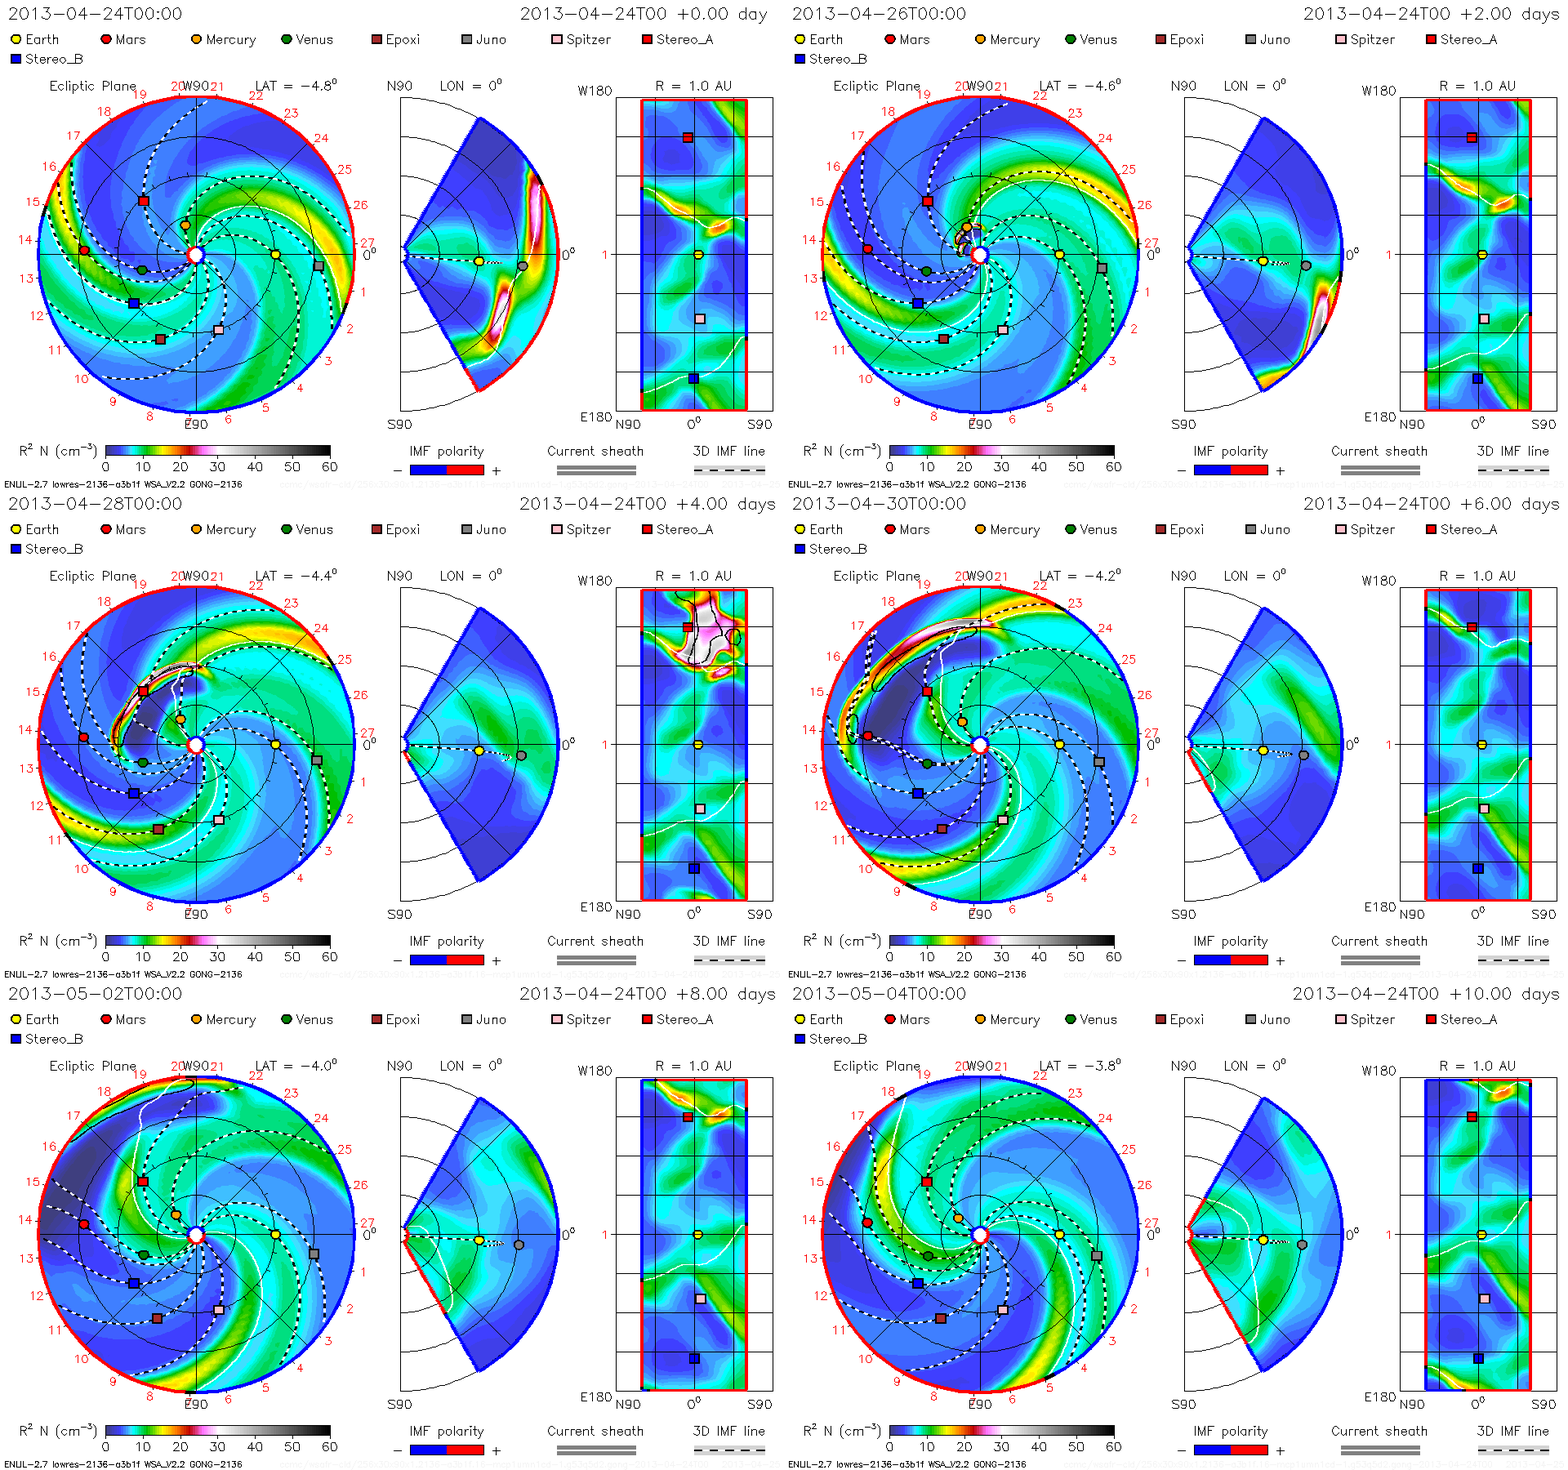
Over the past 24 hours, the Sun has erupted with two coronal mass ejections (CMEs), sending billions of tons of solar particles into space. While these CMEs are not directed at Earth, they are heading towards Mercury and may affect the Messenger spacecraft, as well as the Sun-watching STEREO-A satellites. One CME may send a glancing blow of particles to Mars, possibly affecting spacecraft at the Red Planet.

This solar radiation can affect electronic systems on spacecraft, and the various missions have been put on alert. When warranted, NASA operators can put spacecraft into safe mode to protect the instruments from the solar material.

The first CME began at 01:30 UTC on April 25 (9:30 p.m. EDT on April 24), and the second erupted at 09:24 UTC (5:24 a.m. EDT) on April 25. Both left the sun traveling at about 800 kilometers (500 miles per second).

See this animation from the STEREO-B spacecraft:

Animations of CMEs on April 25, 2013 from the STEREO-B spacecraft. Credit: NASA/Goddard Space Flight Center.

Source: NASA

3 Years of the Sun in 3 Minutes

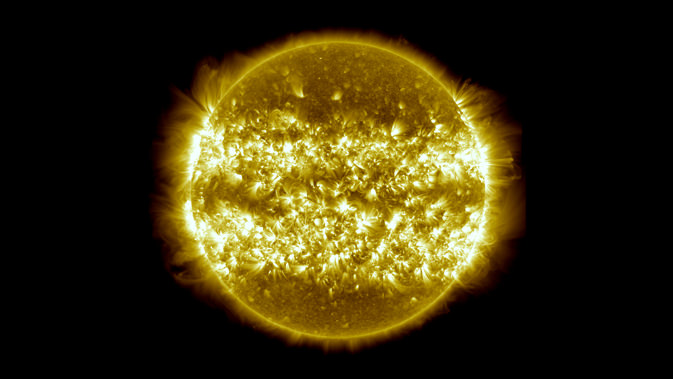
This image is a composite of 25 separate images spanning the period of April 16, 2012, to April 15, 2013. It uses the SDO AIA wavelength of 171 angstroms and reveals the zones on the sun where active regions are most common during this part of the solar cycle. Credit: NASA/SDO/AIA/S. Wiessinger

Since the Solar Dynamics Observatory opened its multi-spectral eyes in space about three years ago, we’ve posted numerous videos and images from the mission, showing incredible views of our dynamic Sun. Scott Wiessinger from Goddard Space Flight Center’s Space Visualization Studio has put together great timelapse compilation of images from the past three years, as well as a one composite still image to “try to encapsulate a timelapse into one static graphic,” he told us via email. “I blended 25 stills from over the last year, and it’s interesting to see the bright bands of active regions.” Scott said he was fascinated by seeing the views of the Sun over a long range of time.

Within the video, (below) there are some great Easter egg hunts – things to see like partial eclipses, flares, comet Lovejoy, and the transit of Venus.

How many can you find?

SDO’s Atmospheric Imaging Assembly (AIA) captures a shot of the sun every 12 seconds in 10 different wavelengths, but the images shown here are based on a wavelength of 171 Angstroms, which is in the extreme ultraviolet range. It shows solar material at around 600,000 Kelvin. In this wavelength it is easy to see the Sun’s 25-day rotation as well as how solar activity has increased over three years as the Sun’s solar cycle has ramped up towards the peak of activity in its 11-year cycle.

You’ll also notice that during the course of the video, the Sun subtly increases and decreases in apparent size. This is because the distance between the SDO spacecraft and the Sun varies over time. The image is, however, remarkably consistent and stable despite the fact that SDO orbits the Earth at 6,876 miles per hour and the Earth orbits the sun at 67,062 miles per hour.

See more views, wavelengths and information at this page at the Space Visualization Studio website.

How Long Does it Take Sunlight to Reach the Earth?

How Long Does it Take Sunlight to Reach Earth?

Here’s a question… how long does it take sunlight to reach Earth? This sounds like a strange question, but think about it. Sunlight travels at the speed of light. Photons emitted from the surface of the Sun need to travel across the vacuum of space to reach our eyes.

The short answer is that it takes sunlight an average of 8 minutes and 20 seconds to travel from the Sun to the Earth.

If the Sun suddenly disappeared from the Universe (not that this could actually happen, don’t panic), it would take a little more than 8 minutes before you realized it was time to put on a sweater.

Here’s the math. We orbit the Sun at a distance of about 150 million km. Light moves at 300,000 kilometers/second. Divide these and you get 500 seconds, or 8 minutes and 20 seconds.

This is an average number. Remember, the Earth follows an elliptical orbit around the Sun, ranging from 147 million to 152 million km. At its closest point, sunlight only takes 490 seconds to reach Earth. And then at the most distant point, it takes 507 seconds for sunlight to make the journey.

But the story of light gets even more interesting, when you think about the journey light needs to make inside the Sun.

You probably know that photons are created by fusion reactions inside the Sun’s core. They start off as gamma radiation and then are emitted and absorbed countless times in the Sun’s radiative zone, wandering around inside the massive star before they finally reach the surface.

What you probably don’t know, is that these photons striking your eyeballs were ACTUALLY created tens of thousands of years ago and it took that long for them to be emitted by the sun.

Once they escaped the surface, it was only a short 8 minutes for those photons to cross the vast distance from the Sun to the Earth

As you look outward into space, you’re actually looking backwards in time.

The light you see from your computer is nanoseconds old. The light reflected from the surface of the Moon takes only a second to reach Earth. The Sun is more than 8 light-minutes away. And so, if the light from the nearest star (Alpha Centauri) takes more than 4 years to reach us, we’re seeing that star 4 years in the past.

There are galaxies millions of light-years away, which means the light we’re seeing left the surface of those stars millions of years ago. For example, the galaxy M109 is located about 83.5 million light-years away.

If aliens lived in those galaxies, and had strong enough telescopes, they would see the Earth as it looked in the past. They might even see dinosaurs walking on the surface.

We have written many articles about the Sun for Universe Today. Here’s an article about the color of the Sun, and here are some interesting facts about the Sun.

If you’d like more info on the Sun, check out NASA’s Solar System Exploration Guide on the Sun, and here’s a link to the SOHO mission homepage, which has the latest images from the Sun.

We’ve also recorded an episode of Astronomy Cast all about the Sun. Listen here, Episode 30: The Sun, Spots and All.

Source: NASA

The Sun Doesn’t Cause Earthquakes

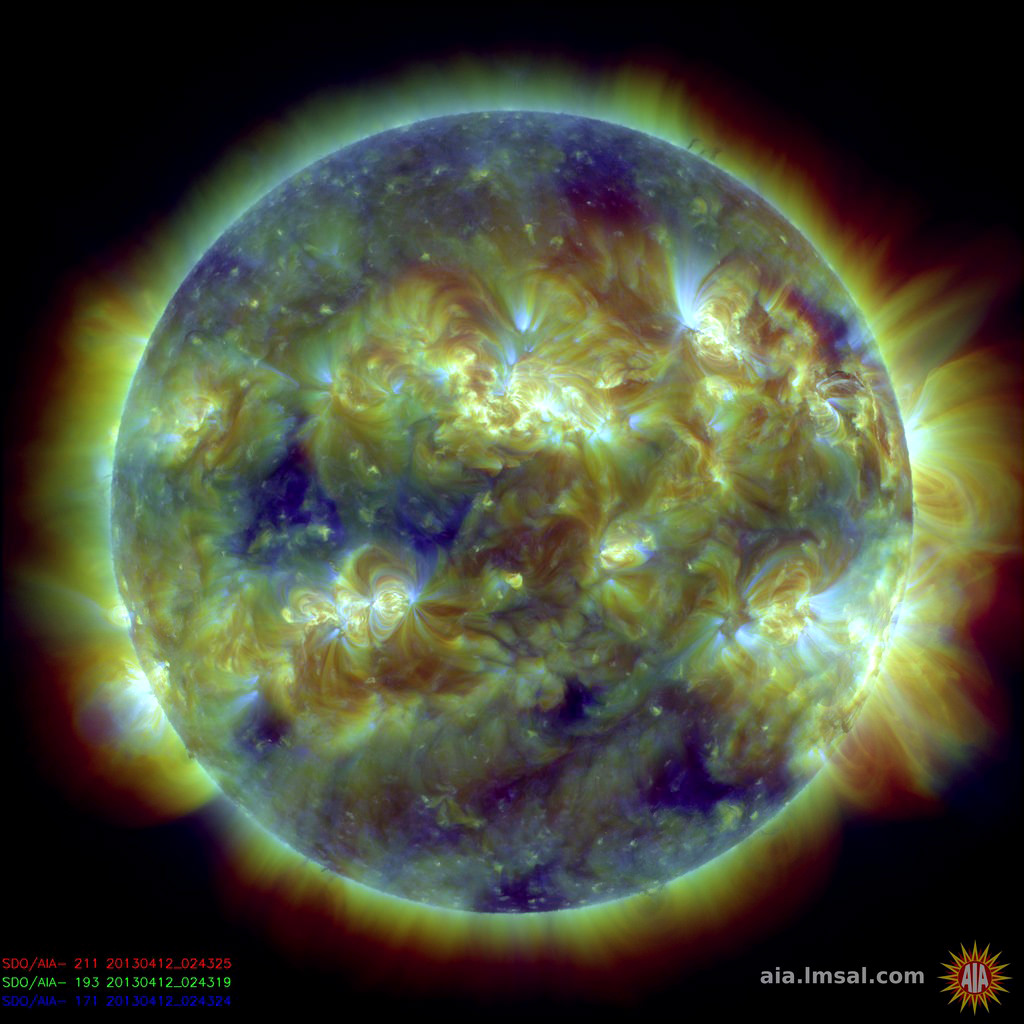
SDO/AIA image of the Sun from April 12

If that title seems like an obvious statement to you, it’s ok… it seems pretty obvious to me too. But there are those who have been suggesting — for quite some time, actually — that earthquakes can be triggered or strengthened by solar activity; that, in fact, exceptionally powerful solar flares, coronal mass ejections, and other outpourings from our home star can cause the planet’s crust to shift, shake, and shudder.

Except that that’s simply not true — at least, not according to a recent study by researchers from the USGS.

Researchers Dr. Jeffrey Love from the United States Geological Survey and Dr. Jeremy Thomas from Northwest Research Associates compared historical data of solar activity with earthquake occurrences around the world and found no definitive correlations… nothing to suggest that one directly influenced the other.

“Recently there’s been a lot of interest in this subject from the popular press, probably because of a couple of larger and very devastating earthquakes. This motivated us to investigate for ourselves whether or not it was true.”

– Jeffrey Love, USGS Research Geophysicist

Even when an earthquake may have been found to occur on the same day as increased solar activity, at other times during even stronger quakes the Sun may have been relatively quiet, and vice versa.

Damage in Anchorage from an earthquake on March 27, 1964. Solar activity at the time was unexceptional. (U.S. Army photo)

“There have been some earthquakes like the 9.5 magnitude Chile quake in 1960 where, sure enough, there were more sunspots and more geomagnetic activity than on average,” said Dr. Love. “But then for the Alaska earthquake in 1964 everything was lower than normal. There’s no obvious pattern between solar activity and seismicity, so our results were inconclusive.”

Basically, even though our planet orbits within the Sun’s outer atmosphere and we are subject to the space weather it creates — and there’s still a lot to be learned about that — observations do not indicate any connection between sunspots, flares, and CMEs and the shifting of our planet’s crust (regardless of what some may like to suggest.)

“It’s natural for scientists to want to see relationships between things,” said Love. “Of course, that doesn’t mean that a relationship actually exists!”

The team’s findings were published in the March 16, 2013 online edition of Geophysical Research Letters.

Read more in Harriet Jarlett’s article on Planet Earth Online, and for results from another study see Dr. Ryan O’Milligan’s article on TheSunToday.org.

(Oh, and the Moon doesn’t cause earthquakes either.)

Weekend Aurora Alert: The Sun Lets Loose an Earth-Directed CME

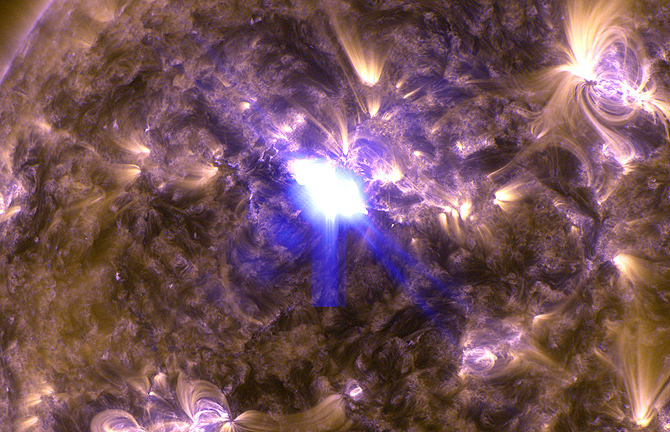
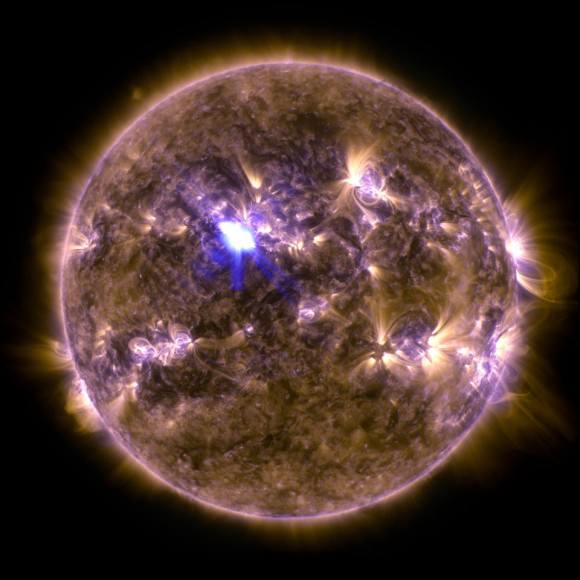
NASA's Solar Dynamics Observatory captured this image of an M6.5 class flare at 3:16 EDT on April 11, 2013. This image shows a combination of light in wavelengths of 131 and 171 Angstroms. Credit: NASA/SDO.

The Solar Dynamics Observatory captured this view as the Sun let loose with its biggest solar flare of the year so far. It’s not a real big one — a mid-level flare classified as an M6.5 – but an associated coronal mass ejection is heading towards Earth and could spur some nice auroae by this weekend. Spaceweather.com predicts the expanding cloud (see animation below) will probably deliver a glancing blow to Earth’s magnetic field late on April 12th or more likely April 13th. The NOAA Space Prediction Center forecasts this event to cause moderate (G2) Geomagnetic Storm activity, and predicts geomagnetic activity to start in the mid to latter part (UTC) of April 13. They add that the source region is still potent and well-positioned for more geoeffective activity in the next few days.

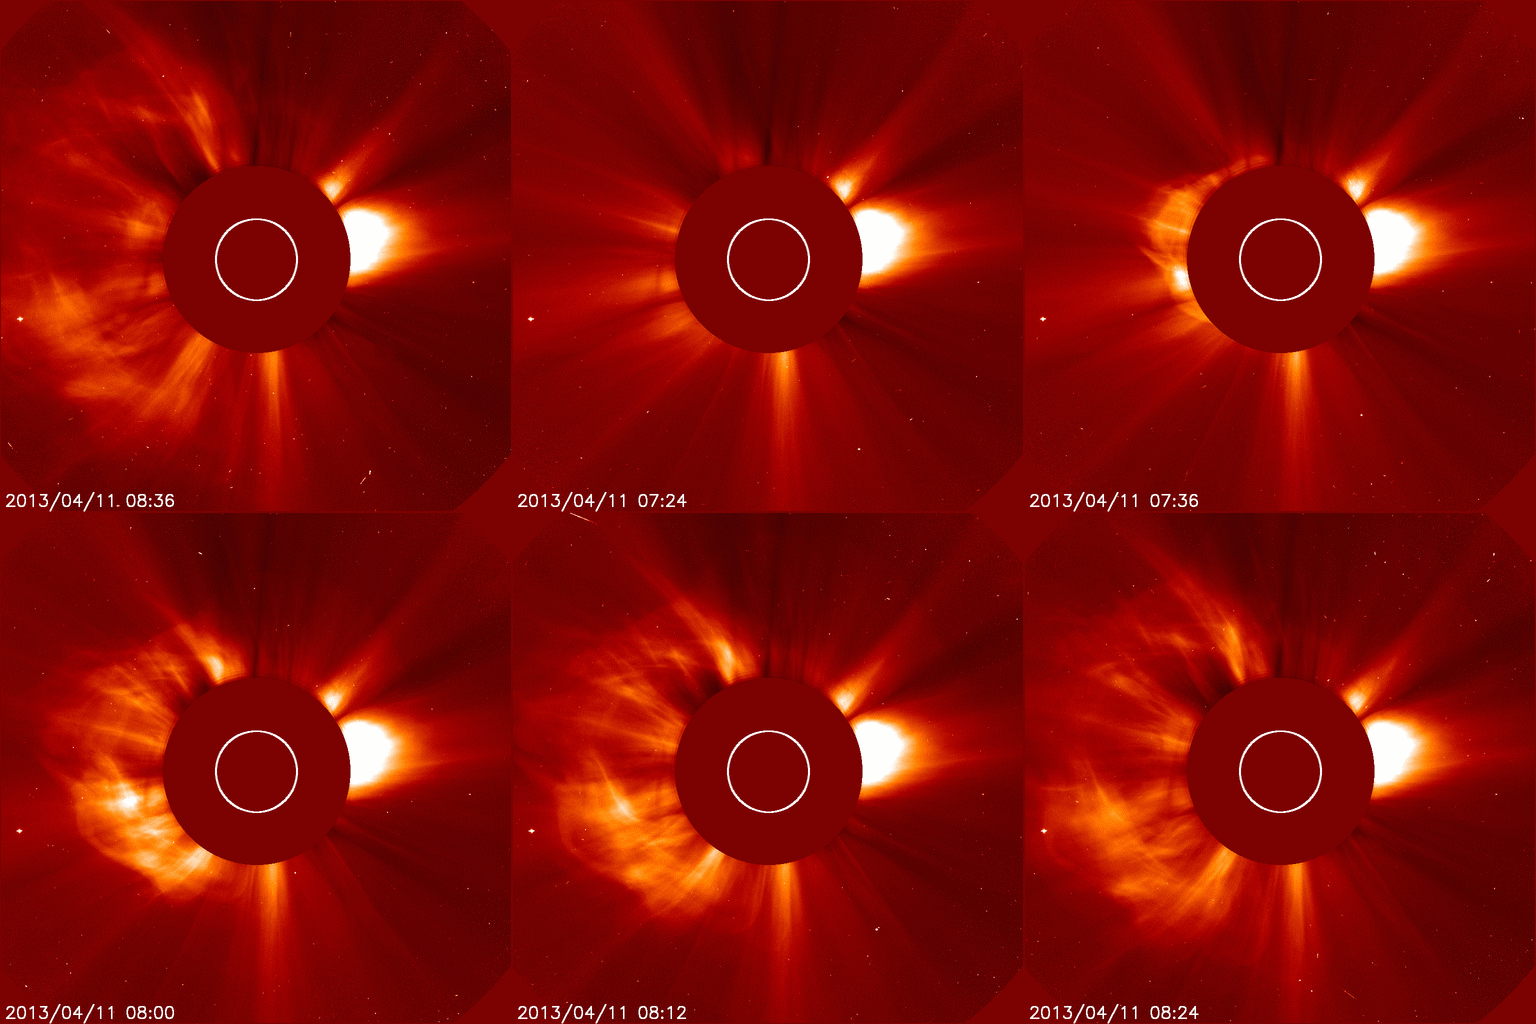
 The magnetic field of sunspot AR1719 erupted on April 11th at 0716 UT, producing an M6-class solar flare. Coronagraph images from the Solar and Heliospheric Observatory show a CME emerging from the blast site of the M6.5 solar flare. Credit: NASA
The magnetic field of sunspot AR1719 erupted on April 11th at 0716 UT, producing an M6-class solar flare. Coronagraph images from the Solar and Heliospheric Observatory show a CME emerging from the blast site of the M6.5 solar flare. Credit: NASA

See this NASA page for info on solar flares, CMEs, and more.

NASA's Solar Dynamics Observatory captured this image of an M6.5 class flare at 3:16 am EDT on April 11, 2013. This image shows a combination of light in wavelengths of 131 and 171 Angstroms. Credit: NASA/SDO.
NASA’s Solar Dynamics Observatory captured this image of an M6.5 class flare at 3:16 am EDT on April 11, 2013. This image shows a combination of light in wavelengths of 131 and 171 Angstroms. Credit: NASA/SDO.

Solar Spacecraft Gets a Little Loopy

Our own Sun produces flares, but we are protected by our magnetosphere, and by the distance from the Sun to Earth. Credit: NASA/ Solar Dynamics Observatory,

Twice a year, the Solar Dynamics Observatory performs a 360-degree roll about the axis on which it points toward the Sun. This produces some unique views, but the rolls are necessary to help calibrate the instruments, particularly the Helioseismic and Magnetic Imager (HMI) instrument, which is making precise measurements of the solar limb to study the shape of the Sun. The rolls also help the science teams to know how accurately the images are aligned with solar north.

But take this rolling imagery, add some goofy music and hopefully it adds a smile to your day!

Astrophotos: We Have Liftoff from the Sun!

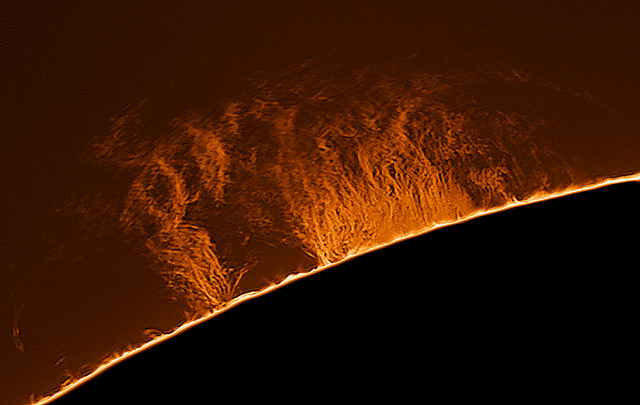
A large prominence from the Sun, on April 1, 2013. Credit and copyright: Paul Andrew.

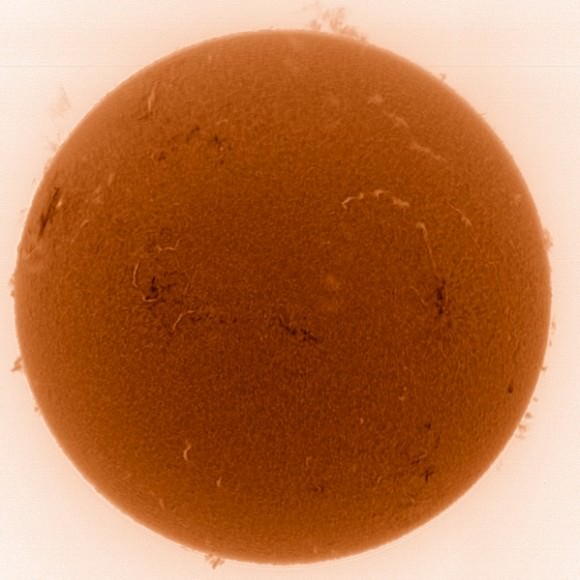
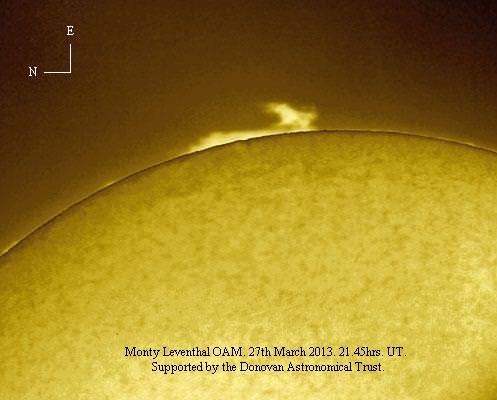
Here are three images showing large prominences recently lifting off from the Sun’s surface. Solar prominences are sheets or arcs of luminous gas emanating from the Sun’s surface. They can loop hundreds of thousands of kilometers into space. In the image below by noted Australian amatuer Monty Leventhal, he estimates the prominence he captured stretches 233,000 km! Against the Sun, prominences appear dark, but against the sky they appear brighter. Prominences are held above the Sun’s surface by strong magnetic fields and can sometimes last for long periods of time.

See more and varied views below:

A negative image of the Sun and large prominences on March 31, 2013. Credit and copyright: César Cantú.
This digital filtergram shows an active prominence on the SE limb of the Sun, stretching across for approximately 233,000 km on March 27, 2013. Credit and copyright: Monty Leventhal.

Want to get your astrophoto featured on Universe Today? Join our Flickr group or send us your images by email (this means you’re giving us permission to post them). Please explain what’s in the picture, when you took it, the equipment you used, etc.

Astrophoto: Jungle Sunset

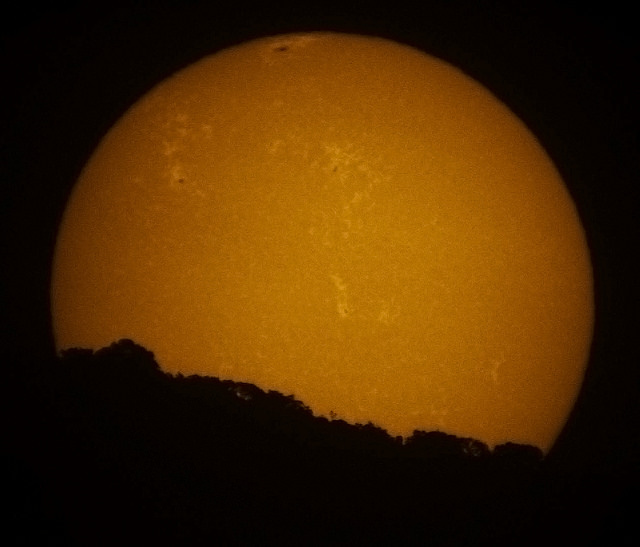
A big Sun sets behind the trees in Cairns, Queensland, Australia. Credit and copyright: Joseph Brimacombe.

They say that perspective is everything. In this case perspective and filters are what makes this such a great astrophoto! We’ve been following Joseph Brimacombe’s astrophotography for years, and have come to appreciate his ‘perspective!” This great zoom shot of the setting Sun was taken on March 31, 2013 using a calcium K-line Filter, using a a 60 mm Lunt CaK Solar Telescope at F/8.3 and a Skynyx 2-2 camera. It’s a single shot, but below, you can watch a negative version of the Sun sink below the horizon in a video of 1,350 frames shown at double speed.

Jungle Sunset Calcium K-line Filter: Long Video – March 31, 2013 from Joseph Brimacombe on Vimeo.

Want to get your astrophoto featured on Universe Today? Join our Flickr group or send us your images by email (this means you’re giving us permission to post them). Please explain what’s in the picture, when you took it, the equipment you used, etc.

This is What Can Happen When a CME Hits Earth

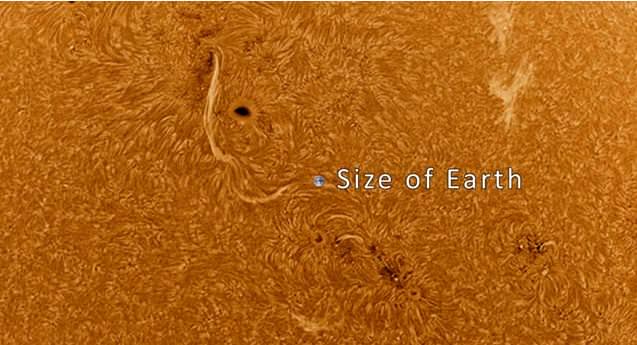
The size of Earth compared to sunspot AR1692 on March 15, 2013. Screenshot from the video by Göran Strand.

This video taken by Göran Strand from Östersund, Sweden shows what happened on March 17, 2013 when a Coronal Mass Ejection hit Earth’s magnetic field. Two days earlier, sunspot AR1692 had produced a M1-class solar flare that resulted in the CME that hit Earth.

This time lapse from an all-sky camera captures the magnificent sky show between 19:20 and 23:35 UT on the 17th.

Strand said via email that this time lapse consists of 2464 raw images for a total data amount of 30Gb from the 17th. The stunning photo of the Sun is a hydrogen alpha mosaic he made from 10 images that was captured on March 16.

Beautiful!