Astronomers Think They Know Why Hot Jupiters Get So Enormous

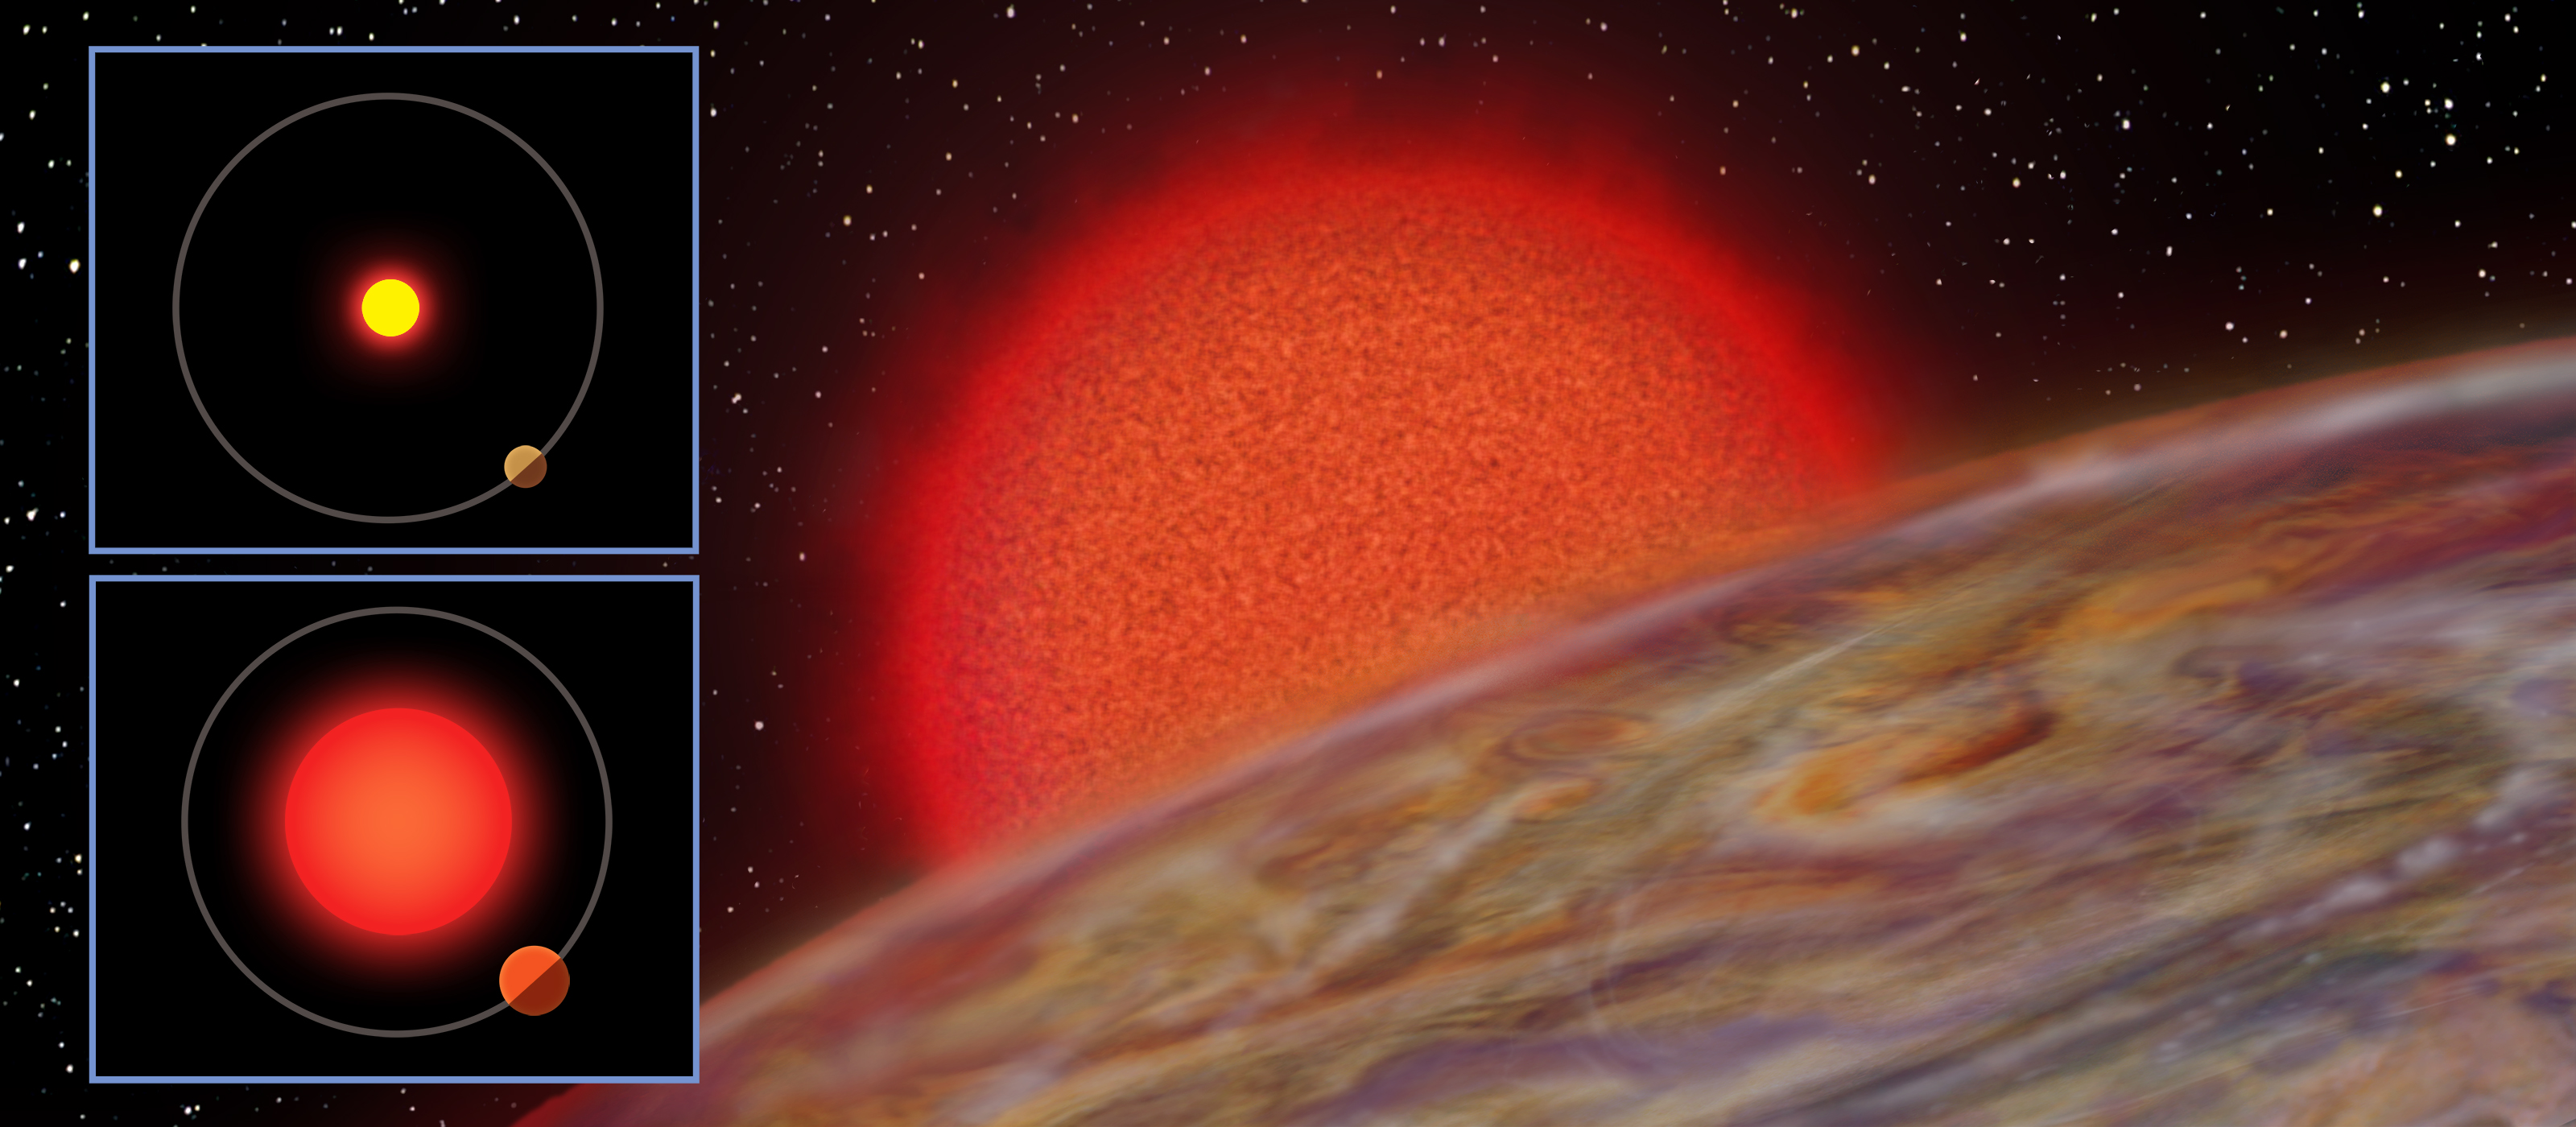
Artist's impression of the K2-132 system, along with schematics of the star during its main sequence and Red Branch Phase. Credit: Karen Teramura/UH IfA

The study of extra-solar planets has revealed some fantastic and fascinating things. For instance, of the thousands of planets discovered so far, many have been much larger than their Solar counterparts. For instance, most of the gas giants that have been observed orbiting closely to their stars (aka. “Hot Jupiters”) have been similar in mass to Jupiter or Saturn, but have also been significantly larger in size.

Ever since astronomers first placed constraints on the size of a extra-solar gas giant seven years ago, the mystery of why these planets are so massive has endured. Thanks to the recent discovery of twin planets in the K2-132 and K2-97 system – made by a team from the University of Hawaii’s Institute for Astronomy using data from the Kepler mission – scientists believe we are getting closer to the answer.

The study which details the discovery – “Seeing Double with K2: Testing Re-inflation with Two Remarkably Similar Planets around Red Giant Branch Stars” – recently appeared in The Astrophysical Journal. The team was led by Samuel K. Grunblatt, a graduate student at the University of Hawaii, and included members from the Sydney Institute for Astronomy (SIfA), Caltech, the Harvard-Smithsonian Center for Astrophysics (CfA), NASA Goddard Space Flight Center, the SETI Institute, and multiple universities and research institutes.
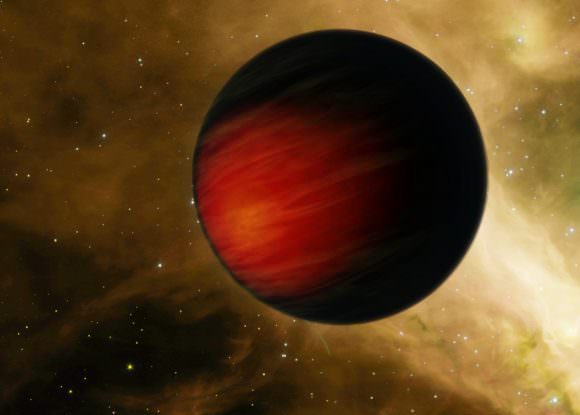
Artist’s concept of Jupiter-sized exoplanet that orbits relatively close to its star (aka. a “hot Jupiter”). Credit: NASA/JPL-Caltech)

Because of the “hot” nature of these planets, their unusual sizes are believed to be related to heat flowing in and out of their atmospheres. Several theories have been developed to explain this process, but no means of testing them have been available. As Grunblatt explained, “since we don’t have millions of years to see how a particular planetary system evolves, planet inflation theories have been difficult to prove or disprove.”

To address this, Grunblatt and his colleagues searched through the data collected by NASA’s Kepler mission (specifically from its K2 mission) to look for “Hot Jupiters” orbiting red giant stars. These are stars that have exited the main sequence of their lifespans and entered the Red Giant Branch (RGB) phase, which is characterized by massive expansion and a decrease in surface temperature.

As a result, red giants may overtake planets that orbit closely to them while planets that were once distant will begin to orbit closely. In accordance with a theory put forth by Eric Lopez – a member of NASA Goddard’s Science and Exploration Directorate – hot Jupiter’s that orbit red giants should become inflated if direct energy output from their host star is the dominant process inflating planets.

So far, their search has turned up two planets – K2-132b and K2-97 b – which were almost identical in terms of their orbital periods (9 days), radii and masses. Based on their observations, the team was able to precisely calculate the radii of both planets and determine that they were 30% larger than Jupiter. Follow-up observations from the W.M. Keck Observatory at Maunakea, Hawaii, also showed that the planets were only half as massive as Jupiter.
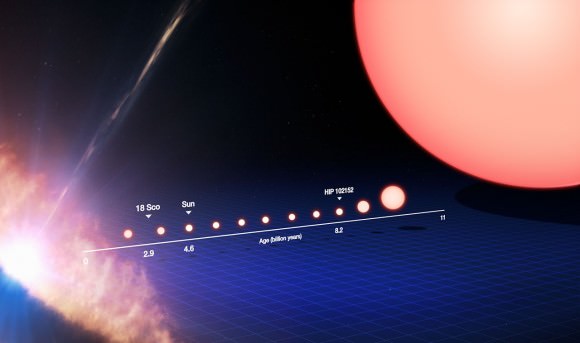
The life-cycle of a Sun-like star from protostar (left side) to red giant (near the right side) to white dwarf (far right). Credit: ESO/M. Kornmesser

The team then used models to track the evolution of the planets and their stars over time, which allowed them to calculate how much heat the planets absorbed from their stars. As this heat was transferring from their outer layers to their deep interiors, the planets increased in size and decreased in density. Their results indicated that while the planets likely needed the increased radiation to inflate, the amount they got was lower than expected.

While the study is limited in scope, Grunblatt and his team’s study is consistent with the theory that huge gas giants are inflated by the heat of their host stars. It is bolstered by other lines of evidence that hint that stellar radiation is all a gas giant needs to dramatically alter its size and density. This is certainly significant, given that our own Sun will exit its main sequence someday, which will have a drastic effect on our system of planets.

As such, studying distant red giant stars and what their planets are going through will help astronomers to predict what our Solar System will experience, albeit in a few billion years. As Grunblatt explained in a IfA press statement:

“Studying how stellar evolution affects planets is a new frontier, both in other solar systems as well as our own. With a better idea of how planets respond to these changes, we can start to determine how the Sun’s evolution will affect the atmosphere, oceans, and life here on Earth.”

It is hoped that future surveys which are dedicated to the study of gas giants around red giant stars will help settle the debate between competing planet inflation theories. For their efforts, Grunblatt and his team were recently awarded time with NASA’s Spitzer Space Telescope, which they plan to use to conduct further observations of K2-132 and K2-97, and their respective gas giants.

The search for planets around red giant stars is also expected to intensify in the coming years with he deployment of NASA’s Transiting Exoplanet Survey Satellite (TESS) and the  James Webb Space Telescope (JWST). These missions will be launching in 2018 and 2019, respectively, while the K2 mission is expected to last for at least another year.

Further Reading: IfA, The Astronomical Journal

“Eye of Sauron” Galaxy Used For New Method of Galactic Surveying

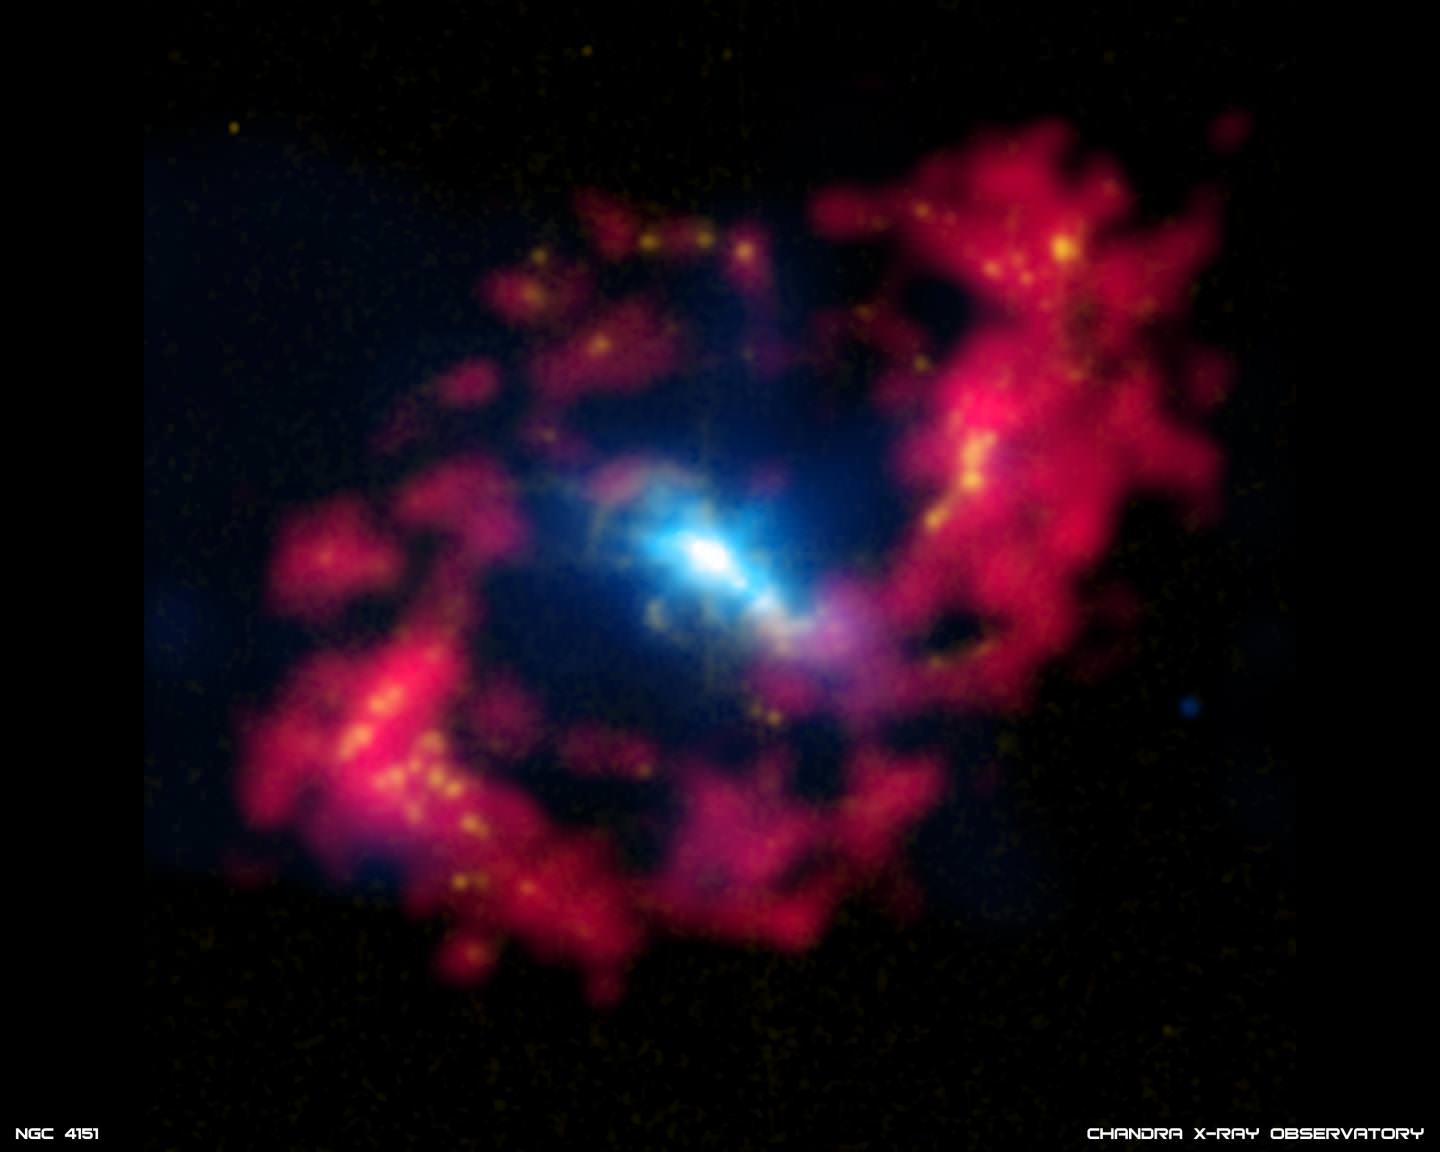
Image of the spiral galaxy NGC 4151, aka. "Sauron's Eye". Credit: X-ray: NASA/CXC/CfA/J.Wang et al.; Optical: Isaac Newton Group of Telescopes, La Palma/Jacobus Kapteyn Telescope; Radio: NSF/NRAO/VLA.

Determining the distance of galaxies from our Solar System is a tricky business. Knowing just how far other galaxies are in relation to our own is not only key to understanding the size of the universe, but its age as well. In the past, this process relied on finding stars in other galaxies whose absolute light output was measurable. By gauging the brightness of these stars, scientists have been able to survey certain galaxies that lie 300 million light years from us.

However, a new and more accurate method has been developed, thanks to a team of scientists led by Dr. Sebastian Hoenig from the University of Southampton. Similar to what land surveyors use here on Earth, they measured the physical and angular (or apparent) size of a standard ruler in the galaxy to calibrate distance measurements.

Hoenig and his team used this method at the W. M. Keck Observatory, near the summit of Mauna Kea in Hawaii, to accurately determine for the first time the distance to the NGC 4151 galaxy – otherwise known to astronomers as the “Eye of Sauron”. Continue reading ““Eye of Sauron” Galaxy Used For New Method of Galactic Surveying”

Kapow! Keck Confirms Puzzling Element of Big Bang Theory

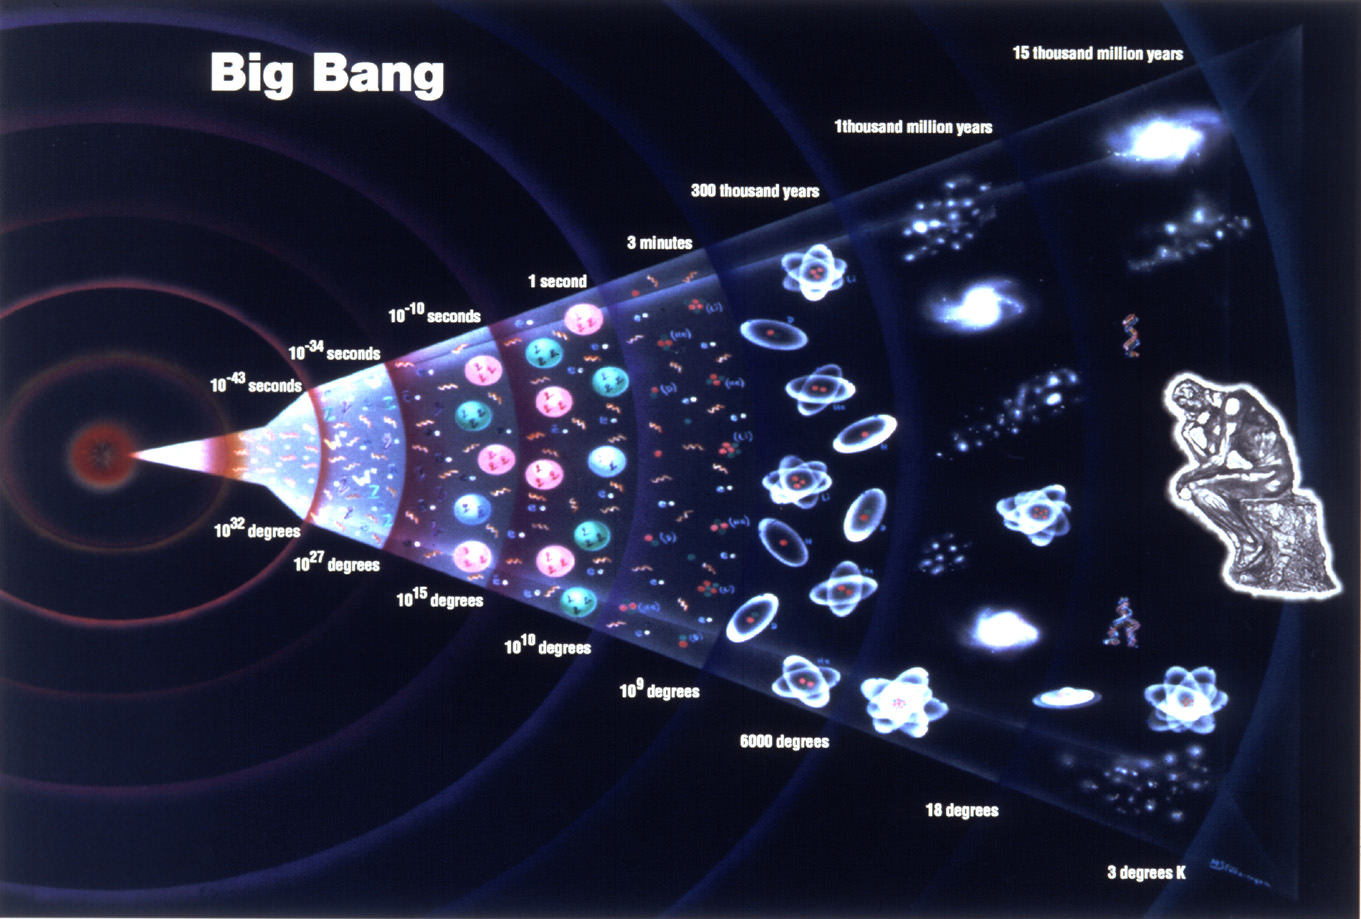
Illustration of the Big Bang Theory
The Big Bang Theory: A history of the Universe starting from a singularity and expanding ever since. Credit: grandunificationtheory.com

Observations of the kaboom that built our universe — known as the Big Bang — is better matching up with theory thanks to new work released from one of the twin 33-foot (10-meter) W.M. Keck Observatory telescopes in Hawaii.

For two decades, scientists were puzzled at a lithium isotope discrepancy observed in the oldest stars in our universe, which formed close to the Big Bang’s occurrence about 13.8 billion years ago. Li-6 was about 200 times more than predicted, and there was 3-5 times less Li-7 — if you go by astronomical theory of the Big Bang.

The fresh work, however, showed that these past observations came up with the strange numbers due to lower-quality data that, in its simplifications, created more lithium isotopes detections than are actually present. Keck’s observations found no discrepancy.

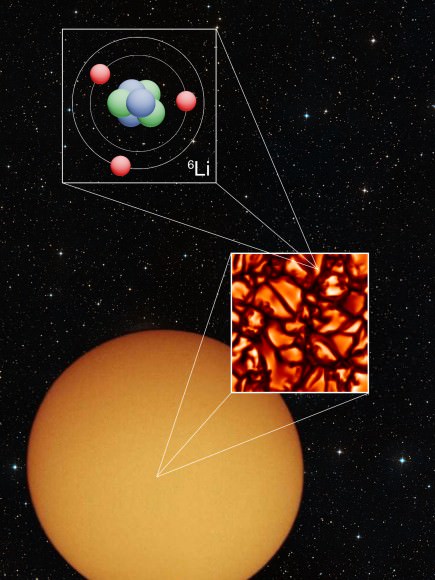
Artist's conception of a metal-poor star. Astronomers modelled a portion of its surface to figure out its abundance of lithium-6, an element that was previously in discrepancy between Big Bang theory and observations of old stars. Credit: Karin Lind, Davide De Martin.
Artist’s conception of a metal-poor star. Astronomers modelled a portion of its surface to figure out its abundance of lithium-6, an element that was previously in discrepancy between Big Bang theory and observations of old stars. Credit: Karin Lind, Davide De Martin.

“Understanding the birth of our universe is pivotal for the understanding of the later formation of all its constituents, ourselves included,” stated lead researcher Karin Lind, who was with the Max Planck Institute for Astrophysics in Munich when the work was performed.

“The Big Bang model sets the initial conditions for structure formation and explains our presence in an expanding universe dominated by dark matter and energy,” added Lind, who is now with the University of Cambridge.

To be sure, it is difficult to measure lithium-6 and lithium-7 because their spectroscopic “signatures” are pretty hard to see. It takes a large telescope to be able to do it. Also, modelling the data can lead to accidental detections of lithium because some of the processes within these old stars appear similar to a lithium signature.

Keck used a high-resolution spectrometer to get the images and gazed at each star for several hours to ensure astronomers got all the photons it needed to do analysis. Modelling the data took several more weeks of work on a supercomputer.

The research appeared in the June 2013 edition of Astronomy & Astrophysics. You can check out the entire paper here.

Source: Keck Observatory

Surprise! Galaxies Still Evolving in Present Universe

A giant spiral of gas dust and stars, Messier 101 spans 170,000 light-years and contains more than a trillion stars. Astronomers have uncovered a surprising trend in galaxy evolution where galaxies like M101 and the Milky Way Galaxy continued to develop into settled disk galaxies long after previously thought. Credit: NASA/ESA Hubble

Graceful in their turnings, spiral galaxies were thought to have reached their current state billions of years ago. A study of hundreds of galaxies, however, upsets that notion revealing that spiral galaxies, like the Andromeda Galaxy and our own Milky Way, have continued to change.

“Astronomers thought disk galaxies in the nearby universe had settled into their present form by about 8 billion years ago, with little additional development since,” said Susan Kassin, an astronomer at NASA’s Goddard Space Flight Center in Greenbelt, Md., and the study’s lead researcher in a press release. “The trend we’ve observed instead shows the opposite, that galaxies were steadily changing over this time period.”

A study of 544 star-forming galaxies observed by the Earth-based Keck and Hubble Space Telescope shows that disk galaxies like our Milky Way Galaxy unexpectedly reached their current state long after much of the universe’s star formation had ceased. Credit: NASA’s Goddard Space Flight Center

Astronomers used the twin 10-meter earth-bound W.M. Keck Observatory atop Hawaii’s Mauna Kea volcano and NASA’s Hubble Space Telescope to study 544 star-forming galaxies. Farther back in time, galaxies tend to be very different, say astronomers, with random and disorganized motions. Nearer to the present, star-forming galaxies look like well-ordered disk-shaped systems. Rotation in these galaxies trumps other internal, random motions. These galaxies are gradually settling into well-behaved disks with the most massive galaxies always showing higher organization.

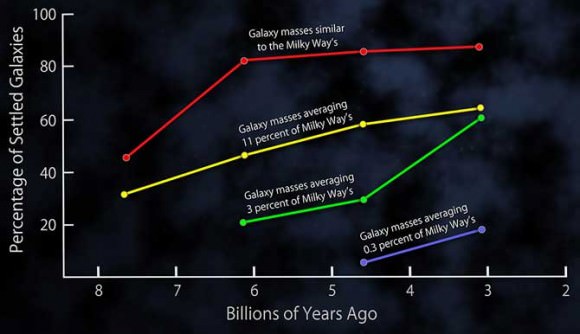
This plot shows the fractions of settled disk galaxies in four time spans, each about 3 billion years long. There is a steady shift toward higher percentages of settled galaxies closer to the present time. At any given time, the most massive galaxies are the most settled. More distant and less massive galaxies on average exhibit more disorganized internal motions, with gas moving in multiple directions, and slower rotation speeds. Credit: NASA’s Goddard Space Flight Center

The sampling of galaxies studied, from the Deep Extragalactic Evolutionary Probe 2 (DEEP2) Redshift Survey, ranged between 2 billion and 8 billion light-years from Earth with masses between 0.3 percent to 100 percent that of our own Milky Way Galaxy. Researchers looked at all galaxies in this time range with emission lines bright enough to determine internal motions. Researchers focused on emission lines characteristically emitted by gas within the galaxy. The emission lines not only tell scientists about the elements that make up the galaxies but also red shifting of emission lines contains information on the internal motions and distance.

“Previous studies removed galaxies that did not look like the well-ordered rotating disks now common in the universe today,” said co-author Benjamin Weiner, an astronomer at the University of Arizona in Tucson. “By neglecting them, these studies examined only those rare galaxies in the distant universe that are well-behaved and concluded that galaxies didn’t change.”

In the past 8 billion years, mergers between galaxies, both large and small, has decreased. So has the overall rate of star formation and associated disruptions due to supernovae explosions. Both factors may play a role in the newly found trend, say scientists.

The Milky Way Galaxy may have gone through the same chaotic growing and changing as the galaxies in the DEEP2 sample before settling into its present state at just about the same time the Sun and Earth were forming, say team scientists. By observing the pattern, astronomers can now adjust computer simulations of galaxy evolution until they replicate the observations. Then the hunt will be on to determine the physical processes responsible for the trend.

This cosmological simulation follows the development of a single disk galaxy throughout the life of the Universe; about 13.5 billion years. Red colors show old stars, young stars show as white and bright blue while the distribution of gas shows as a pale blue. The computer-generated view spans about 300,000 light-years. The simulation, running on the Pleiades supercomputer at NASA’s Ames Research Center in Moffett Field, California, took about 1 million CPU hours to complete. Credit: F. Governato and T. Quinn (Univ. of Washington), A. Brooks (Univ. of Wisconsin, Madison), and J. Wadsley (McMaster Univ.).

A paper detailing the findings will be published in the October 20, 2012 The Astrophysical Journal.

Source: NASA